Download as PDF, PPTX
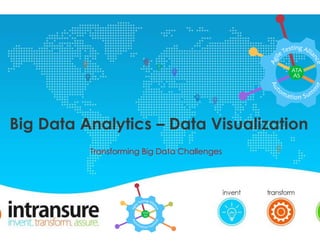


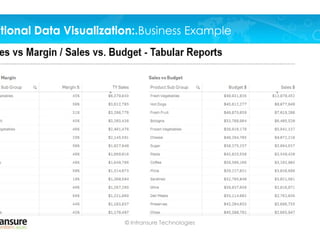


Data visualization can transform big data challenges by telling stories with data. It allows large amounts of complex data to be understood quickly through visual representations like charts and graphs. Effective data visualization improves communication, helps identify patterns and trends, and enables faster decision making. The right visualizations should be chosen based on the type of data to ensure the most insightful analysis.

![Tiger graph 2021 corporate overview [read only]](https://cdn.slidesharecdn.com/ss_thumbnails/tigergraph2021corporateoverviewread-only-211014093106-thumbnail.jpg?width=640&height=640&fit=bounds)