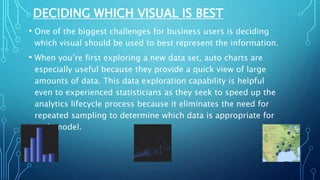
Data visualization is a technique for representing data in a graphical format to help people understand the significance of the data. It enables decision makers to see analytics visually and identify patterns. Data visualization is important as it can identify areas needing improvement, clarify factors influencing customer behavior, and help predict sales. It provides advantages like enhanced business insights, trend identification, and predictive analysis. Choosing the right visual is key to effective data visualization.