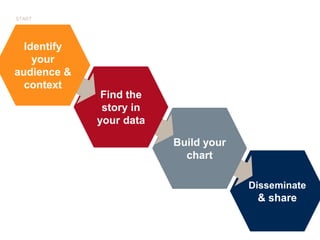
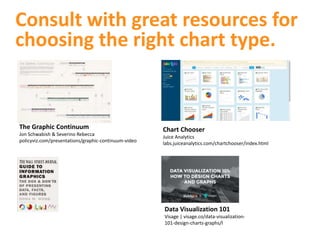
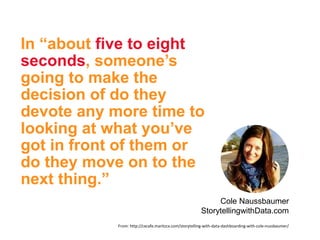
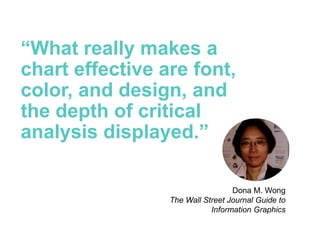
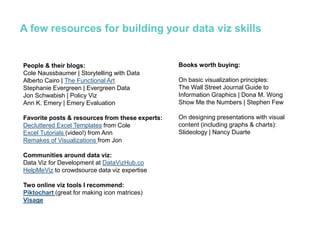
This document provides guidance on effective data visualization. It emphasizes starting with the audience and their needs, identifying the key story or message in the data, and using simple, clear design principles. Charts should be designed in 5-8 seconds to engage the audience. The document recommends several resources for choosing effective chart types and improving visualization skills. Overall, it stresses the importance of visualization in empowering stakeholders to make informed decisions.
Delhi Call Girls CP 9711199171 ââđâ Whatsapp Hard And Sexy Vip Call
Â
Effective Visualizations Help Stakeholders
1.
2. Amanda Makulec
Program Manager & RME Associate
John Snow, Inc.
Passionate about
how visualizing data
effectively can
empower people to
make decisions.
3. This Summit has
been all about
collecting, sharing, quality-checking,
streamlining, improving, visualizing
data.
14. On the most common visualization mistakes
âTime isnât adequately
spent on is just what is the
question that youâre trying
to answer and what does
your audience need
to know?â
Cole Naussbaumer
StorytellingwithData.com
From: http://cxcafe.maritzcx.com/storytelling-with-data-dashboarding-with-cole-nussbaumer/
17. For more complex data
analysis tools like dashboards,
it is especially important to
engage your end user to
understand their needs.
Image credit: Beth Kanter
18. Identify the story you want to tell &
consider additional available data.
19. The most important
question in visualization:
Read more at: http://stephanieevergreen.com/most-important-question/
Stephanie Evergreen
Evergreen Data
Whatâs your point?
24. Consider the kind of data
story you have.
Distribution Part to Whole Correlation
Time Series Compare
Categories
Ranking
Image credit: Column Five Mediaâs Visage Data Visualization 101
25. Consult with great resources for
choosing the right chart type.
The Graphic Continuum
Jon Schwabish & Severino Rebecca
policyviz.com/presentations/graphic-continuum-video
Chart Chooser
Juice Analytics
labs.juiceanalytics.com/chartchooser/index.html
Data Visualization 101
Visage | visage.co/data-visualization-
101-design-charts-graphs/l
27. Plan for how youâll share your
visualization when itâs complete.
28. In âabout five to eight
seconds, someoneâs
going to make the
decision of do they
devote any more time to
looking at what youâve
got in front of them or
do they move on to the
next thing.â
Cole Naussbaumer
StorytellingwithData.com
From: http://cxcafe.maritzcx.com/storytelling-with-data-dashboarding-with-cole-nussbaumer/
30. âWhat really makes a
chart effective are font,
color, and design, and
the depth of critical
analysis displayed.â
Dona M. Wong
The Wall Street Journal Guide to
Information Graphics
32. Title & labels
Are you clear and
succinct (6-12 words),
telling your reader the key
takeaway & including
labels that are essential?
Recommendation of 6-12 words from the Data Visualization Checklist http://stephanieevergreen.com/dataviz-checklist/
36. District 1
District 2
District 3
32%
District 4
24%
District 5
Year 1 Year 2 Year 3 Year 4 Year 5
District 4 was the only district where coverage
declined during the five year project.
37. Change in BMI status of women 20-49
years from 1980 to 2008 by region
1980 2008
Data table from: Black RE, Victora CG, Walker SP, Bhutta ZA, Christian P, de Onis M, Ezzati M, Grantham-McGregor S, Katz J, Martorell R,
Uauy R. Maternal and child undernutrition and overweight in low-income and middle-income countriesâ The Lancet 2013; (06 June
2013) DOI: 10.1016/S0140-6736(13)60937-X.
38. The proportion of women who are overweight has
increased in low and middle income countries.
45. A few resources for building your data viz skills
People & their blogs:
Cole Naussbaumer | Storytelling with Data
Alberto Cairo | The Functional Art
Stephanie Evergreen | Evergreen Data
Jon Schwabish | Policy Viz
Ann K. Emery | Emery Evaluation
Favorite posts & resources from these experts:
Decluttered Excel Templates from Cole
Excel Tutorials (video!) from Ann
Remakes of Visualizations from Jon
Communities around data viz:
Data Viz for Development at DataVizHub.co
HelpMeViz to crowdsource data viz expertise
Two online viz tools I recommend:
Piktochart (great for making icon matrices)
Visage
Books worth buying:
On basic visualization principles:
The Wall Street Journal Guide to
Information Graphics | Dona M. Wong
Show Me the Numbers | Stephen Few
On designing presentations with visual
content (including graphs & charts):
Slideology | Nancy Duarte
46. For the simple graph icons from the Visage Data Visualization 101 eBook and
allowing us to share their eBook during our activity today.
Visage was born out of Column Five, an industry-leading infographics and visual
content agency with offices in Irvine, CA and Brooklyn, NY. Visage is a simple
design platform that enables content marketers to create beautiful, on-brand
data visualizations and visual content. Our leadership team has been working
together for more than 5 years, and our focus is to help companies use
visualization and great design to communicate more effectively.
Thanks toâŚ
For providing the space & time to host this workshop.
The Measurement and Accountability for Results in Health (#MA4Helath)
Summit brought together world leaders to construct a common agenda to
improve and sustain country measurement and accountability systems for
health results in the post-2015 era. Our thanks to USAID, WHO, and the
World Bank who lead the organization and coordination of the event.
Donors? Program managers? Ministers of health? Your boss?
Range between very low number literacy - understanding rates/ratios/percents â understanding regression, odds ratios, etc.
What information are you collecting? How is it actionable? Is it real time? Will you be able to identify trends, interesting findings, etc that will help guide the path of a project? Can you contribute to the broader health movement?
An advantage of collecting data using mobile phones or other forms of technology is that the data is often of higher quality and already in a format that facilitates visualization with simple tools.
Secondary data can be a powerful addition to routine monitoring data or evaluation data, by providing information about the context and framing.
Great resources on
Your data viz team can be wide and varied. While involving additional people can mean added consultation and time, you benefit from additional expertise and opinions.
Consider bringing in your