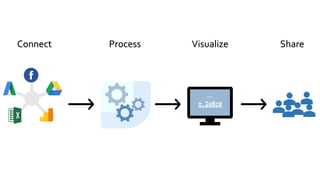
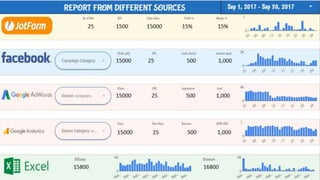
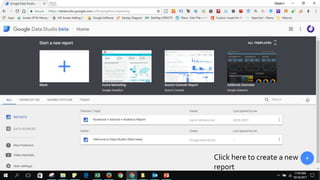
Google Data Studio is a reporting tool which turn your data into informative dashboards and reports that are easy to read, easy to share, and fully customizable.
[Webinar Deck] Google Data Studio for Mastering the Art of Data VisualizationsTatvic Analytics
In this webinar, we will take you through the basics of Google Data Studio and enable you to unlock the true value of data when converted into insights. With Google Data Studio, you can turn your data into informative dashboards and monthly reports that are easy to read, easy to share and fully customizable.
Successful data visualization designs are built by smart teams with varied skill sets using advanced visualization tools. This is not an easy combination to find, but we’ll help you get started.
Google recently announced a free version of Google Data Studio which is designed for "individuals and smaller teams. Here are the details. Learn how to create beautiful reports using the new Google Data Studio. Data Studio makes it easy to connect to your data, visualize that data, and share and collaborate with colleagues and customers.
Getting Started with Google Data StudioChris Burgess
Presented at the Melbourne SEO Meetup in September 2019, this slide deck offers a broad overview of the Google Data Studio product. It includes a walk through of the main features, resources to help you learn more, as well as some tips to help you with your own custom dashboards and reports.
How we configure Google data studio to enhance reporting for Google Google Analytics, Search Console, Pay Per Click, Google Adwords, Youtube Marketing and more.
Webinar replay: » https://www.owox.com/c/1vp
One of the steps to making better business decisions is to convey data in a compelling, easy-to-understand manner.
This is when visualization tools come to the aid.
Google Data Studio 360 in Google Analytics 360 Suite is a whole new visualization tool that takes data-driven decision making to a much higher level. It features everything you need to bring your data together, turn it into informative, beautiful reports and dashboards and share them with your colleagues and clients.
Join us for the webinar to find out:
✔How to start using the free version of Google Data Studio;
✔How to connect data sources to Google Data Studio: opportunities and pitfalls;
✔How to create interactive dashboards and charts, how to use filters and manage date ranges;
✔How to add and manage access to the data;
✔How to answer the key questions on a single screen: examples of ready-made dashboards for marketing, IT and UX specialists.
Looker Studio: Empowering Data Insights" - This dynamic PowerPoint presentation introduces Looker Studio, a powerful data analytics platform designed to streamline data exploration, visualization, and collaboration. Discover how Looker Studio's advanced analytics tools enable businesses to gain deeper insights, predict trends, and make data-driven decisions with confidence. Learn how its intuitive interface and real-time data sharing features enhance cross-functional collaboration, fostering a data-driven culture within the organization. Unleash the potential of Looker Studio and master the art of data visualization to drive efficiency and success.
Google Data Studio, The Best Free Tool You're Not Using! Introduction to Google's dashboard and reporting tool for analytics. Presented at NC Tech 4 Good Conference, June 5, 2018 Durham, NC
Power BI is a business analytics service by Microsoft. It aims to provide interactive visualizations and business intelligence capabilities with an interface simple enough for end users to create their own reports and dashboards.
This presentation will give you an overview of what Microsoft Power BI is. What are its features. Why it is an upcoming popular Data Visualization tool in the market. How to use it and comparison with other Visualization tools.
Power BI Tutorial For Beginners | Power BI Tutorial | Power BI Demo | Power B...Edureka!
( Power BI Training - https://www.edureka.co/power-bi-training )
This Edureka videoon "Power BI Tutorial" will provide you with the fundamental knowledge on Power BI (Blog: https://goo.gl/uFTDU3). Below are the topics covered in this tutorial:
1. Why do we need Business Intelligence?
2. What is Self Service Business Intelligence?
3. Why Power BI?
4. What is Power BI?
5. Demo: Report and Dashboard Creation
Power BI has become a product with a ton of exciting features. This presentation will give an overview of some of them, including Power BI Desktop, Power BI service, what’s new, integration with other services, Power BI premium, and administration.
Two of the tech industry’s essential front runners providing business intelligence solutions are Microsoft’s Power BI and Tableau. These leaders of data visualization help businesses narrow down and analyze their data with powerful built-in tools and clear visualizations. Each platform has distinctive strengths and weaknesses that should be considered before deciding on a business intelligence software.
Power BI Online Training hyderabad | Power BI online Course Cynix Technologies
The most recent update of Power BI enables clients to bookmark their most-utilized Power BI report and dashboard bundles.Get more information at Power BI online Training
Get technically equipped to grow and build your Power BI (Business Intelligence) practice, enabling you to offer new solutions and services to customers. With Power BI, you can transform your customers' data into rich visuals they can collect and organize, helping them focus on what matters most to their businesses.
The content of this presentation are the following:
- Overview of the Google Drive
- The History of the Logo, and the logo itself
- Founders of Google
- Features of Google Drive
Google and Artificial Intelligence: Things You Should Know PaulDonahue16
In 2012, Google established a team dedicated to researching and applying artificial intelligence (AI). This team is now known as Google AI. Through deep learning systems and AI advancement, Google AI developed products and services that help in augmenting people's capability to accomplish more.
Advanced Digital Media Services tackles points about these developments to help you see how they affect our lives in positive ways.
https://advdms.com/blog/google-and-artificial-intelligence-things-you-should-know/
Google Apps is a cloud-based productivity suite that helps you and your team connect and get work done from anywhere on any device.
It’s distinctive advantages are:
+ Very low risk thanks to the cloud architecture with guaranteed 99.9+% uptime and complete data redundancy
+ Lower cost compared to on-premise configuration
+ High scalability that makes it easy to grow your business
+ Efficient collaboration tools that allow your employees to work together in real time
Jeff Dean at AI Frontiers: Trends and Developments in Deep Learning ResearchAI Frontiers
In this talk at AI Frontiers conference, Jeff Dean discusses recent trends and developments in deep learning research. Jeff touches on the significant progress that this research has produced in a number of areas, including computer vision, language understanding, translation, healthcare, and robotics. These advances are driven by both new algorithmic approaches to some of these problems, and by the ability to scale computation for training ever large models on larger datasets. Finally, one of the reasons for the rapid spread of the ideas and techniques of deep learning has been the availability of open source libraries such as TensorFlow. He gives an overview of why these software libraries have an important role in making the benefits of machine learning available throughout the world.
We are seeing an explosion of the use of Bots in the areas of sales and customer service, but what makes a Chatbot useful? During the recent rise in Chatbot popularity we have seen many bad deployments, so how can you avoid the pitfalls and ensure your Bot succeeds?
Join us to learn all about the new world of Chatbots, Artificial Intelligence, Neuro-linguistic programming, Machine Learning and best practices for deploying the technology for your business.
The future of artificial intelligence in the workplaceONPASSIVE
Onpassive is the most advanced Artificial Intelligence-driven digital tool which helps any IT company to improve their outreach & productivity. It is an application that provides computer systems with the ability to learn and grow from experience without being explicitly programmed automatically.
One kind of artificial intelligence, known as generative AI, strives to simulate human ingenuity by generating original works of art like photographs, music, and even videos. Generative AI has the potential to disrupt a wide range of fields by combining deep learning methods with large datasets, from the creative arts to medicine to industry.
Empowering Mobile Collaboration for Today’s Workforce without losing control!...Mobile Edge Event
The business workplace has evolved dramatically with mobility now a key determinant of success...or failure. Security concerns exist however around possible data loss and "shadow IT" and these must be managed effectively in order to balance user agility with corporate governance. Join Box to understand how enterprises are making secure mobile collaboration a reality and transforming how work gets done
Aguai Solutions is a Software Technology Solutions company with a focus on Healthcare and IT powered businesses. We offer Product Engineer and Software Services with high technology capabilities on Web, Cloud, Social, Mobile, Analytics and Marketing Automation
An overview of Tensorflow, and then we'll walk through how to utilize this library within the H2O platform. Tensorflow is an open source, deep learning framework utilized by Google and Deepmind. #h2ony
- Powered by the open source machine learning software H2O.ai. Contributors welcome at: https://github.com/h2oai
- To view videos on H2O open source machine learning software, go to: https://www.youtube.com/user/0xdata
Using AI to Solve Data and IT Complexity -- And Better Enable AIDana Gardner
A discussion on how the rising tidal wave of data must be better managed, and how new tools are emerging to bring artificial intelligence to the rescue.
Adjusting primitives for graph : SHORT REPORT / NOTESSubhajit Sahu
Graph algorithms, like PageRank Compressed Sparse Row (CSR) is an adjacency-list based graph representation that is
Multiply with different modes (map)
1. Performance of sequential execution based vs OpenMP based vector multiply.
2. Comparing various launch configs for CUDA based vector multiply.
Sum with different storage types (reduce)
1. Performance of vector element sum using float vs bfloat16 as the storage type.
Sum with different modes (reduce)
1. Performance of sequential execution based vs OpenMP based vector element sum.
2. Performance of memcpy vs in-place based CUDA based vector element sum.
3. Comparing various launch configs for CUDA based vector element sum (memcpy).
4. Comparing various launch configs for CUDA based vector element sum (in-place).
Sum with in-place strategies of CUDA mode (reduce)
1. Comparing various launch configs for CUDA based vector element sum (in-place).
Enhanced Enterprise Intelligence with your personal AI Data Copilot.pdfGetInData
Recently we have observed the rise of open-source Large Language Models (LLMs) that are community-driven or developed by the AI market leaders, such as Meta (Llama3), Databricks (DBRX) and Snowflake (Arctic). On the other hand, there is a growth in interest in specialized, carefully fine-tuned yet relatively small models that can efficiently assist programmers in day-to-day tasks. Finally, Retrieval-Augmented Generation (RAG) architectures have gained a lot of traction as the preferred approach for LLMs context and prompt augmentation for building conversational SQL data copilots, code copilots and chatbots.
In this presentation, we will show how we built upon these three concepts a robust Data Copilot that can help to democratize access to company data assets and boost performance of everyone working with data platforms.
Why do we need yet another (open-source ) Copilot?
How can we build one?
Architecture and evaluation
The Building Blocks of QuestDB, a Time Series Databasejavier ramirez
Talk Delivered at Valencia Codes Meetup 2024-06.
Traditionally, databases have treated timestamps just as another data type. However, when performing real-time analytics, timestamps should be first class citizens and we need rich time semantics to get the most out of our data. We also need to deal with ever growing datasets while keeping performant, which is as fun as it sounds.
It is no wonder time-series databases are now more popular than ever before. Join me in this session to learn about the internal architecture and building blocks of QuestDB, an open source time-series database designed for speed. We will also review a history of some of the changes we have gone over the past two years to deal with late and unordered data, non-blocking writes, read-replicas, or faster batch ingestion.
Unleashing the Power of Data_ Choosing a Trusted Analytics Platform.pdfEnterprise Wired
In this guide, we'll explore the key considerations and features to look for when choosing a Trusted analytics platform that meets your organization's needs and delivers actionable intelligence you can trust.
2. What is Google Studio ?
Google Data Studio is a reporting tool which turn your data into informative dashboards and reports that are easy
to read, easy to share, and fully customizable.
Google Data Studio will automatically update your data and give you the numbers in real time.
Google Data Studio is a open source platform, there are no retainer costs, no limitation of data storage, it is secure
and reliable.
Google Data Studio gives freedom to multiple people to work on same report in real time.
3. Jan
Feb
Mar
Apr
23
15
19
25
20
12
17
May
Jun
Jul
15
25
20
12
19
23
17
Jan Feb Mar Apr May Jun Jul
2017
Jan
Feb
Mar
Apr
23
15
19
25
20
12
17
May
Jun
Jul
Why use Google Studio ?
90% of the information a person perceive is through sight
70% of the sensory receptors are located in the eyes
About 50% of the human brain neurons are involved in the processing of visual information
Human productivity is 17% higher when working with visual information
A person understand visual information 60,000 times faster comparison to the same
information as text
4. What can we do with Google Studio?
Google Data Studio can connect and collect the data from different sources and give you one consolidated report
and Dashboard on single platform.
9. Y Features Google Studio ?
Connecting Data from different sources
Creating own Dimension, Calculation of Metrix
Using Filter controls and date ranges
Publishing and Embeding the report
How to use score cards, Maps andTables
How to use Charts, Bullet Chat and Combo Chart
Setting the layout , Pages and style of the report
Creating Segments and Filters
Grouping selected data and date ranges