Downloaded 251 times
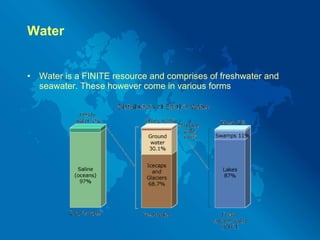
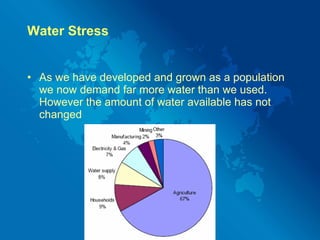

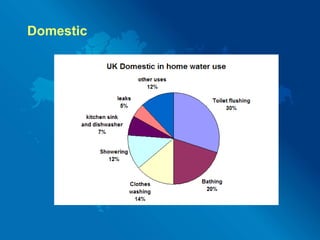
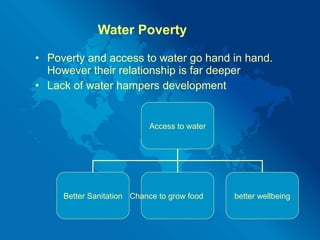
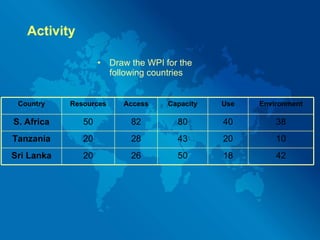

Water is a finite resource that exists in both freshwater and seawater forms. As the global population has grown, the demand for water has far exceeded the available supply. Agriculture accounts for 67% of global water usage, mostly for irrigation. Industry uses 21% globally, a percentage expected to rise with developing countries' economic growth. Domestic water usage makes up 10% but varies greatly between countries. Surface water and aquifers are the main sources, but overuse is causing issues like declining water tables and seawater contamination in some areas. Water poverty is linked to overall poverty, as lack of access to clean water hampers development and quality of life.


![5G Explained! A High Level Overview [Introduction]](https://cdn.slidesharecdn.com/ss_thumbnails/5gexplainedahighleveloverview-260119165306-cc137a3e-thumbnail.jpg?width=640&height=640&fit=bounds)


