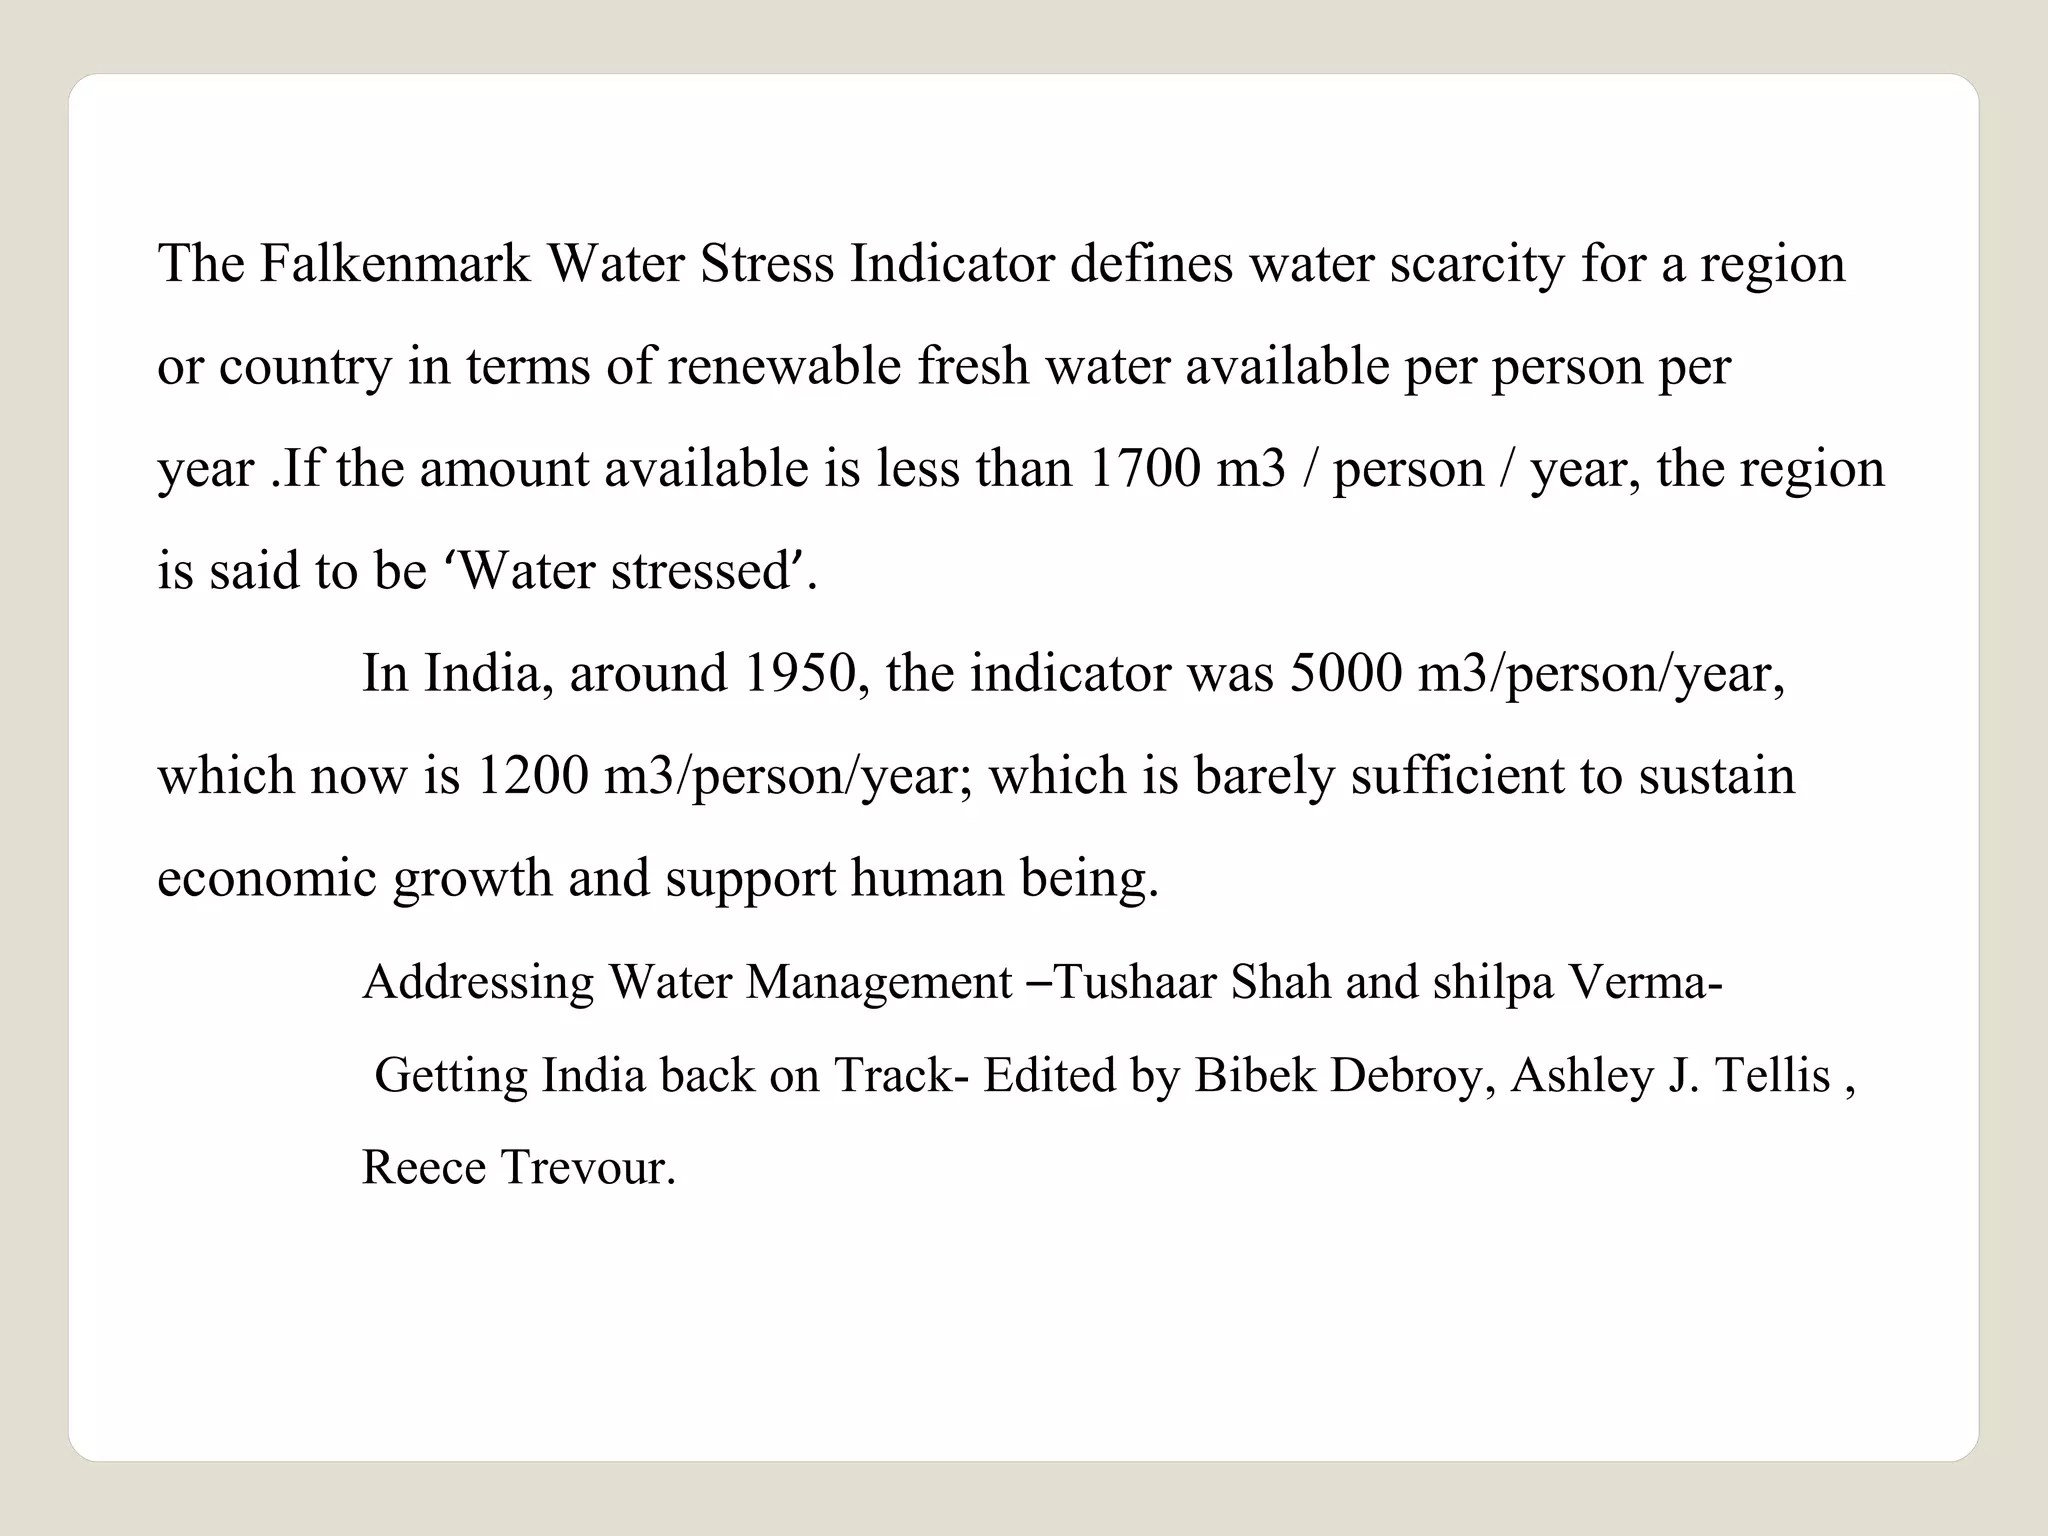
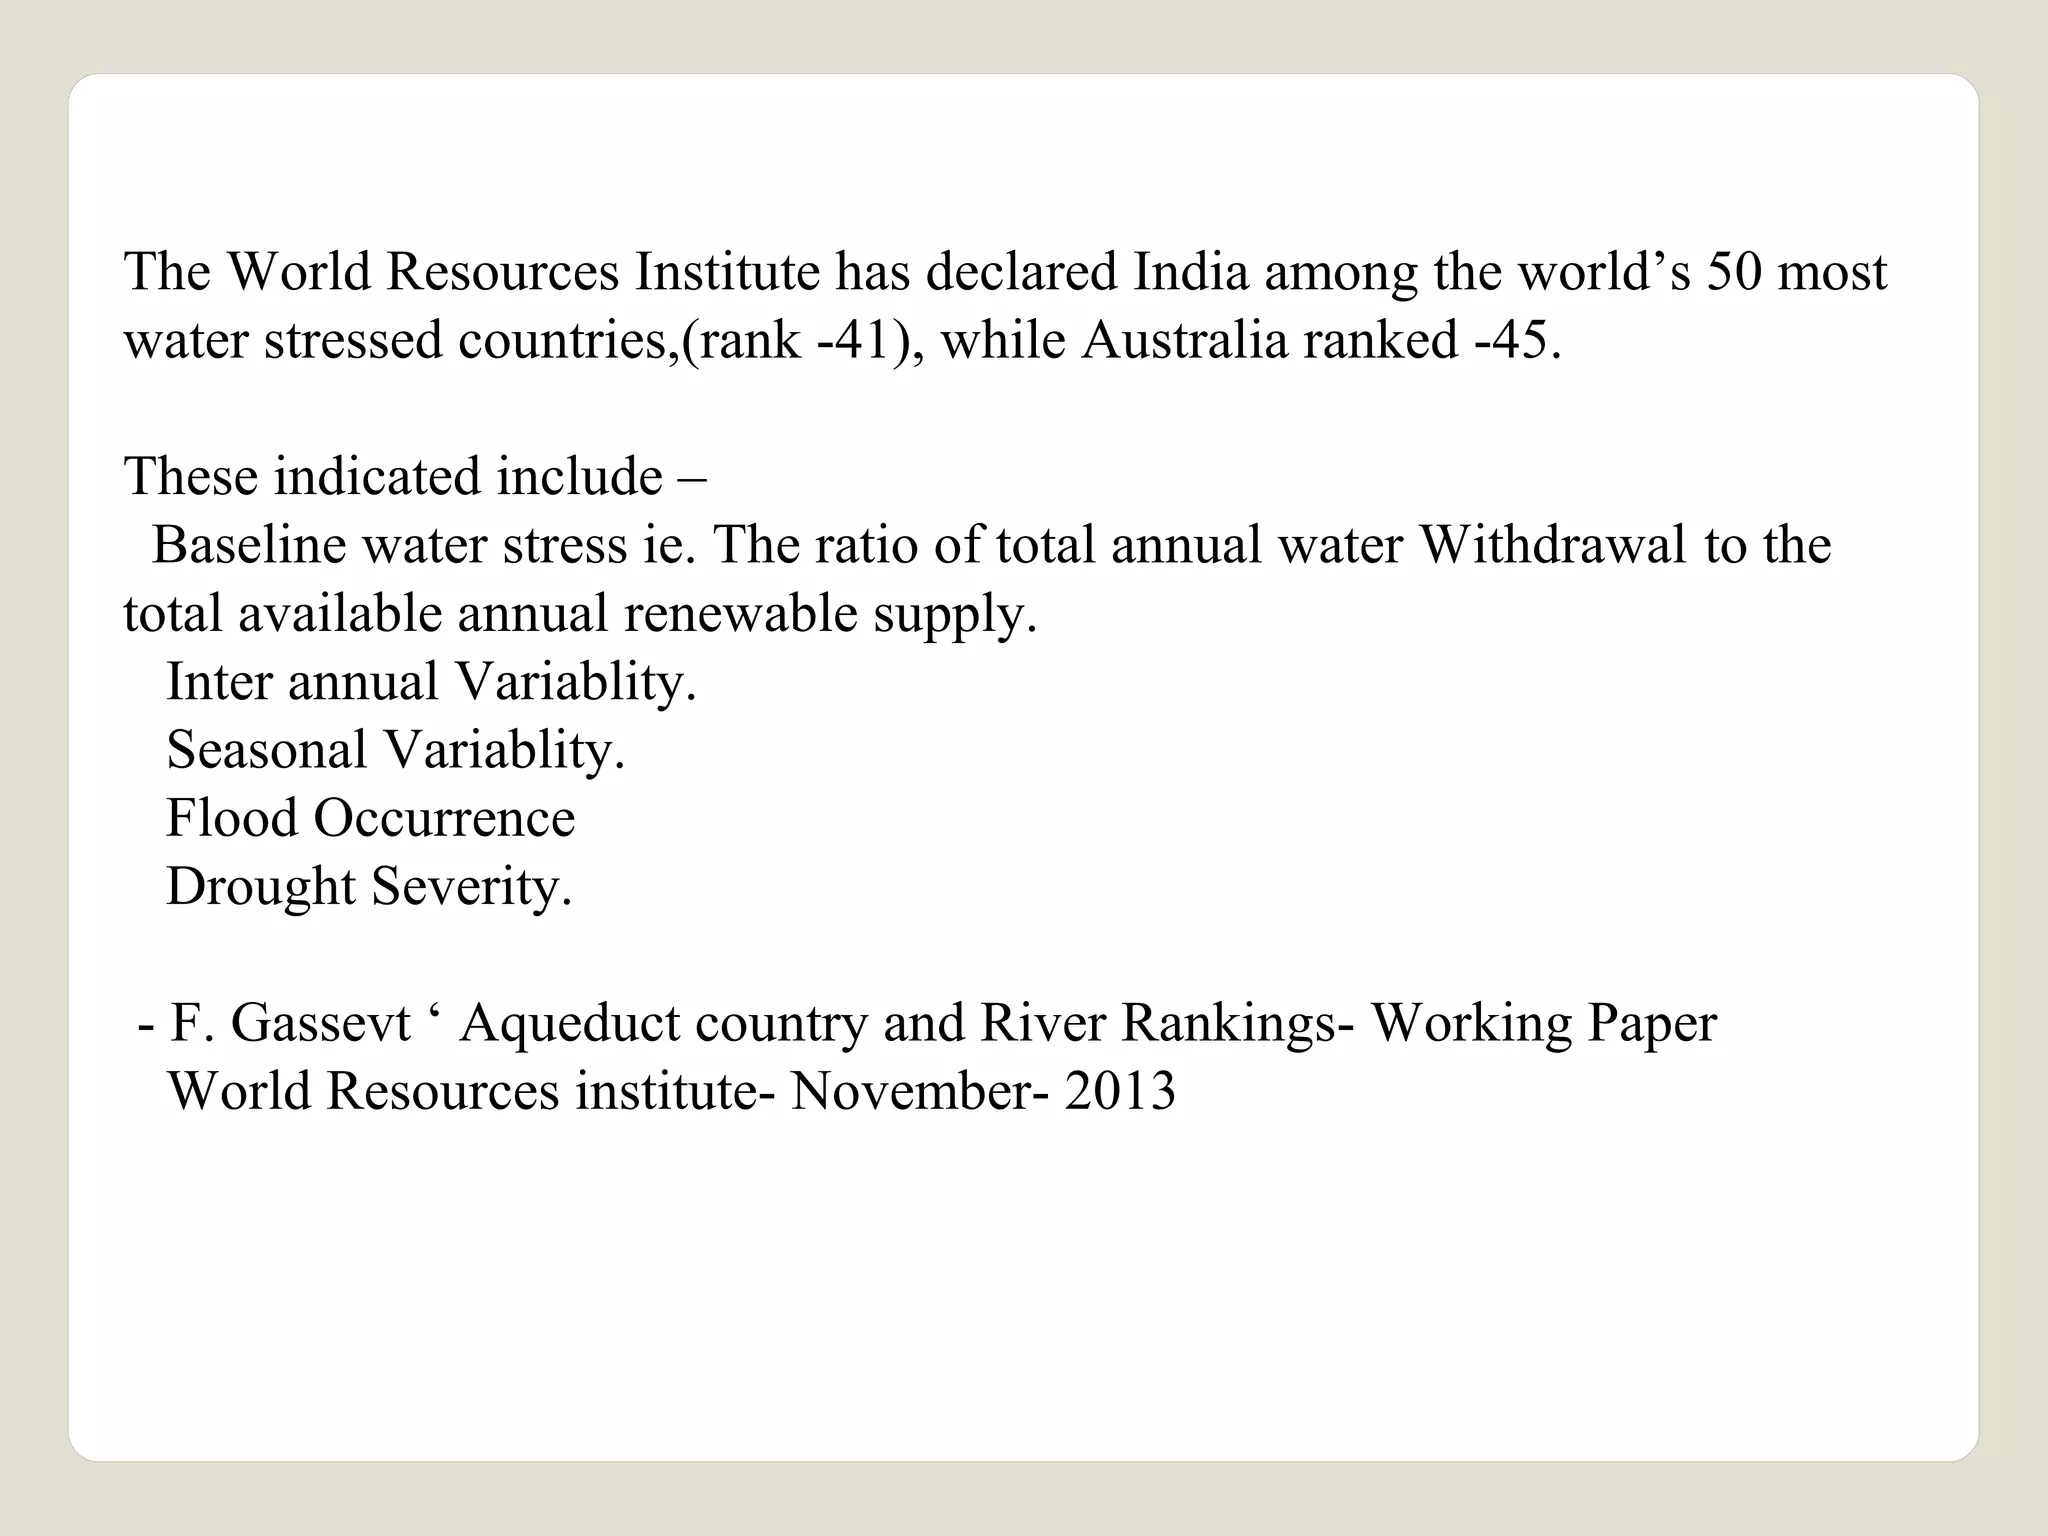
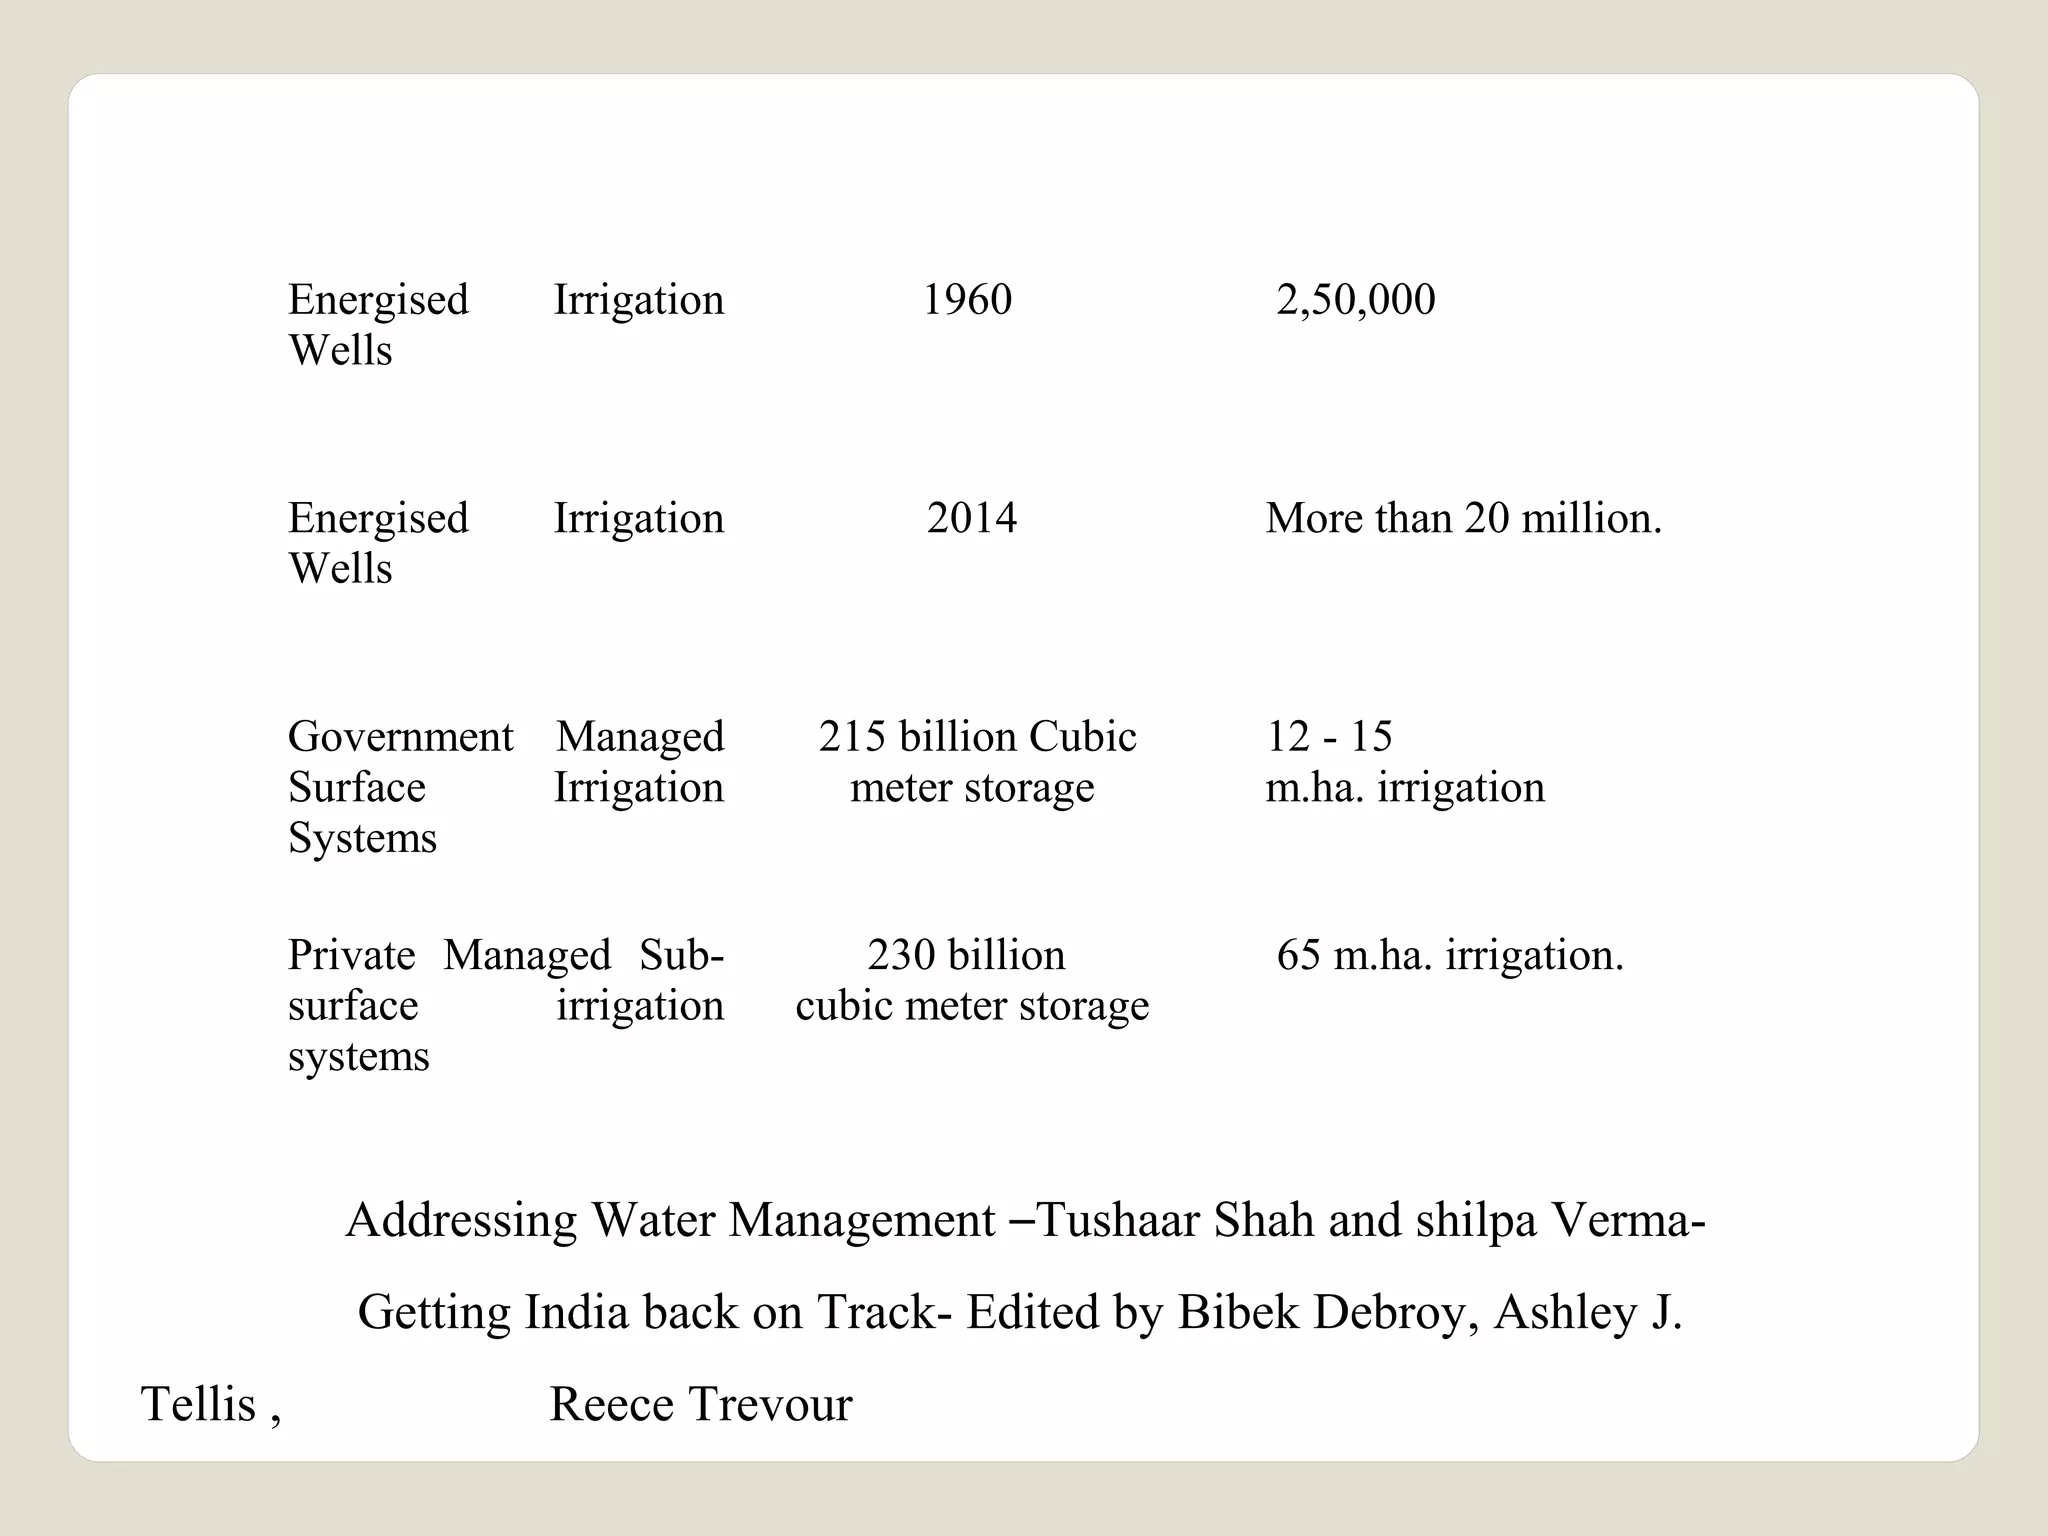
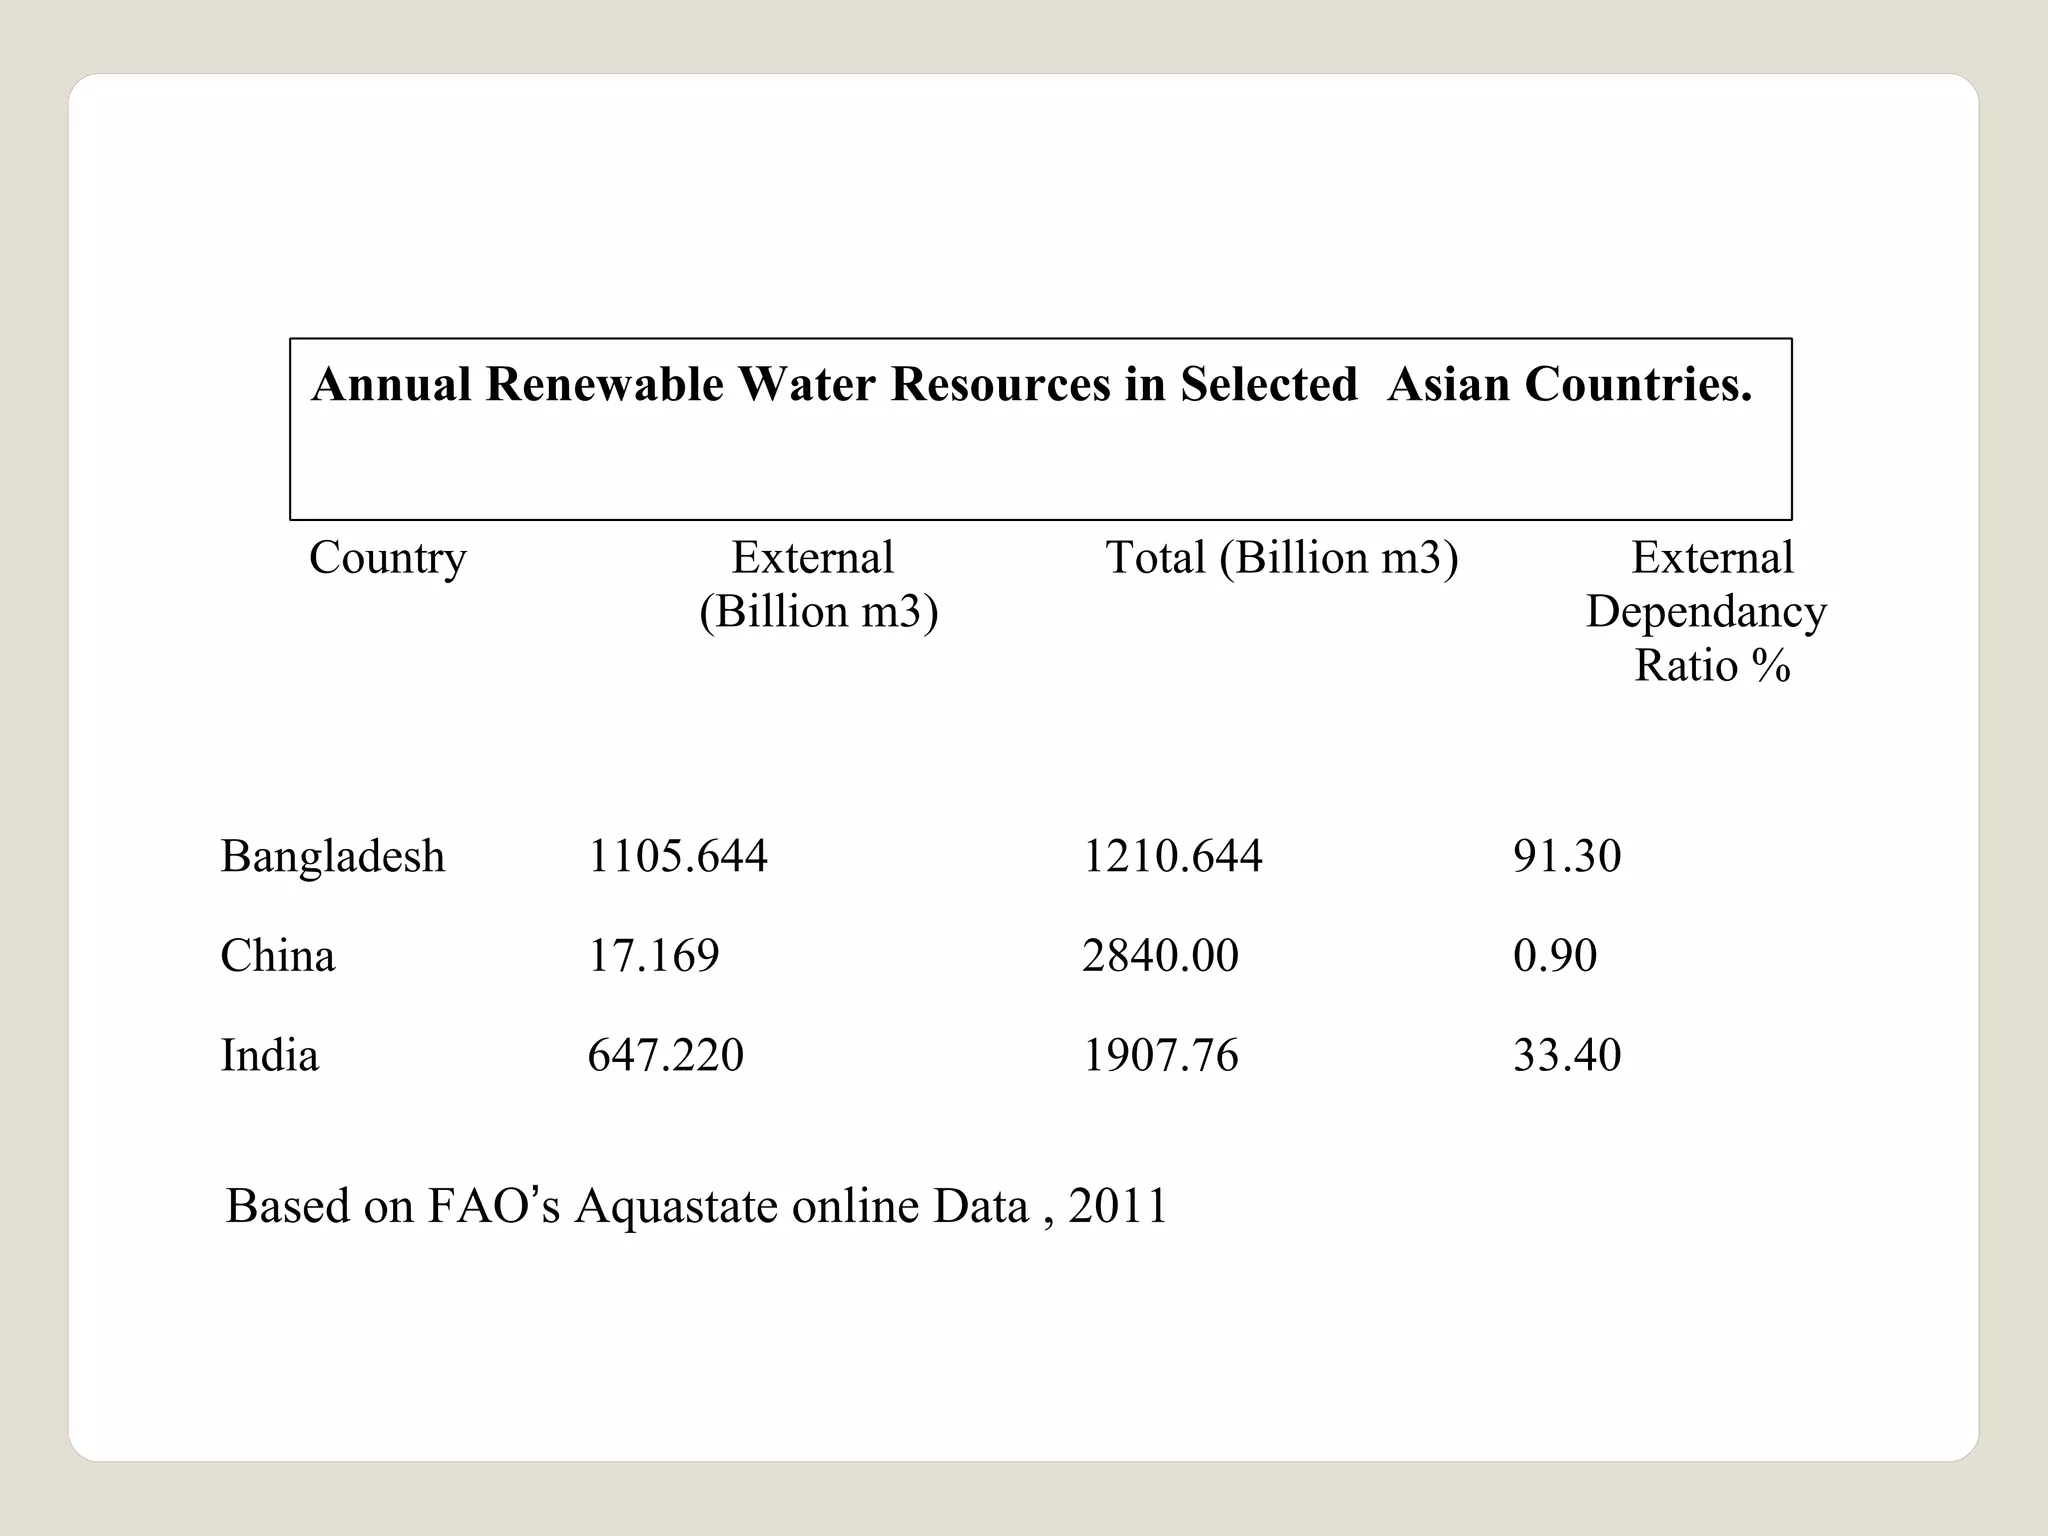
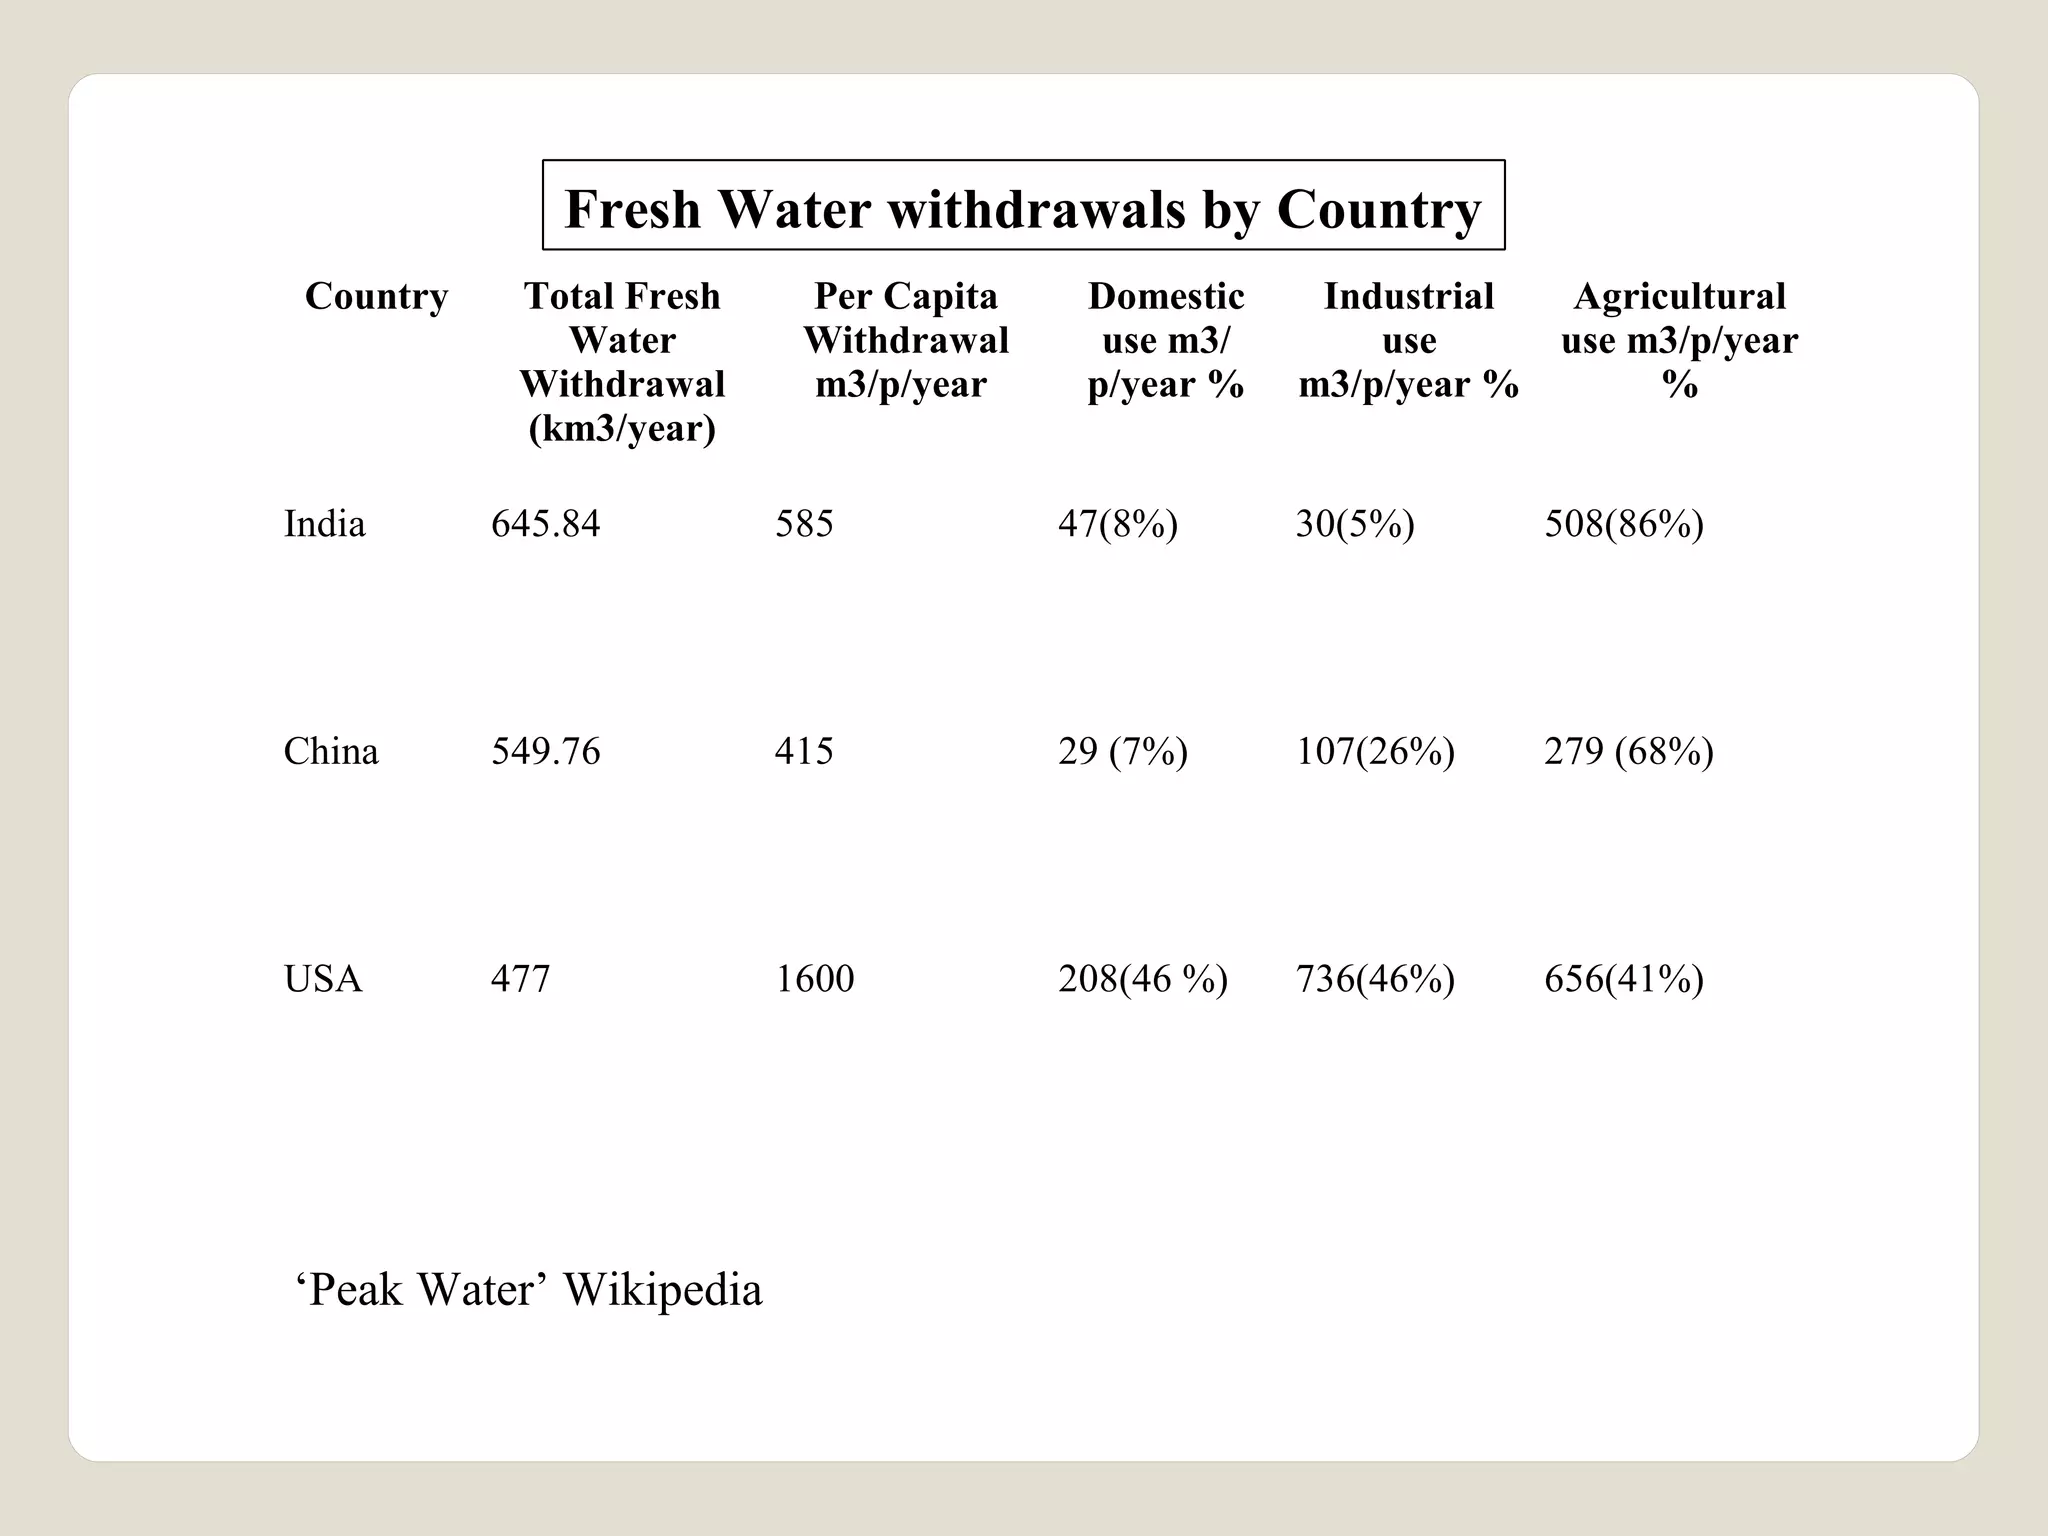
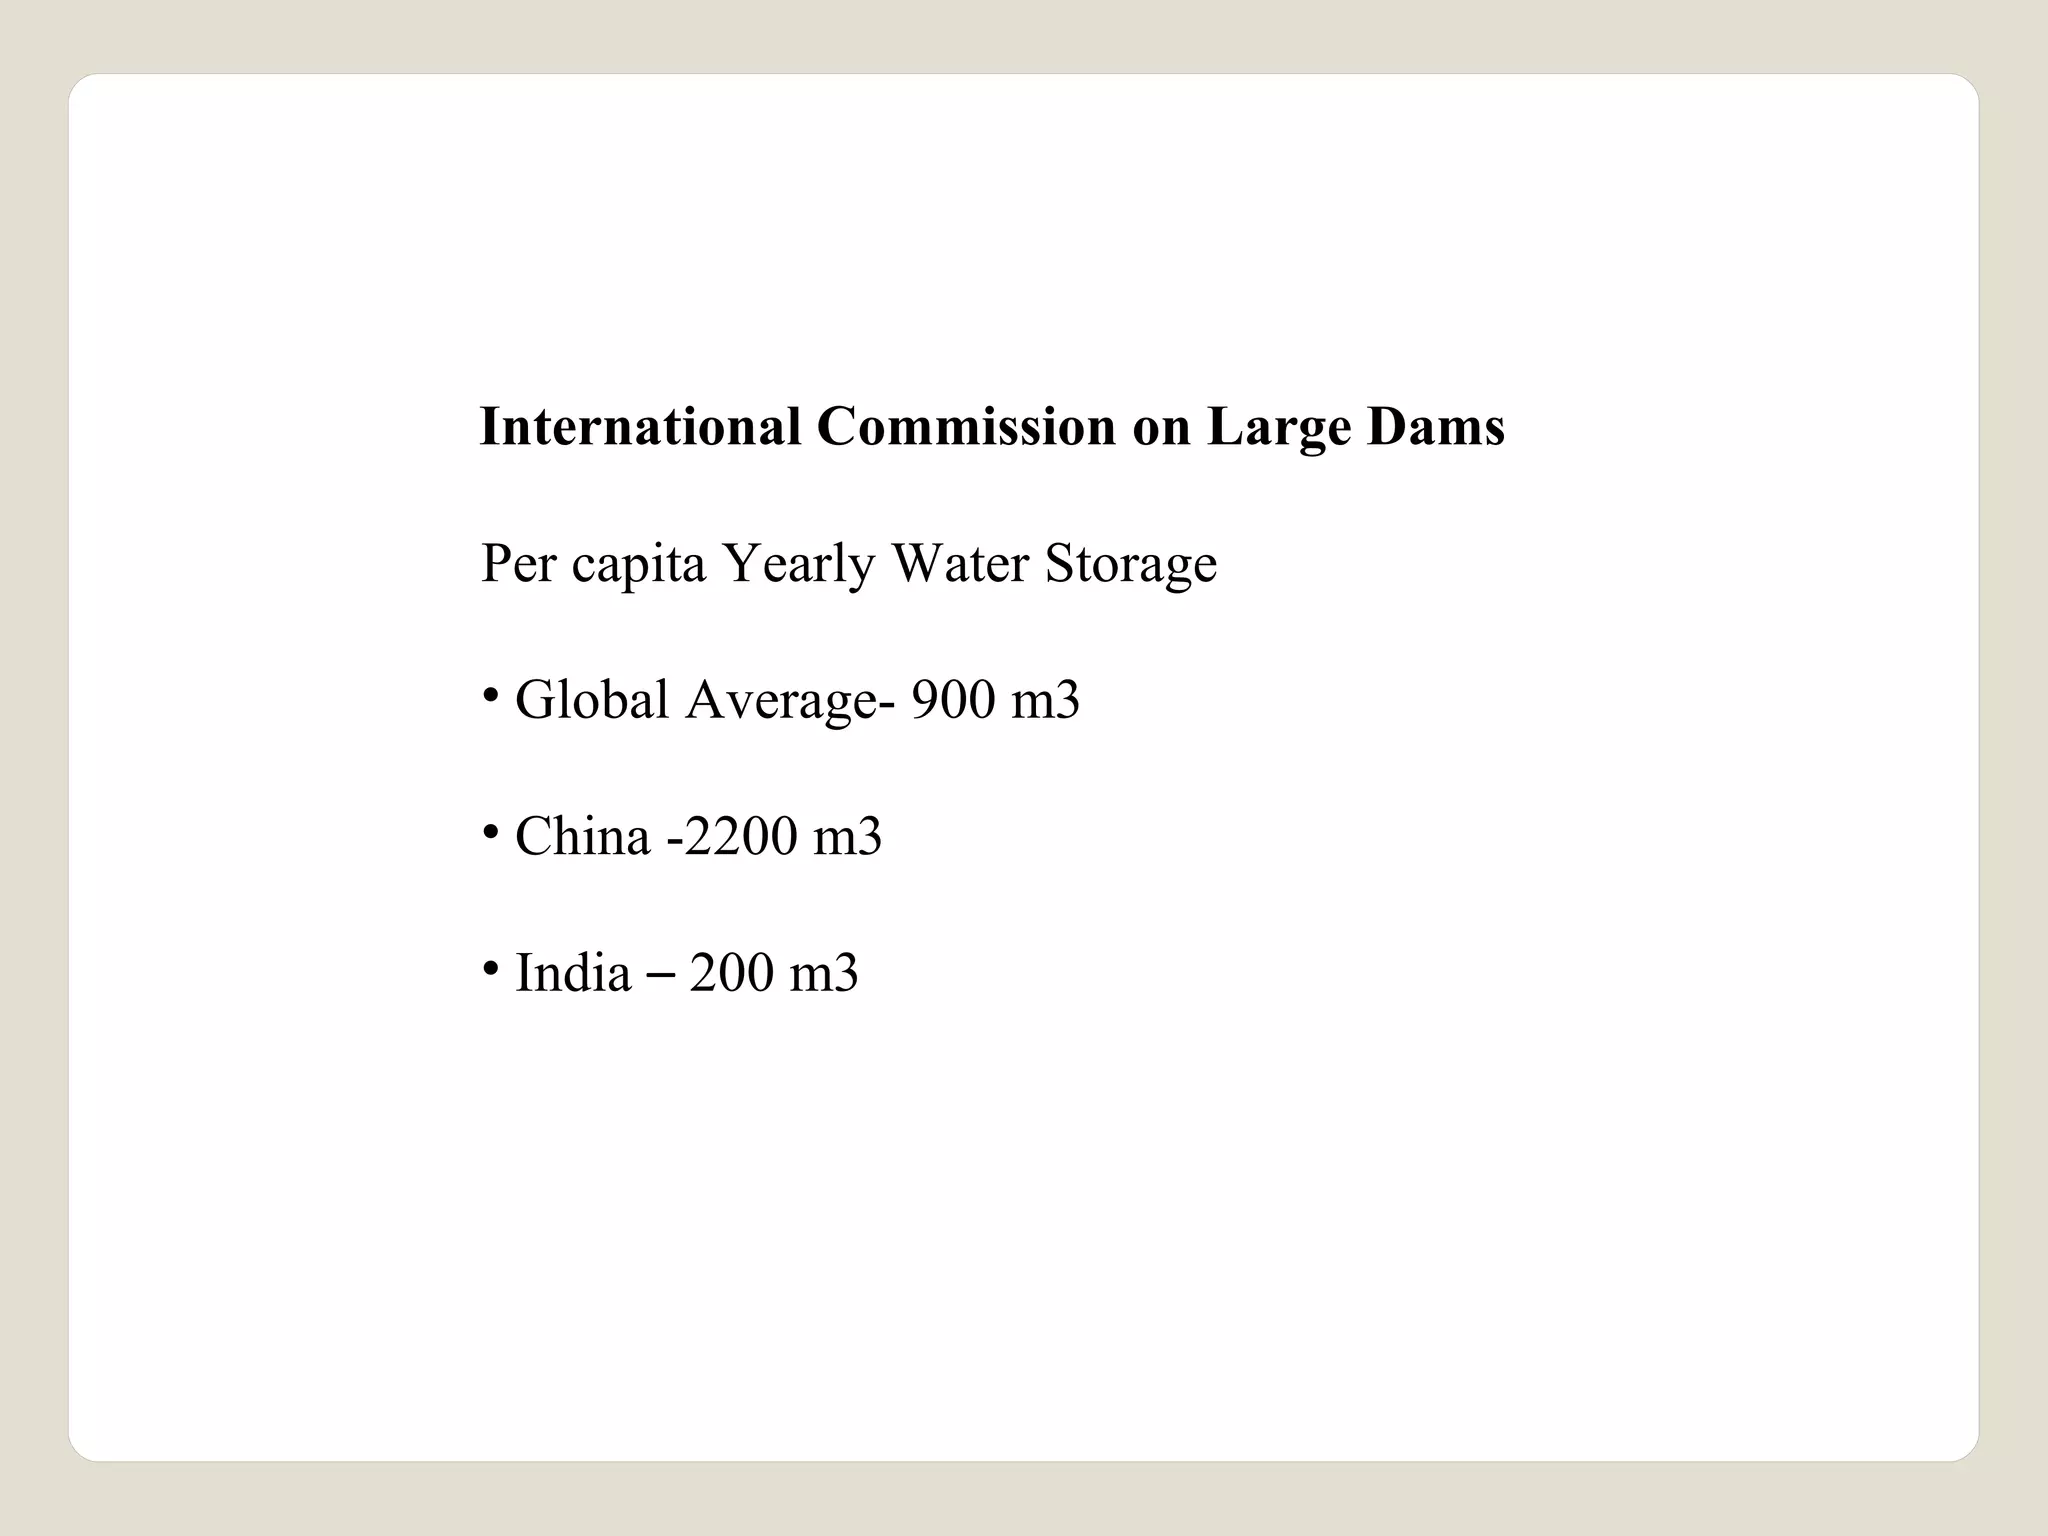
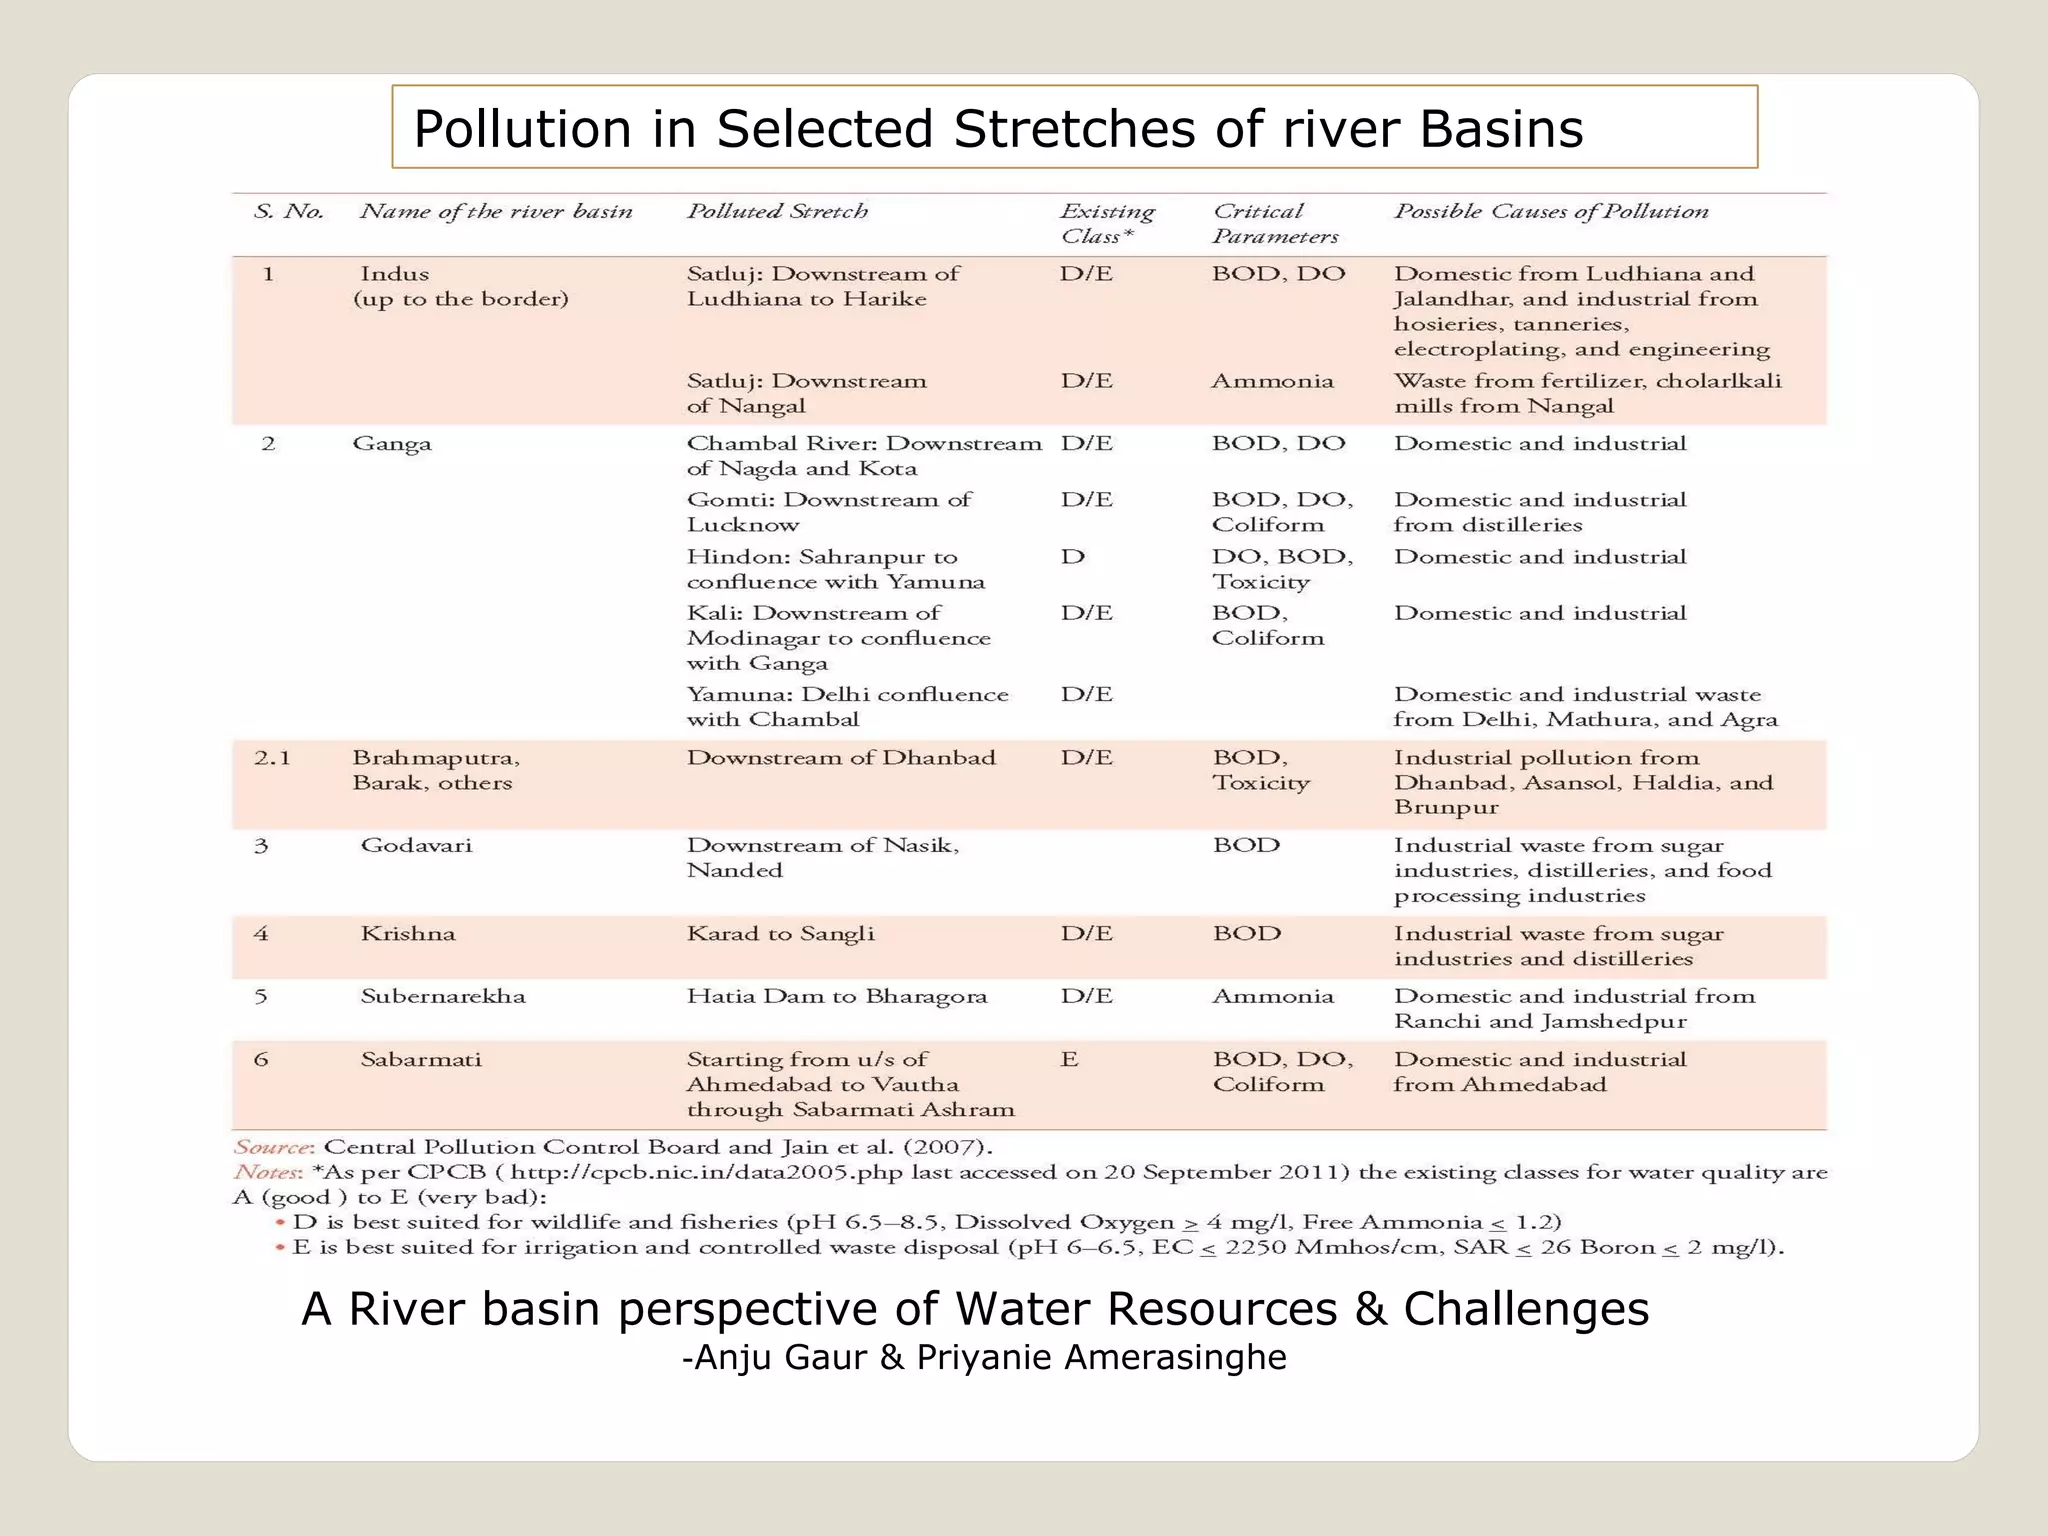
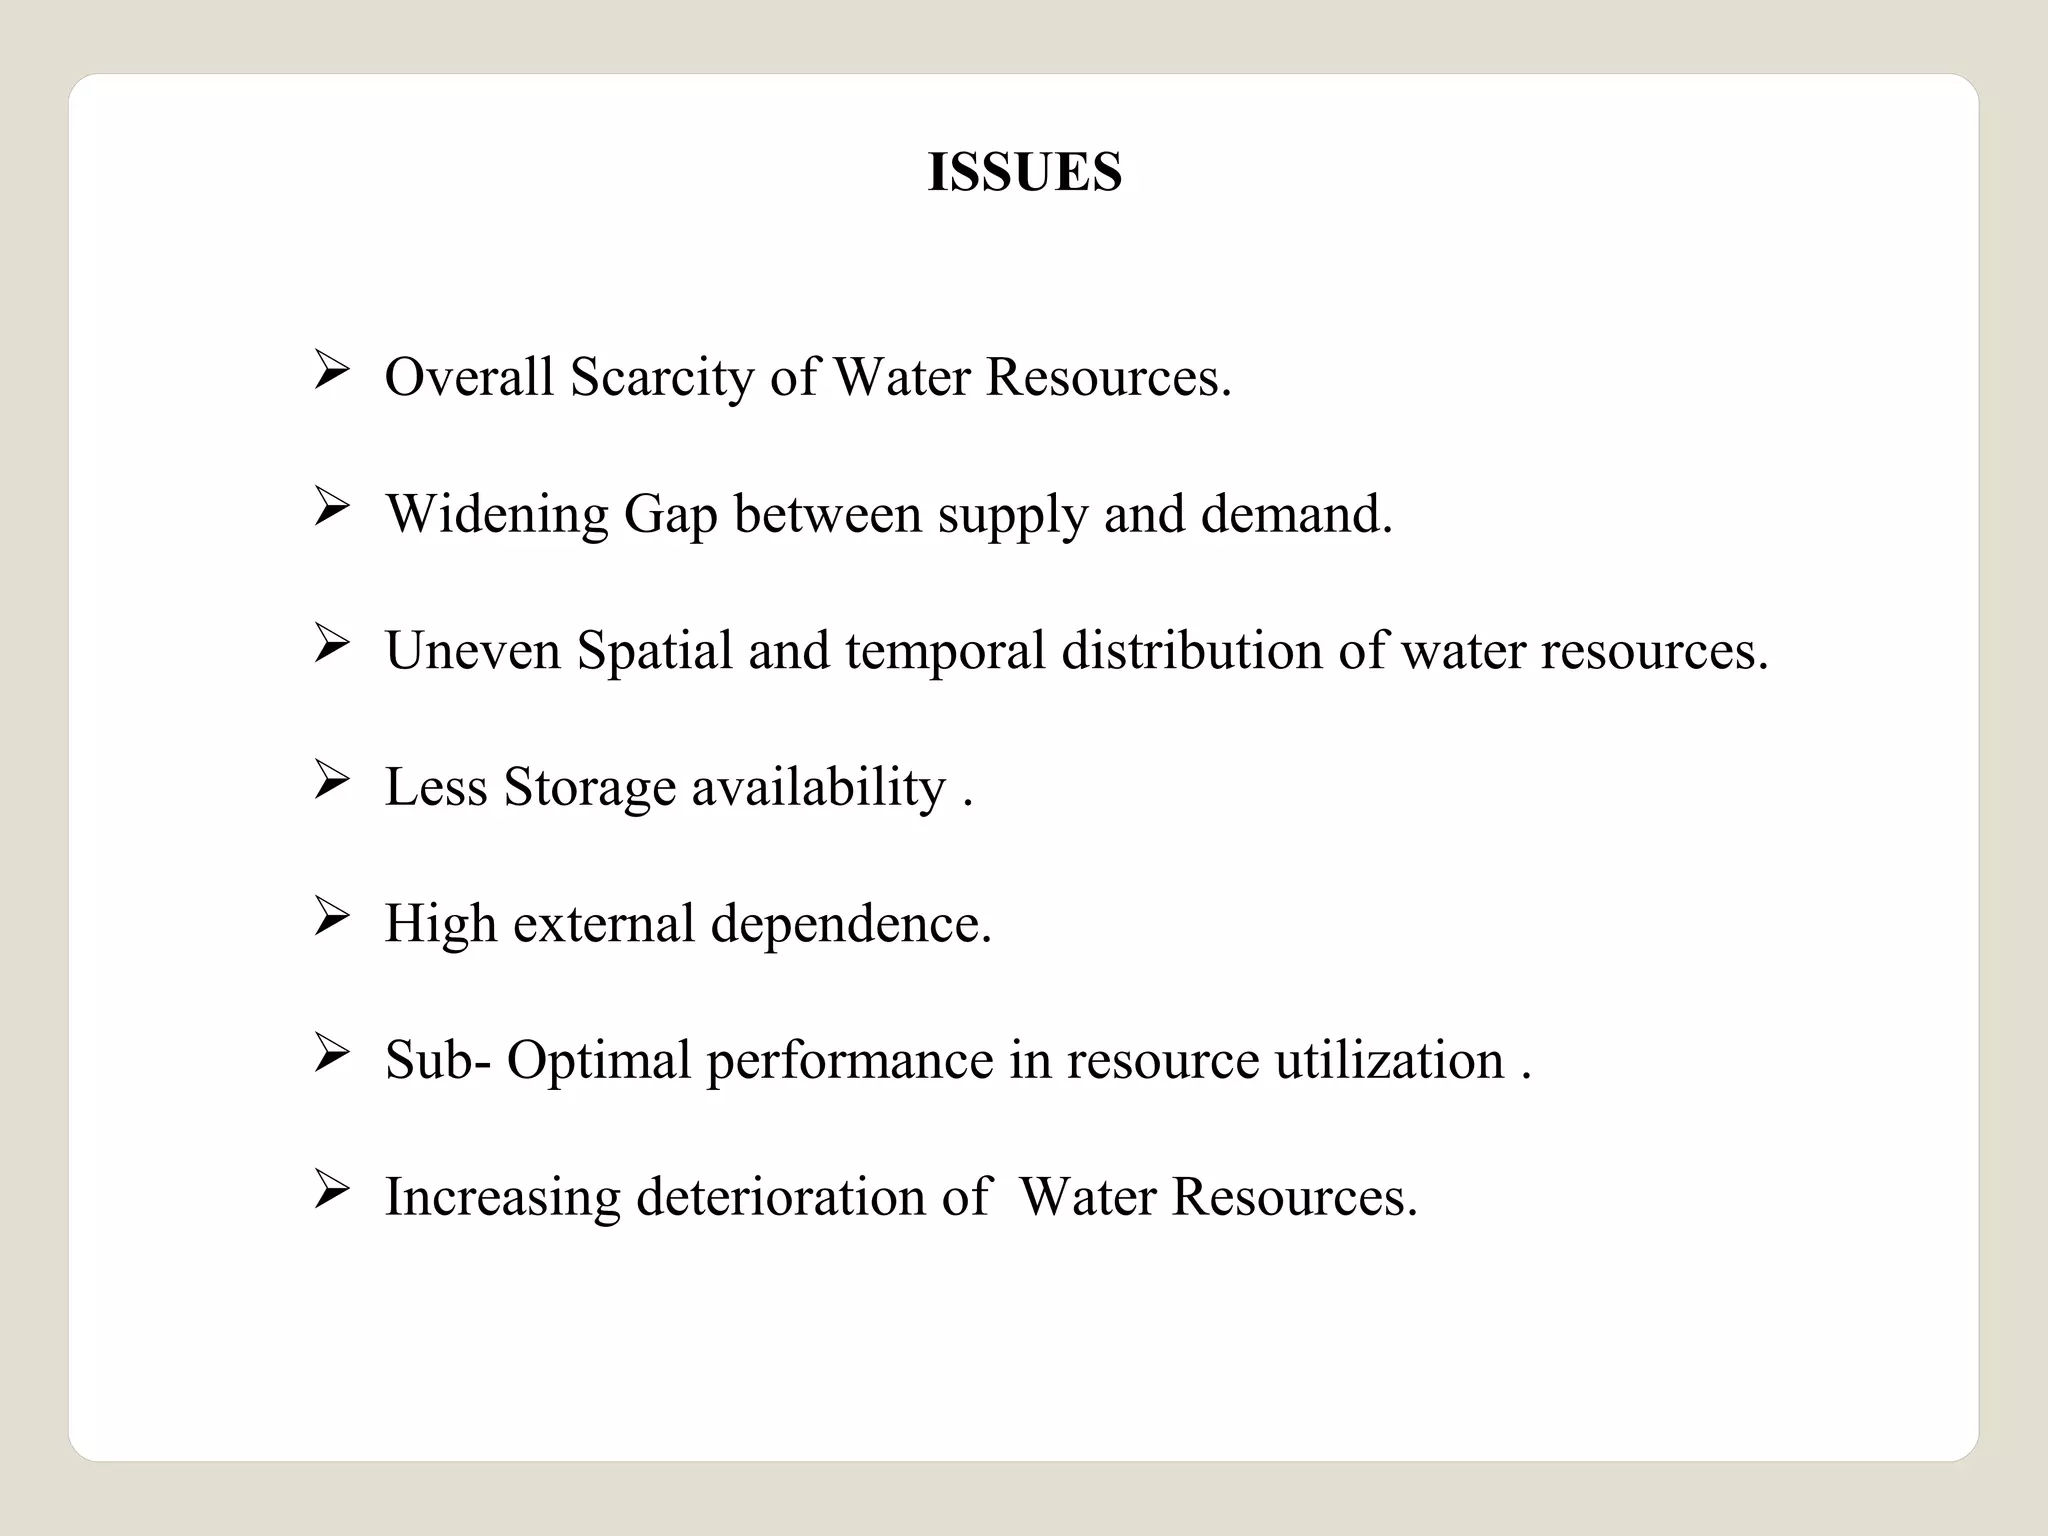
WATER AVAILABILITY AND USE 
IN INDIA -- AN OVERVIEW 
By O.T.Gulati 
Chairman,Water Management Forum 
The Institution of Engineers (India)
Surface and Ground water Resources in River Basins in India 
A River basin perspective of Water Resources & Challenges 
-Anju Gaur & Priyanie Amerasinghe
Available Water Resources in India and Demand Projections by 2025 and 
2050 
A River basin perspective of Water Resources & Challenges 
-Anju Gaur & Priyanie Amerasinghe
The Falkenmark Water Stress Indicator defines water scarcity for a region 
or country in terms of renewable fresh water available per person per 
year .If the amount available is less than 1700 m3 / person / year, the region 
is said to be ‘Water stressed’. 
In India, around 1950, the indicator was 5000 m3/person/year, 
which now is 1200 m3/person/year; which is barely sufficient to sustain 
economic growth and support human being. 
Addressing Water Management –Tushaar Shah and shilpa Verma- 
Getting India back on Track- Edited by Bibek Debroy, Ashley J. Tellis , 
Reece Trevour.
The World Resources Institute has declared India among the world’s 50 most 
water stressed countries,(rank -41), while Australia ranked -45. 
These indicated include – 
Baseline water stress ie. The ratio of total annual water Withdrawal to the 
total available annual renewable supply. 
Inter annual Variablity. 
Seasonal Variablity. 
Flood Occurrence 
Drought Severity. 
- F. Gassevt ‘ Aqueduct country and River Rankings- Working Paper 
World Resources institute- November- 2013
Energised Irrigation 
Wells 
1960 2,50,000 
Energised Irrigation 
Wells 
2014 More than 20 million. 
Government Managed 
Surface Irrigation 
Systems 
215 billion Cubic 
meter storage 
12 - 15 
m.ha. irrigation 
Private Managed Sub-surface 
irrigation 
systems 
230 billion 
cubic meter storage 
65 m.ha. irrigation. 
Addressing Water Management –Tushaar Shah and shilpa Verma- 
Getting India back on Track- Edited by Bibek Debroy, Ashley J. 
Tellis , Reece Trevour
Annual Renewable Water Resources in Selected Asian Countries. 
Country External 
(Billion m3) 
Total (Billion m3) External 
Dependancy 
Ratio % 
Bangladesh 1105.644 1210.644 91.30 
China 17.169 2840.00 0.90 
India 647.220 1907.76 33.40 
Based on FAO’s Aquastate online Data , 2011
Fresh Water withdrawals by Country 
Country Total Fresh 
Water 
Withdrawal 
(km3/year) 
Per Capita 
Withdrawal 
m3/p/year 
Domestic 
use m3/ 
p/year % 
Industrial 
use 
m3/p/year % 
Agricultural 
use m3/p/year 
% 
India 645.84 585 47(8%) 30(5%) 508(86%) 
China 549.76 415 29 (7%) 107(26%) 279 (68%) 
USA 477 1600 208(46 %) 736(46%) 656(41%) 
‘Peak Water’ Wikipedia
International Commission on Large Dams 
Per capita Yearly Water Storage 
• Global Average- 900 m3 
• China -2200 m3 
• India – 200 m3
Total Area Harvested and total Yields for Cereals (1961-2010) in 
China, India, and Indonesia 
Water & Food Security -: 
- Experiences in India & China 
-Global Water Partnerships
Total food supply (kcal/capita/day) 2009 
Water & Food Security -: 
- Experiences in India & China 
-Global Water Partnerships
Growth of Agricultural outputs and Inputs
Growth of Surface and Groundwater irrigation in India (1951-2007) 
Water & Food Security -: 
- Experiences in India & China 
-Global Water Partnerships
Access to improved water and sanitation resources:- China & India 
Water & Food Security -: 
- Experiences in India & China 
-Global Water Partnerships
Irrigation investment and irrigated area in India 
Water & Food Security -: 
- Experiences in India & China 
-Global Water Partnerships
Comparison of energy use in Brazil, China, India and Indonesia (1971-2009) 
Water & Food Security -: 
- Experiences in India & China 
-Global Water Partnerships
Pollution in Selected Stretches of river Basins 
A River basin perspective of Water Resources & Challenges 
-Anju Gaur & Priyanie Amerasinghe
ISSUES 
 Overall Scarcity of Water Resources. 
 Widening Gap between supply and demand. 
 Uneven Spatial and temporal distribution of water resources. 
 Less Storage availability . 
 High external dependence. 
 Sub- Optimal performance in resource utilization . 
 Increasing deterioration of Water Resources.
Thank you

Water availability & use in india -an overview

  • 1.
    WATER AVAILABILITY ANDUSE IN INDIA -- AN OVERVIEW By O.T.Gulati Chairman,Water Management Forum The Institution of Engineers (India)
  • 2.
    Surface and Groundwater Resources in River Basins in India A River basin perspective of Water Resources & Challenges -Anju Gaur & Priyanie Amerasinghe
  • 3.
    Available Water Resourcesin India and Demand Projections by 2025 and 2050 A River basin perspective of Water Resources & Challenges -Anju Gaur & Priyanie Amerasinghe
  • 4.
    The Falkenmark WaterStress Indicator defines water scarcity for a region or country in terms of renewable fresh water available per person per year .If the amount available is less than 1700 m3 / person / year, the region is said to be ‘Water stressed’. In India, around 1950, the indicator was 5000 m3/person/year, which now is 1200 m3/person/year; which is barely sufficient to sustain economic growth and support human being. Addressing Water Management –Tushaar Shah and shilpa Verma- Getting India back on Track- Edited by Bibek Debroy, Ashley J. Tellis , Reece Trevour.
  • 5.
    The World ResourcesInstitute has declared India among the world’s 50 most water stressed countries,(rank -41), while Australia ranked -45. These indicated include – Baseline water stress ie. The ratio of total annual water Withdrawal to the total available annual renewable supply. Inter annual Variablity. Seasonal Variablity. Flood Occurrence Drought Severity. - F. Gassevt ‘ Aqueduct country and River Rankings- Working Paper World Resources institute- November- 2013
  • 6.
    Energised Irrigation Wells 1960 2,50,000 Energised Irrigation Wells 2014 More than 20 million. Government Managed Surface Irrigation Systems 215 billion Cubic meter storage 12 - 15 m.ha. irrigation Private Managed Sub-surface irrigation systems 230 billion cubic meter storage 65 m.ha. irrigation. Addressing Water Management –Tushaar Shah and shilpa Verma- Getting India back on Track- Edited by Bibek Debroy, Ashley J. Tellis , Reece Trevour
  • 7.
    Annual Renewable WaterResources in Selected Asian Countries. Country External (Billion m3) Total (Billion m3) External Dependancy Ratio % Bangladesh 1105.644 1210.644 91.30 China 17.169 2840.00 0.90 India 647.220 1907.76 33.40 Based on FAO’s Aquastate online Data , 2011
  • 8.
    Fresh Water withdrawalsby Country Country Total Fresh Water Withdrawal (km3/year) Per Capita Withdrawal m3/p/year Domestic use m3/ p/year % Industrial use m3/p/year % Agricultural use m3/p/year % India 645.84 585 47(8%) 30(5%) 508(86%) China 549.76 415 29 (7%) 107(26%) 279 (68%) USA 477 1600 208(46 %) 736(46%) 656(41%) ‘Peak Water’ Wikipedia
  • 9.
    International Commission onLarge Dams Per capita Yearly Water Storage • Global Average- 900 m3 • China -2200 m3 • India – 200 m3
  • 10.
    Total Area Harvestedand total Yields for Cereals (1961-2010) in China, India, and Indonesia Water & Food Security -: - Experiences in India & China -Global Water Partnerships
  • 11.
    Total food supply(kcal/capita/day) 2009 Water & Food Security -: - Experiences in India & China -Global Water Partnerships
  • 12.
    Growth of Agriculturaloutputs and Inputs
  • 13.
    Growth of Surfaceand Groundwater irrigation in India (1951-2007) Water & Food Security -: - Experiences in India & China -Global Water Partnerships
  • 14.
    Access to improvedwater and sanitation resources:- China & India Water & Food Security -: - Experiences in India & China -Global Water Partnerships
  • 15.
    Irrigation investment andirrigated area in India Water & Food Security -: - Experiences in India & China -Global Water Partnerships
  • 16.
    Comparison of energyuse in Brazil, China, India and Indonesia (1971-2009) Water & Food Security -: - Experiences in India & China -Global Water Partnerships
  • 17.
    Pollution in SelectedStretches of river Basins A River basin perspective of Water Resources & Challenges -Anju Gaur & Priyanie Amerasinghe
  • 18.
    ISSUES  OverallScarcity of Water Resources.  Widening Gap between supply and demand.  Uneven Spatial and temporal distribution of water resources.  Less Storage availability .  High external dependence.  Sub- Optimal performance in resource utilization .  Increasing deterioration of Water Resources.
  • 19.