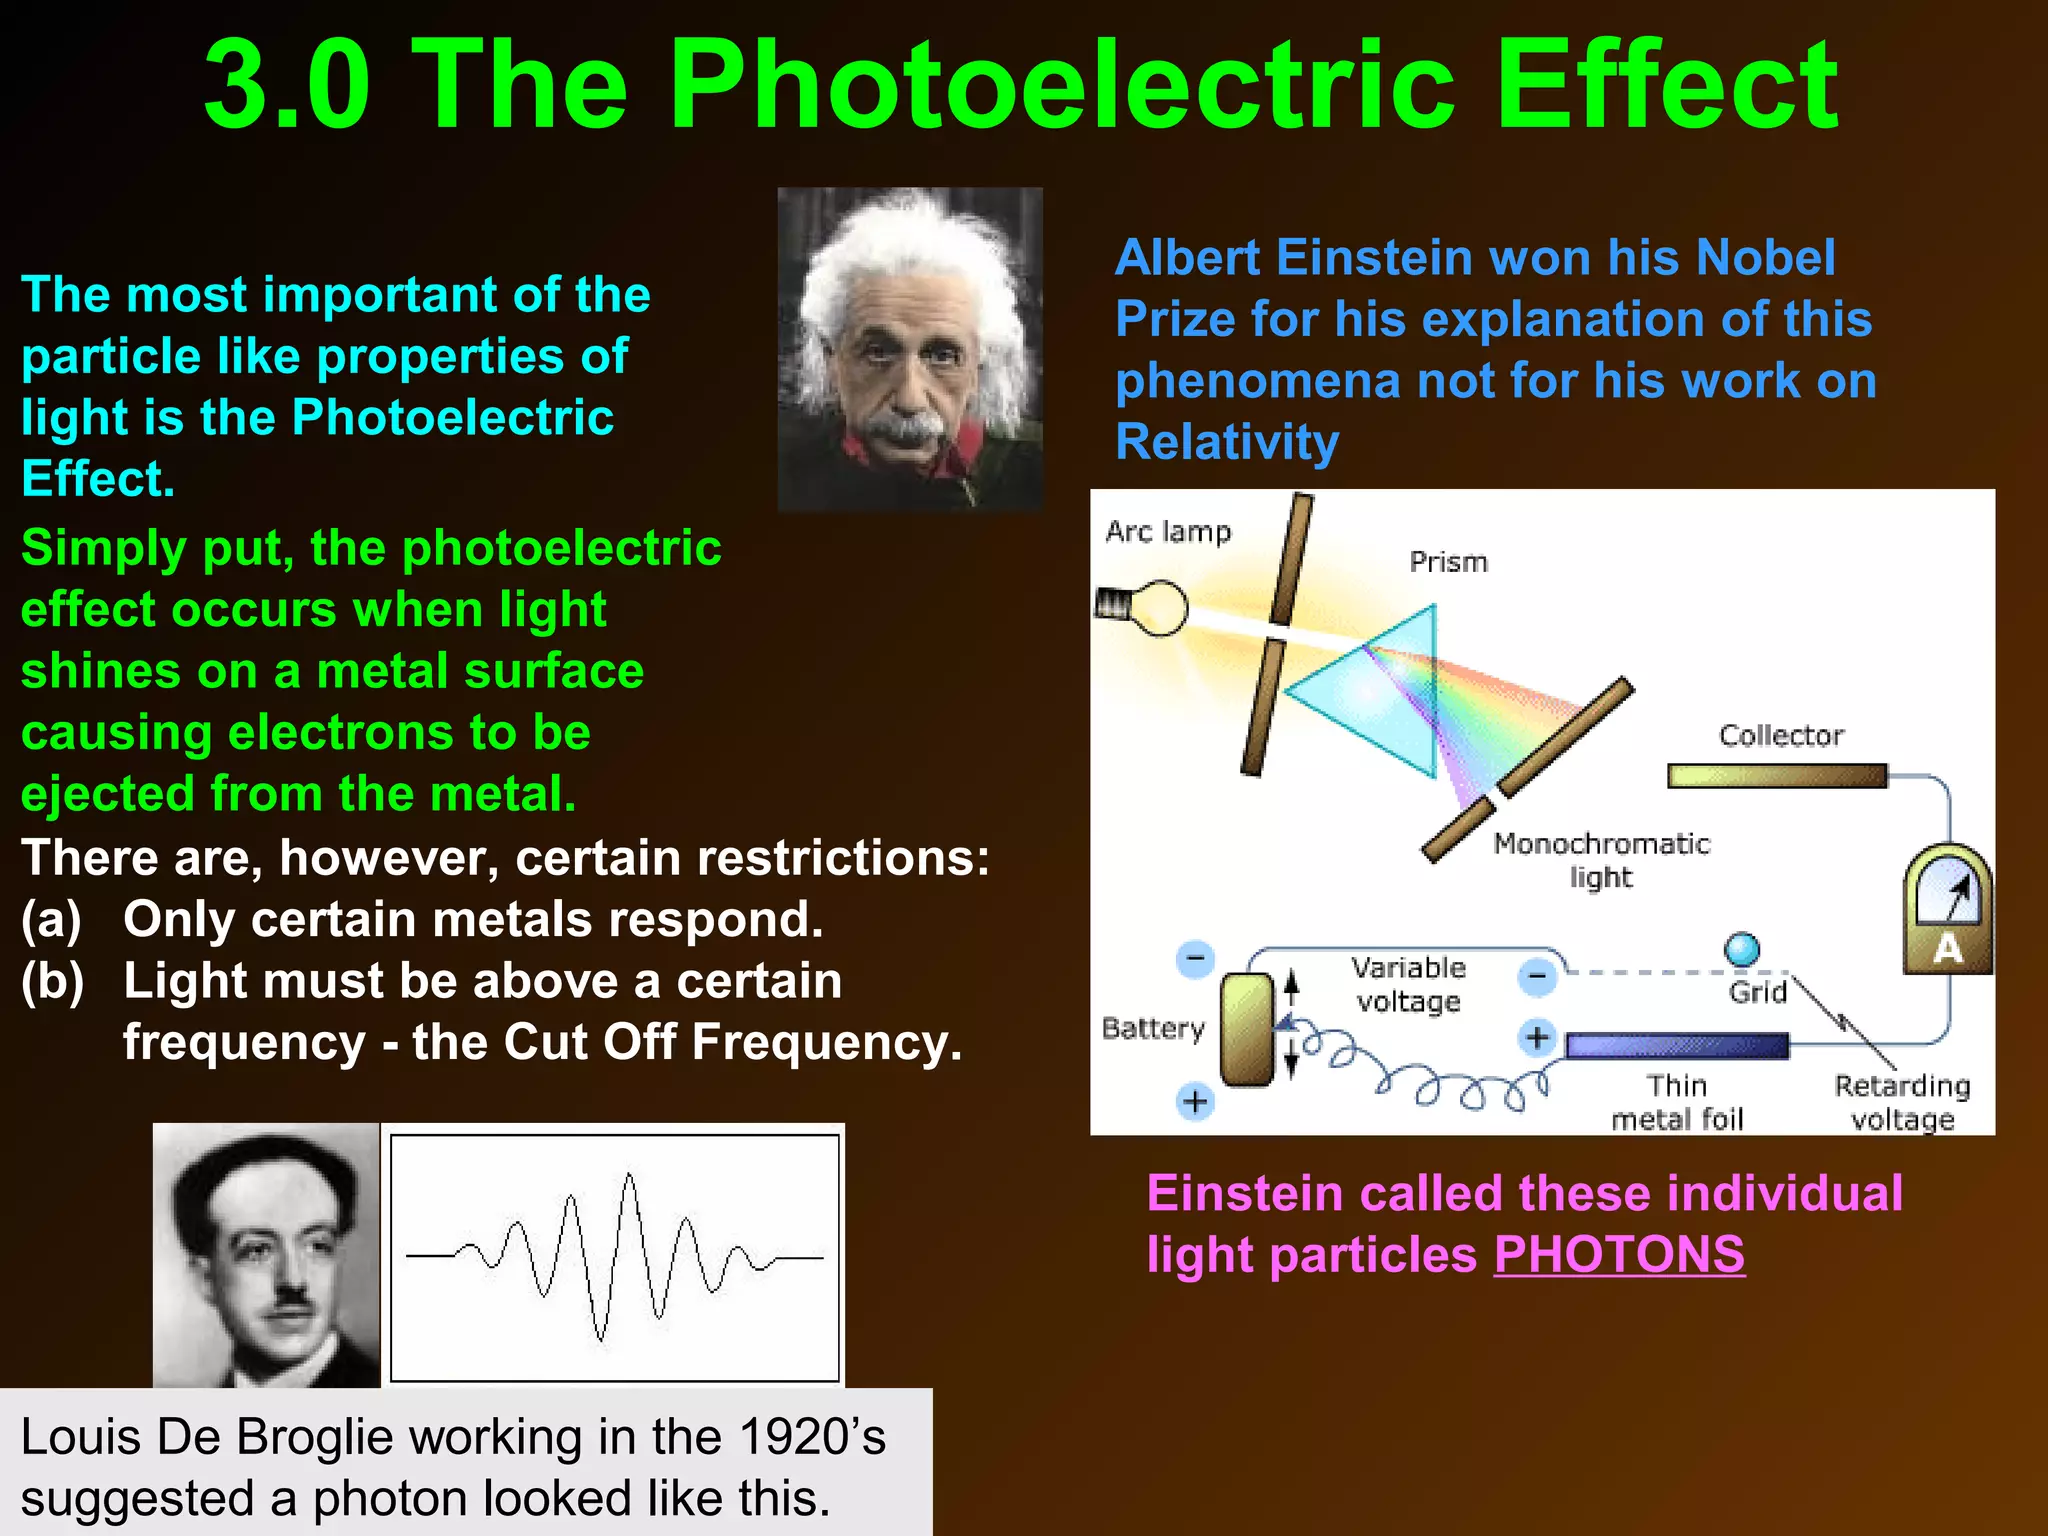
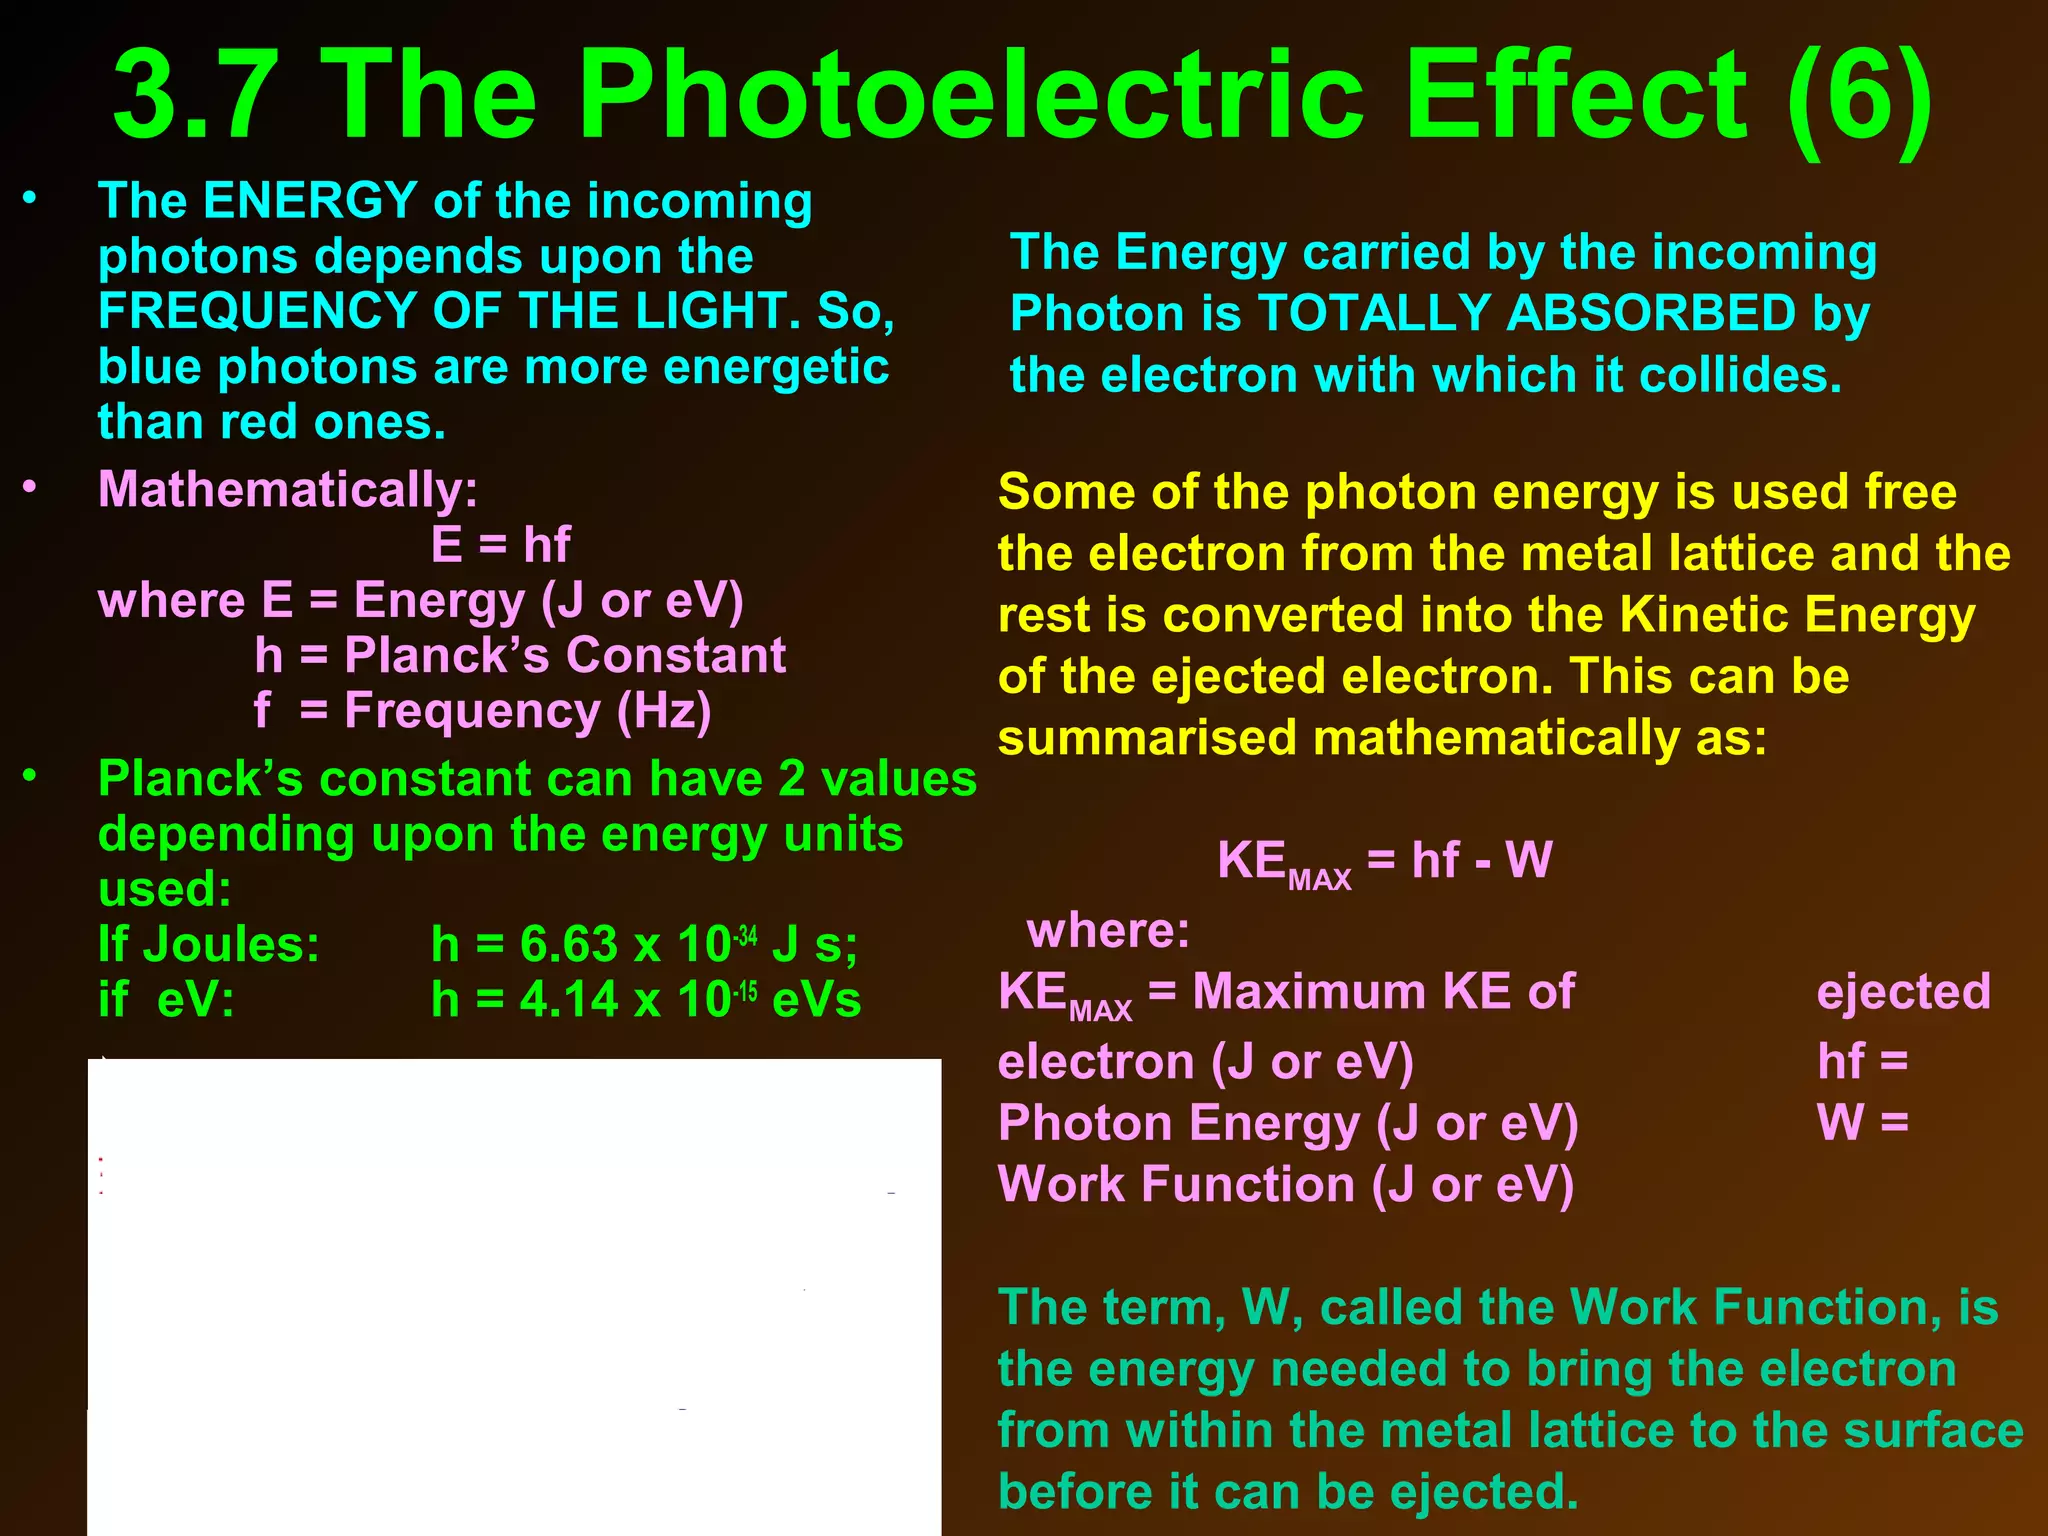
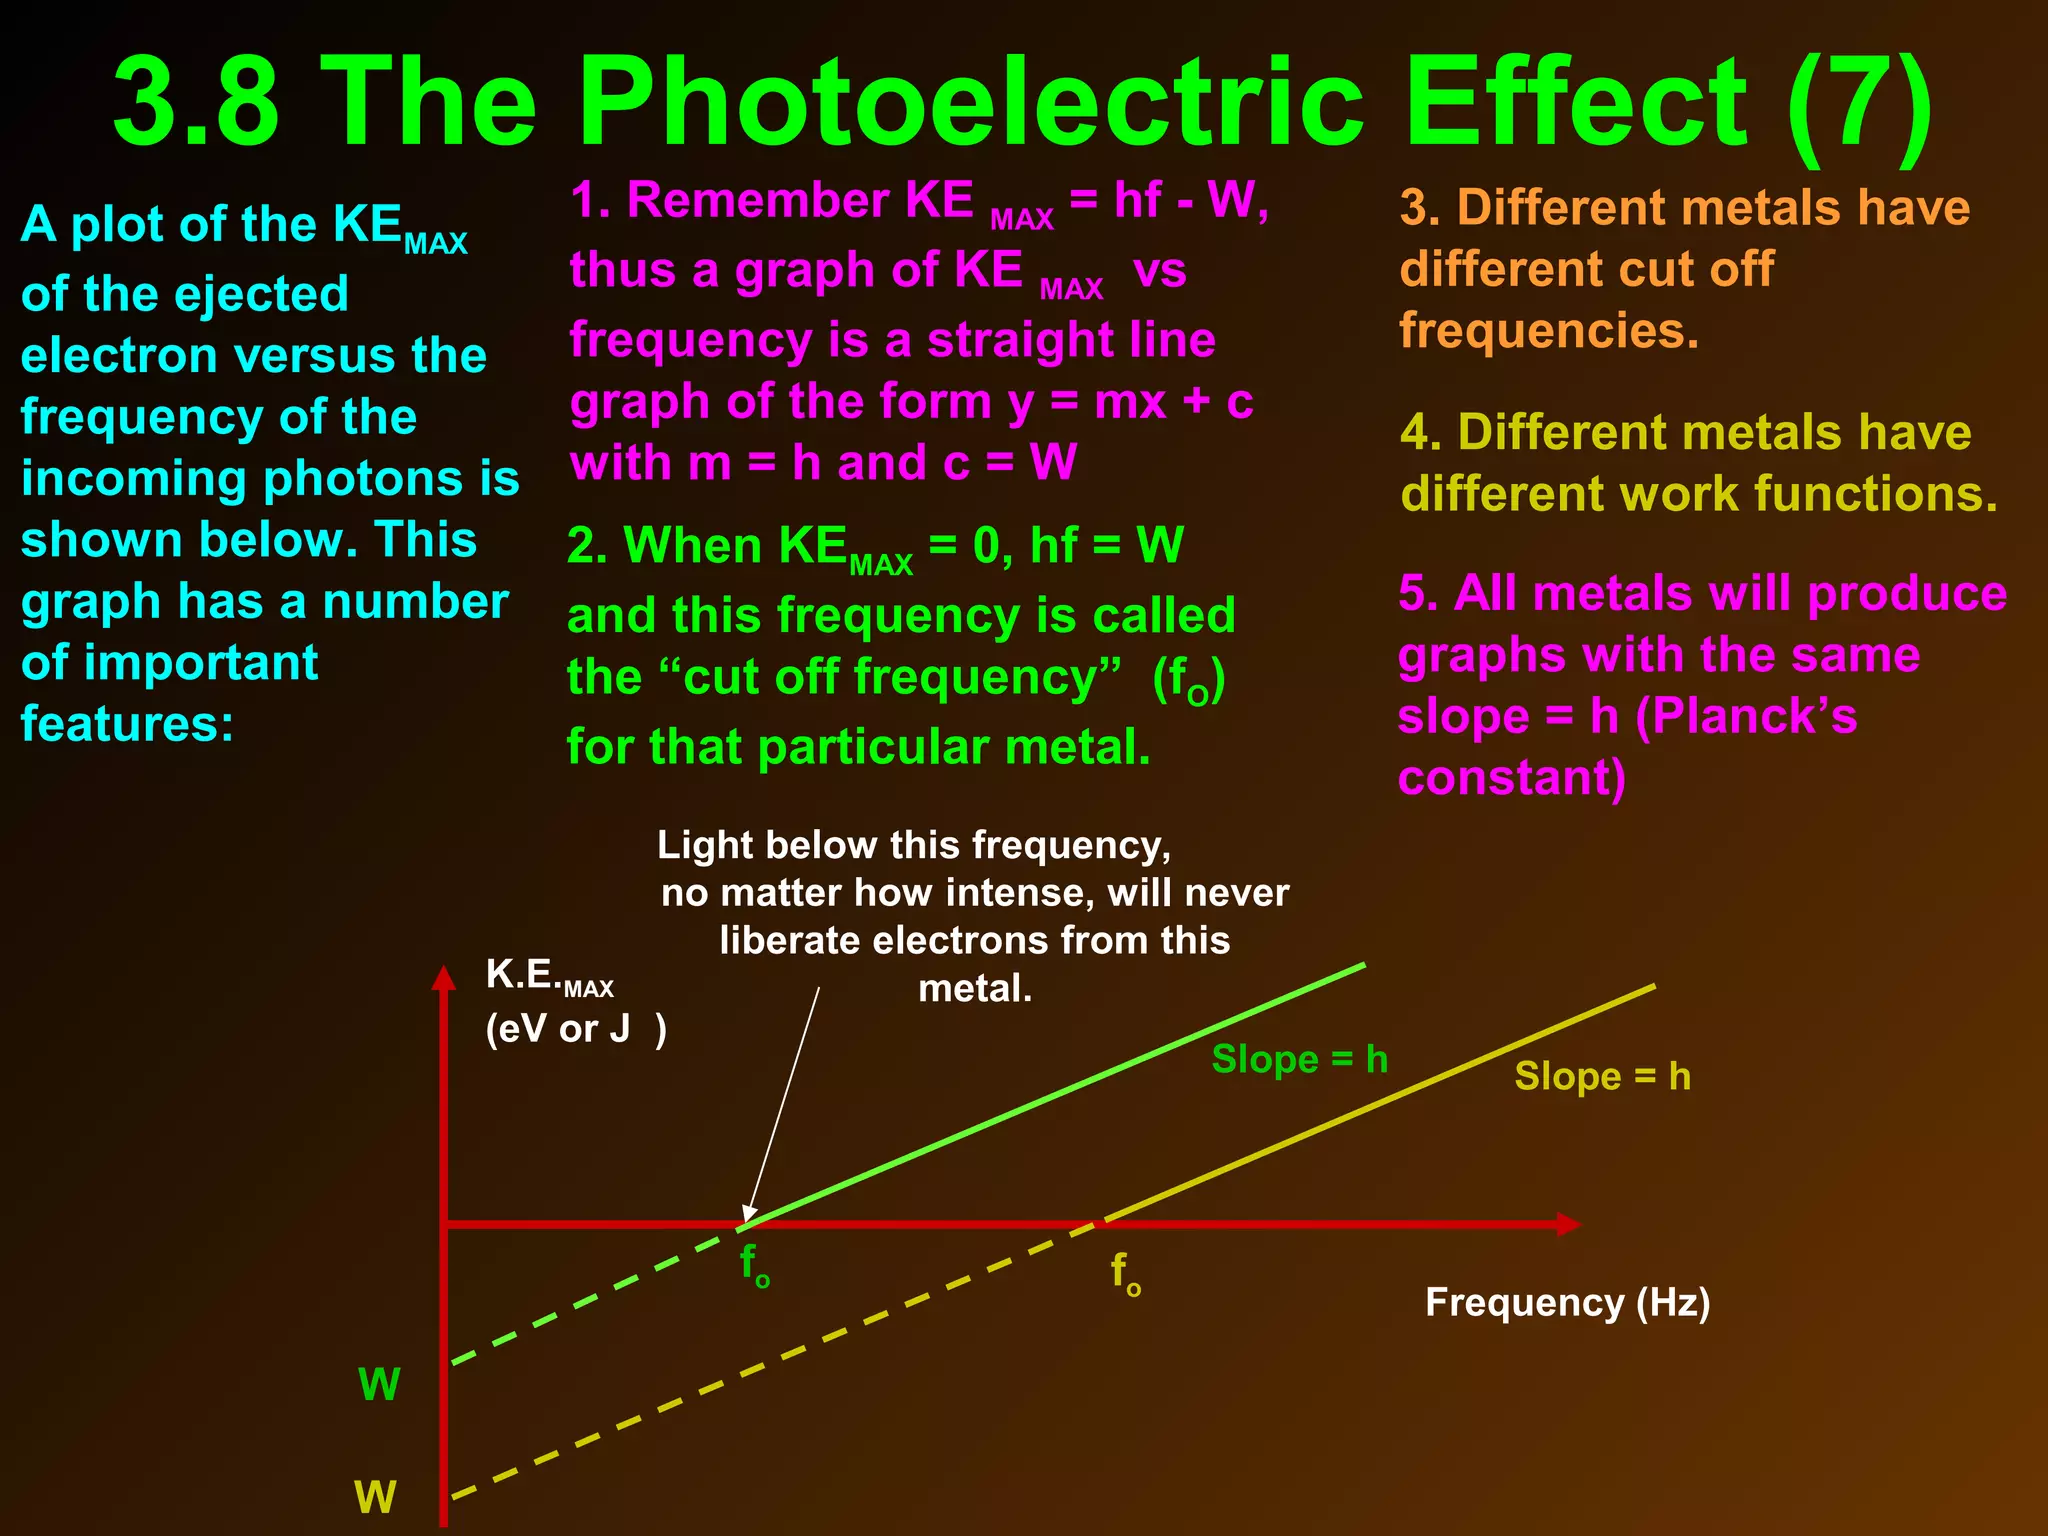
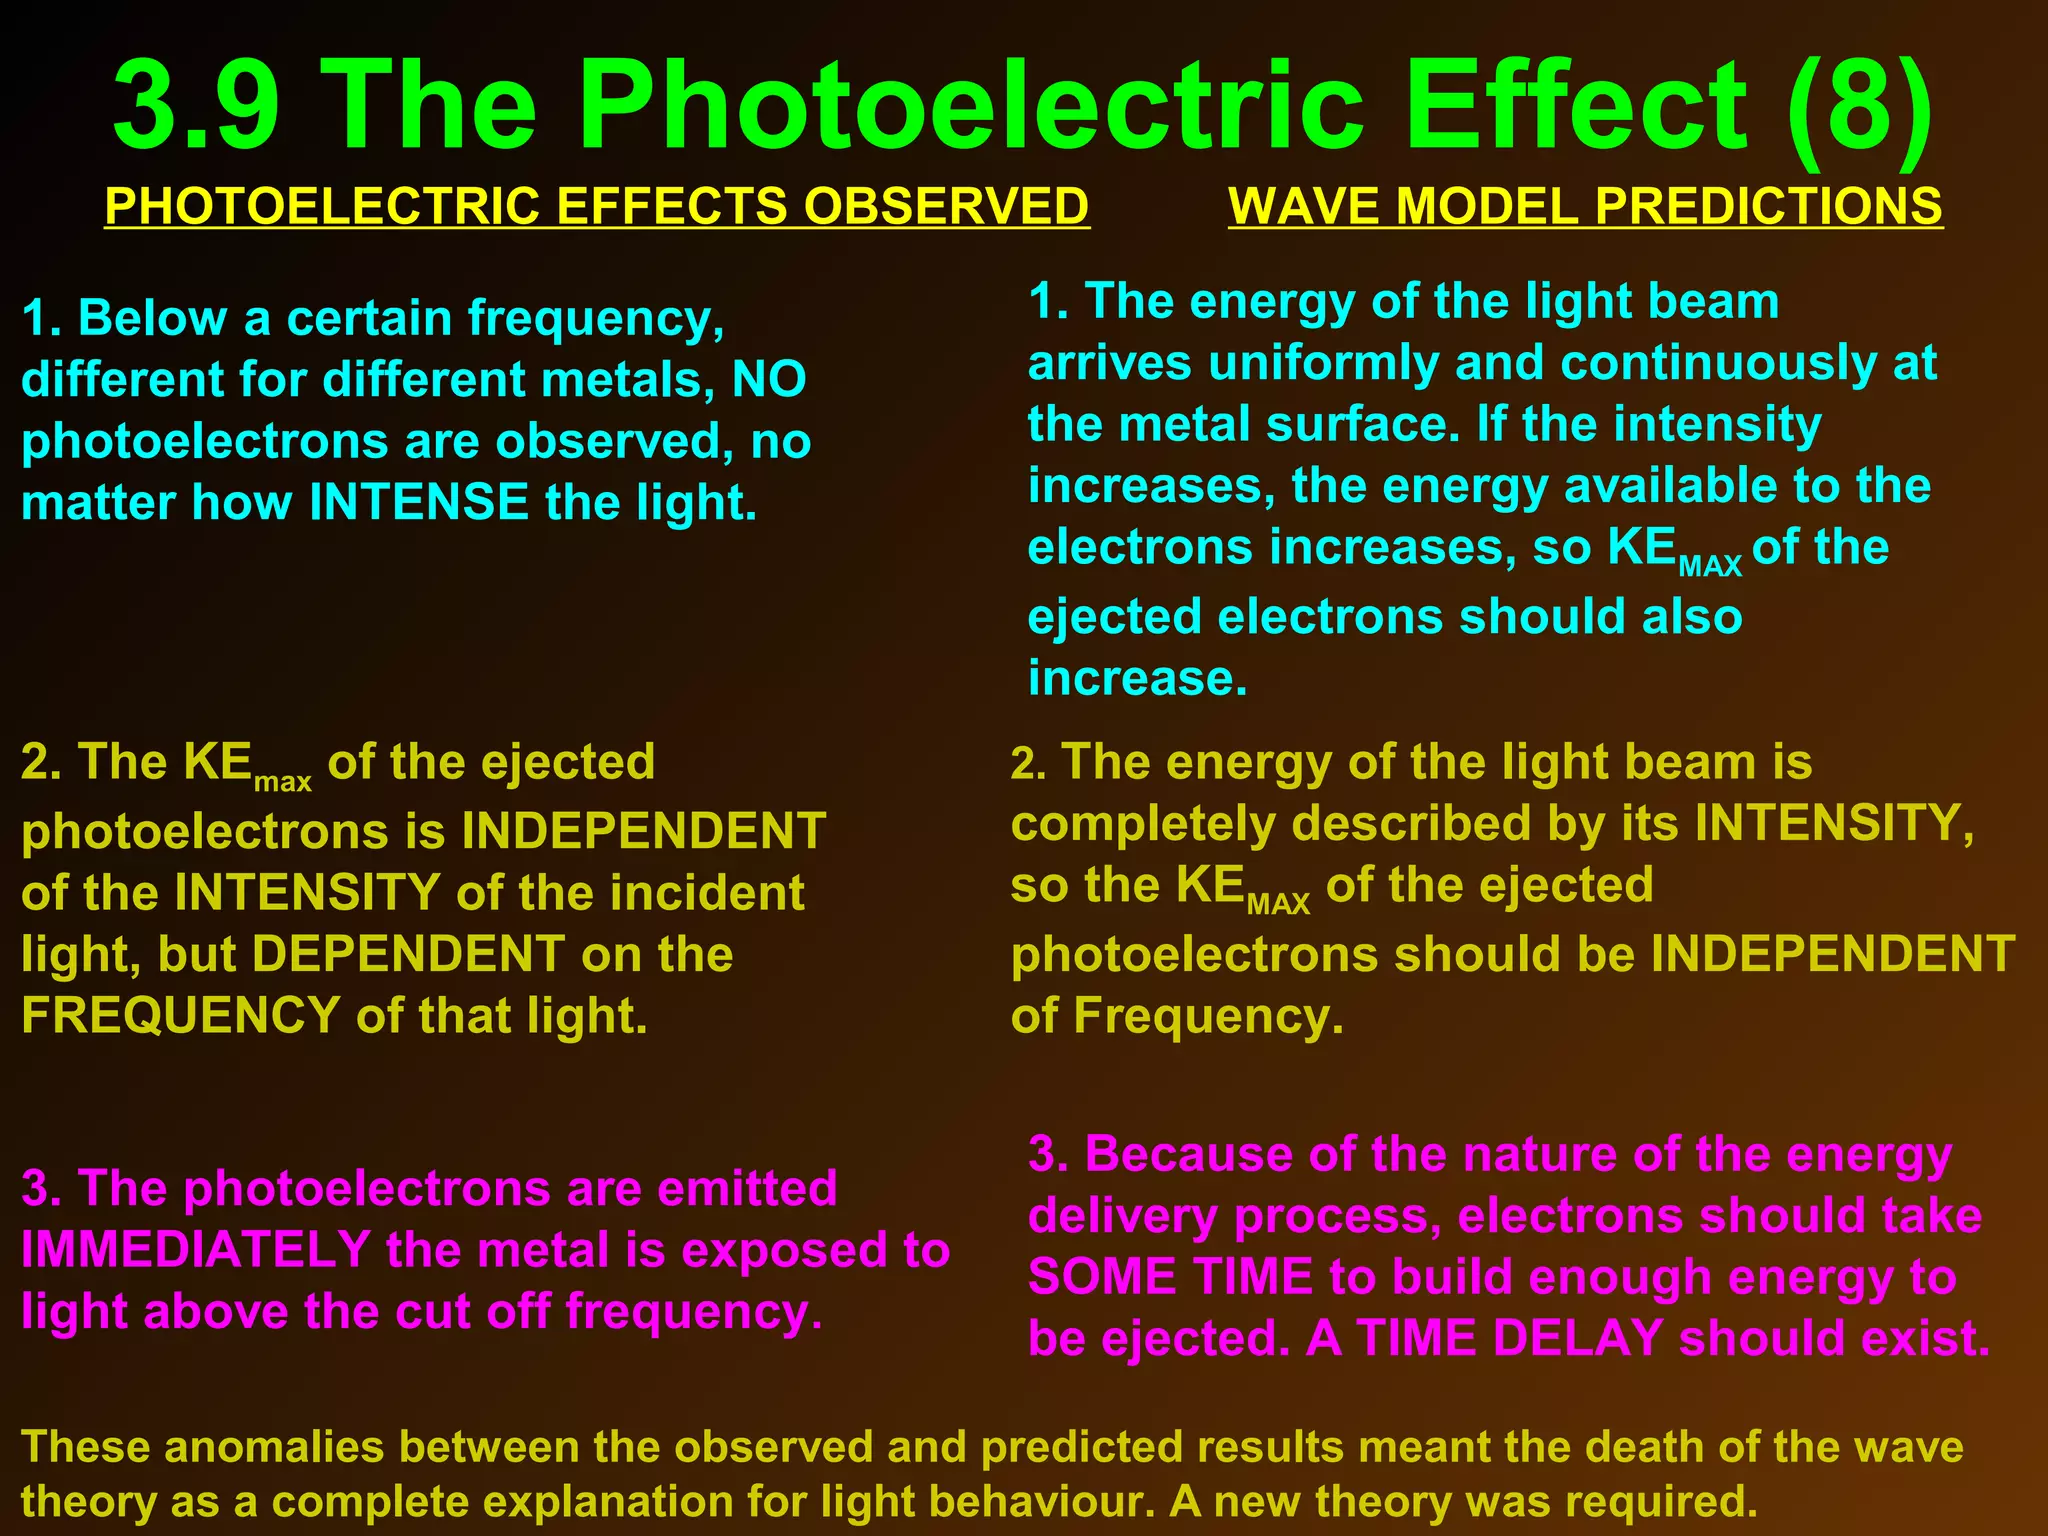
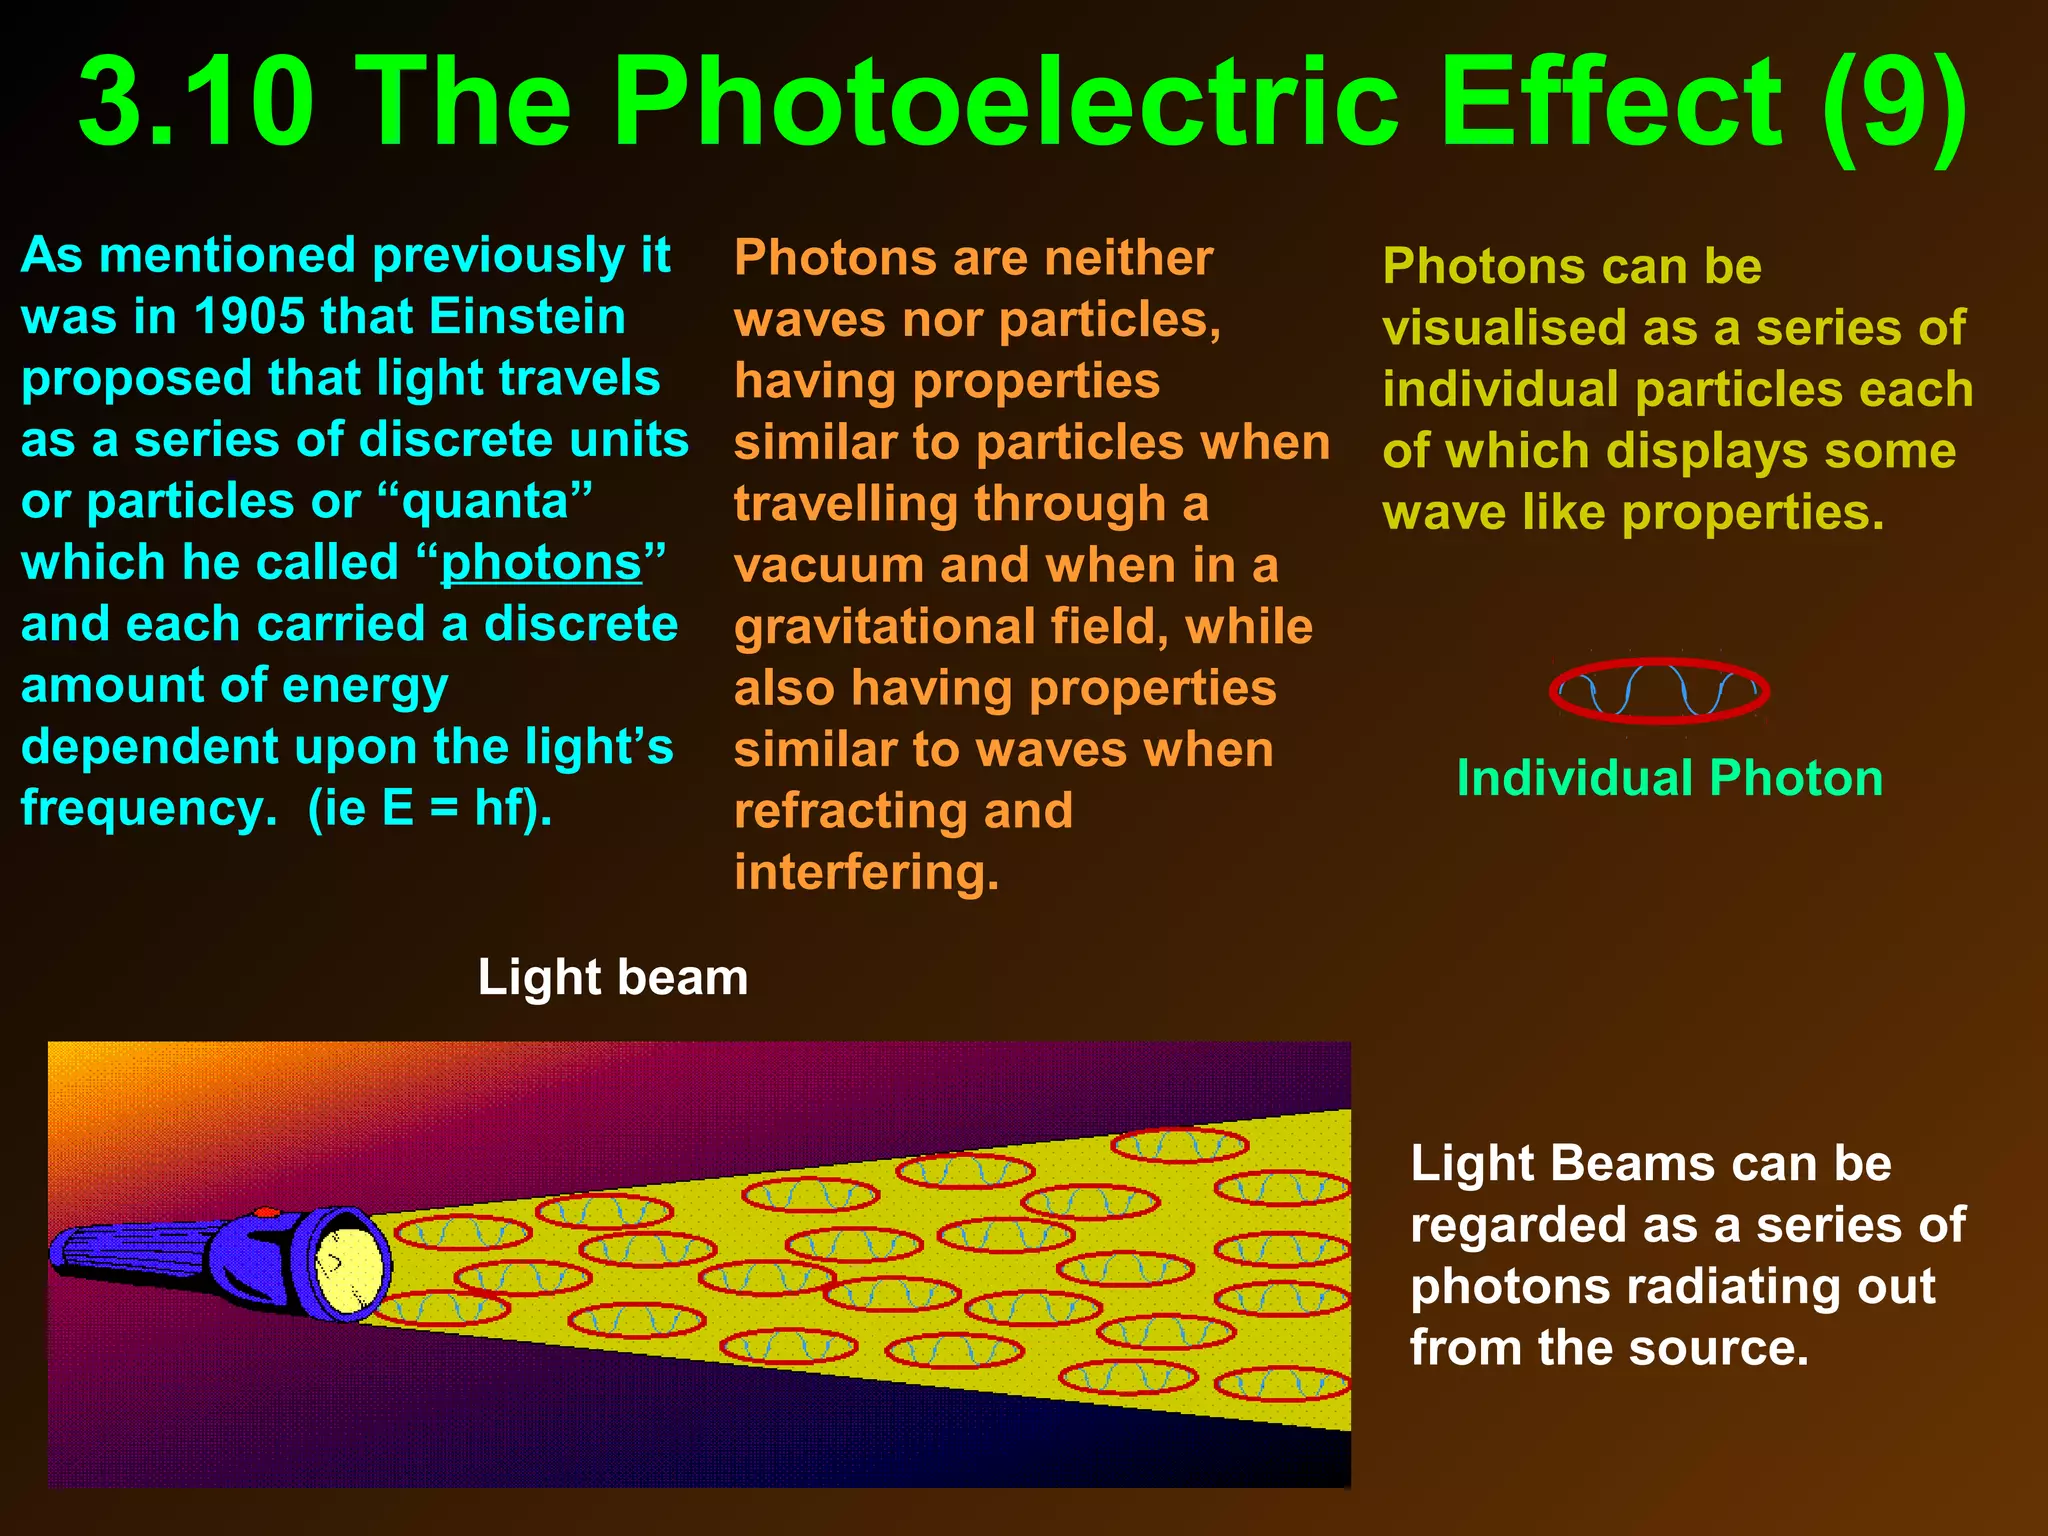
The photoelectric effect provides evidence that light behaves as particles. When light shines on a metal surface, electrons can be emitted. This is explained by assuming that light is made up of particles called photons, with each photon having an energy determined by its frequency. The kinetic energy of the emitted electrons depends on the frequency of the incident light, not its intensity. This is consistent with a particle model where each photon transfers its energy to an electron. The wave-particle duality of light is evidenced by both its particle-like properties in the photoelectric effect and its wave-like properties demonstrated in phenomena such as interference and diffraction.
DLSU SSP -(Solid State Physics) Laboratory conducts research on nanomaterials and new materials with different functionalities for the 21st century technological applications
Summary of Pedigree Chart symbols.
How to use pedigree charts to analyse genetic conditions
Please note: this resource found on a fileserver on the internet. Author unknown.
Each month, join us as we highlight and discuss hot topics ranging from the future of higher education to wearable technology, best productivity hacks and secrets to hiring top talent. Upload your SlideShares, and share your expertise with the world!
Not sure what to share on SlideShare?
SlideShares that inform, inspire and educate attract the most views. Beyond that, ideas for what you can upload are limitless. We’ve selected a few popular examples to get your creative juices flowing.
38
RING GAUGES
Ring gauges are mainly used for checking the diameter of shafts having a central hole. The hole is accurately finished by grinding and lapping after taking hardening process.
The periphery of the ring is knurled to give more grips while handling the gauges. We have to make two ring gauges separately to check the shaft such as GO ring gauge and NOGO ring gauge.
But the hole of GO ring gauge is made to the upper limit size of the shaft and NOGO for the lower limit.
While checking the shaft, the GO ring gauge will pass through the shaft and NOGO will not pass.
To identify the NOGO ring gauges easily, a red mark or a small groove cut on its periphery.
Transcript: Selling digital books in 2024: Insights from industry leaders - T...BookNet Canada
The publishing industry has been selling digital audiobooks and ebooks for over a decade and has found its groove. What’s changed? What has stayed the same? Where do we go from here? Join a group of leading sales peers from across the industry for a conversation about the lessons learned since the popularization of digital books, best practices, digital book supply chain management, and more.
Link to video recording: https://bnctechforum.ca/sessions/selling-digital-books-in-2024-insights-from-industry-leaders/
Presented by BookNet Canada on May 28, 2024, with support from the Department of Canadian Heritage.
Slack (or Teams) Automation for Bonterra Impact Management (fka Social Soluti...Jeffrey Haguewood
Sidekick Solutions uses Bonterra Impact Management (fka Social Solutions Apricot) and automation solutions to integrate data for business workflows.
We believe integration and automation are essential to user experience and the promise of efficient work through technology. Automation is the critical ingredient to realizing that full vision. We develop integration products and services for Bonterra Case Management software to support the deployment of automations for a variety of use cases.
This video focuses on the notifications, alerts, and approval requests using Slack for Bonterra Impact Management. The solutions covered in this webinar can also be deployed for Microsoft Teams.
Interested in deploying notification automations for Bonterra Impact Management? Contact us at sales@sidekicksolutionsllc.com to discuss next steps.
PHP Frameworks: I want to break free (IPC Berlin 2024)Ralf Eggert
In this presentation, we examine the challenges and limitations of relying too heavily on PHP frameworks in web development. We discuss the history of PHP and its frameworks to understand how this dependence has evolved. The focus will be on providing concrete tips and strategies to reduce reliance on these frameworks, based on real-world examples and practical considerations. The goal is to equip developers with the skills and knowledge to create more flexible and future-proof web applications. We'll explore the importance of maintaining autonomy in a rapidly changing tech landscape and how to make informed decisions in PHP development.
This talk is aimed at encouraging a more independent approach to using PHP frameworks, moving towards a more flexible and future-proof approach to PHP development.
Software Delivery At the Speed of AI: Inflectra Invests In AI-Powered QualityInflectra
In this insightful webinar, Inflectra explores how artificial intelligence (AI) is transforming software development and testing. Discover how AI-powered tools are revolutionizing every stage of the software development lifecycle (SDLC), from design and prototyping to testing, deployment, and monitoring.
Learn about:
• The Future of Testing: How AI is shifting testing towards verification, analysis, and higher-level skills, while reducing repetitive tasks.
• Test Automation: How AI-powered test case generation, optimization, and self-healing tests are making testing more efficient and effective.
• Visual Testing: Explore the emerging capabilities of AI in visual testing and how it's set to revolutionize UI verification.
• Inflectra's AI Solutions: See demonstrations of Inflectra's cutting-edge AI tools like the ChatGPT plugin and Azure Open AI platform, designed to streamline your testing process.
Whether you're a developer, tester, or QA professional, this webinar will give you valuable insights into how AI is shaping the future of software delivery.
"Impact of front-end architecture on development cost", Viktor TurskyiFwdays
I have heard many times that architecture is not important for the front-end. Also, many times I have seen how developers implement features on the front-end just following the standard rules for a framework and think that this is enough to successfully launch the project, and then the project fails. How to prevent this and what approach to choose? I have launched dozens of complex projects and during the talk we will analyze which approaches have worked for me and which have not.
LF Energy Webinar: Electrical Grid Modelling and Simulation Through PowSyBl -...DanBrown980551
Do you want to learn how to model and simulate an electrical network from scratch in under an hour?
Then welcome to this PowSyBl workshop, hosted by Rte, the French Transmission System Operator (TSO)!
During the webinar, you will discover the PowSyBl ecosystem as well as handle and study an electrical network through an interactive Python notebook.
PowSyBl is an open source project hosted by LF Energy, which offers a comprehensive set of features for electrical grid modelling and simulation. Among other advanced features, PowSyBl provides:
- A fully editable and extendable library for grid component modelling;
- Visualization tools to display your network;
- Grid simulation tools, such as power flows, security analyses (with or without remedial actions) and sensitivity analyses;
The framework is mostly written in Java, with a Python binding so that Python developers can access PowSyBl functionalities as well.
What you will learn during the webinar:
- For beginners: discover PowSyBl's functionalities through a quick general presentation and the notebook, without needing any expert coding skills;
- For advanced developers: master the skills to efficiently apply PowSyBl functionalities to your real-world scenarios.
State of ICS and IoT Cyber Threat Landscape Report 2024 previewPrayukth K V
The IoT and OT threat landscape report has been prepared by the Threat Research Team at Sectrio using data from Sectrio, cyber threat intelligence farming facilities spread across over 85 cities around the world. In addition, Sectrio also runs AI-based advanced threat and payload engagement facilities that serve as sinks to attract and engage sophisticated threat actors, and newer malware including new variants and latent threats that are at an earlier stage of development.
The latest edition of the OT/ICS and IoT security Threat Landscape Report 2024 also covers:
State of global ICS asset and network exposure
Sectoral targets and attacks as well as the cost of ransom
Global APT activity, AI usage, actor and tactic profiles, and implications
Rise in volumes of AI-powered cyberattacks
Major cyber events in 2024
Malware and malicious payload trends
Cyberattack types and targets
Vulnerability exploit attempts on CVEs
Attacks on counties – USA
Expansion of bot farms – how, where, and why
In-depth analysis of the cyber threat landscape across North America, South America, Europe, APAC, and the Middle East
Why are attacks on smart factories rising?
Cyber risk predictions
Axis of attacks – Europe
Systemic attacks in the Middle East
Download the full report from here:
https://sectrio.com/resources/ot-threat-landscape-reports/sectrio-releases-ot-ics-and-iot-security-threat-landscape-report-2024/
Dev Dives: Train smarter, not harder – active learning and UiPath LLMs for do...UiPathCommunity
💥 Speed, accuracy, and scaling – discover the superpowers of GenAI in action with UiPath Document Understanding and Communications Mining™:
See how to accelerate model training and optimize model performance with active learning
Learn about the latest enhancements to out-of-the-box document processing – with little to no training required
Get an exclusive demo of the new family of UiPath LLMs – GenAI models specialized for processing different types of documents and messages
This is a hands-on session specifically designed for automation developers and AI enthusiasts seeking to enhance their knowledge in leveraging the latest intelligent document processing capabilities offered by UiPath.
Speakers:
👨🏫 Andras Palfi, Senior Product Manager, UiPath
👩🏫 Lenka Dulovicova, Product Program Manager, UiPath
Smart TV Buyer Insights Survey 2024 by 91mobiles.pdf91mobiles
91mobiles recently conducted a Smart TV Buyer Insights Survey in which we asked over 3,000 respondents about the TV they own, aspects they look at on a new TV, and their TV buying preferences.
JMeter webinar - integration with InfluxDB and GrafanaRTTS
Watch this recorded webinar about real-time monitoring of application performance. See how to integrate Apache JMeter, the open-source leader in performance testing, with InfluxDB, the open-source time-series database, and Grafana, the open-source analytics and visualization application.
In this webinar, we will review the benefits of leveraging InfluxDB and Grafana when executing load tests and demonstrate how these tools are used to visualize performance metrics.
Length: 30 minutes
Session Overview
-------------------------------------------
During this webinar, we will cover the following topics while demonstrating the integrations of JMeter, InfluxDB and Grafana:
- What out-of-the-box solutions are available for real-time monitoring JMeter tests?
- What are the benefits of integrating InfluxDB and Grafana into the load testing stack?
- Which features are provided by Grafana?
- Demonstration of InfluxDB and Grafana using a practice web application
To view the webinar recording, go to:
https://www.rttsweb.com/jmeter-integration-webinar
Accelerate your Kubernetes clusters with Varnish CachingThijs Feryn
A presentation about the usage and availability of Varnish on Kubernetes. This talk explores the capabilities of Varnish caching and shows how to use the Varnish Helm chart to deploy it to Kubernetes.
This presentation was delivered at K8SUG Singapore. See https://feryn.eu/presentations/accelerate-your-kubernetes-clusters-with-varnish-caching-k8sug-singapore-28-2024 for more details.
Builder.ai Founder Sachin Dev Duggal's Strategic Approach to Create an Innova...Ramesh Iyer
In today's fast-changing business world, Companies that adapt and embrace new ideas often need help to keep up with the competition. However, fostering a culture of innovation takes much work. It takes vision, leadership and willingness to take risks in the right proportion. Sachin Dev Duggal, co-founder of Builder.ai, has perfected the art of this balance, creating a company culture where creativity and growth are nurtured at each stage.
2. Unit Outline
To achieve the outcome the student should demonstrate the knowledge and skills to :
• Explain the production of incoherent light from wide spectrum light sources including the
Sun, light bulbs and candles (descriptive) in terms of thermal motion of electrons.
• Explain the results of Young’s double slit experiment as evidence for the wave like nature
of light including:
– constructive and destructive interference in terms of path difference
– qualitative effect of wavelength on interference patterns
• Interpret the pattern produced by light when it passes through a gap or past an obstacle in
terms of the diffraction of waves and the significance of the magnitude of the λ/w ratio
• interpret the photoelectric effect as evidence of the particle like nature of light including the
KE of emitted photoelectrons in terms of the energy of incident photons Ekmax = hf – W, using
energy units of both joules and electron-volts, effects of intensity of incident irradiation on
the emission of photoelectrons.
• interpret electron diffraction patterns as evidence of the wavelike nature of matter
expressed as the De Broglie wavelength λ = h/p
• compare momentum of photons and of particles of the same wavelength including
calculations using p = h/λ
• interpret atomic absorption and emission spectra, including those from metal vapour lamps
in terms of the quantised energy level model of the atom, including calculations of the
energy of photons emitted or absorbed. ∆E = hf
• explain a model of quantised energy levels of the atom in which electrons are found in
standing wave states
• use safe and responsible practises when working with light sources, lasers and related
equipment.
3. Chapter 1
Topics covered:
• The Nature of Light.
• Interference.
• Incoherent Light.
• Coherent Light
• Young’s Experiment.
• Path Difference
• Single Slit Diffraction
• Diffraction around Objects
4. 1.0 The Nature of Light
EMR is a self propagating wave
consisting of mutually
perpendicular, varying
ELECTRIC and MAGNETIC
FIELDS.
EMR travels through a vacuum
at 300,000 kms-1
, (3.0 x 10⁸
ms-1
)
Direction of
Electromagnetic Wave
Movement
Changing
Magnetic Field
Changing
Electric Field
Light is a form of ENERGY.
It is described as ELECTRO -
MAGNETIC RADIATION (EMR).
5. 1.1 Superposition
When two wave trains interact
with one another they also
undergo SUPERPOSITION and
will either:
1. Add together to produce a
larger wave - a process called
CONSTRUCTIVE INTERFERENCE
or
2. Subtract from one another to
produce no wave – a process called
DESTRUCTIVE INTERFERENCE
Single waves, called
pulses. have the ability
to pass through one
another and, while
occupying the same
space, add together in a
process called
SUPERPOSITION.
Once the
superposition is
complete the pulses
continue their
journey unaffected.
CrestTrough
A series of pulses
together form a
wave train with
alternating crests
and troughs
Constructive interference occurs when
the two wave trains are in phase
Destructive interference occurs when
the two wave trains are 1800
out of
phase
6. 1.2 Interference
Waves, in this case water
waves, when passed
through two narrow slits,
“interfere” or interact with
one another to produce
areas of large disturbances
(Constructive Interference)
Constructive
Interference
Destructive
Interference
Light behaves in a similar manner.
When light (with certain properties)
is passed through two narrow slits,
an “interference pattern” is
produced, showing constructive
(light bands) and destructive (dark
bands) interference.
Bright bands occur
where a crest and a
crest (or a trough and a
trough) arrive at the
screen at the same time
Dark bands
occur when a
crest and a
trough arrive at
the screen at
the same time
Bright
Band
Dark
Band
or areas of no disturbance
(Destructive Interference)
Crest
Trough
7. 1.3 Incoherent Light
Light is generated by luminous bodies, eg,
The Sun, light globes, burning candles.
Typical light sources such as those
mentioned above have an inbuilt
irregularity in the way they produce light.
Light is produced when atoms of the
filaments or source become electrically
excited and produce an electromagnetic
or light wave. Since the excitations occur in an
unpredictably random fashion, the
light waves are NOT produced in
regular repeating manner and so do
not maintain a constant “phase
relationship” with one other.
About once every 10-8
sec, a source
will randomly alter its phase.
This leads to the sources giving off a
broad spectrum of white light composed
of all colours in the rainbow.
Each of the millions of colours have
waves that are random to each other.
This is called INCOHERENT LIGHT.
Incoherent light, when combined,
produces rapidly moving areas of
constructive and destructive
interference and therefore do not
produce a stable, visible interference
pattern.
8. Light & Matter Revision
Question Type:
Q1: The light from a candle can best be described as
A. coherent, arising from the vibrations of electrons.
B. incoherent, arising only from the transition of electrons in excited
energy levels falling to lower energy levels.
C. coherent, arising only from the transition of electrons in excited energy
levels falling to lower energy levels.
D. incoherent, arising from the vibrations of electrons.
Incandescent Light
9. Light & Matter Revision
Question Type:
The spectrum of wavelengths produced by a particular
incandescent light globe is shown in Figure 1 below.
Q3: Describe the mechanism by which light is
produced in an incandescent light globe.
Q2: The light produced by an
incandescent light globe can
best be described as
A. coherent.
B. incoherent.
C. monochromatic.
D. in phase.
Incandescent Light
The thermal/random excitation of
electrons in the filament leads to the
emission of a broad/continuous spectrum.
10. 1.4 Coherent Light
Two waves that are coherent can
be combined to produce an
unmoving distribution of
constructive and destructive
interference (a visible
interference pattern) depending
on the relative phase of the
waves at their meeting point.
Coherence is a property of waves that
measures their ability to interfere with
each other.
Coherent waves (constant
phase difference)
Lasers generate light at a single
wave length and frequency and all
of the waves (and PHOTONS) are in
phase.
This is called COHERENT LIGHT.
Shown are monochromatic (single
colour) light waves of the same
frequency.
They are coherent and in phase, and will
combine constructively to produce bright
white light
Coherent waves (zero phase
difference)
11. Light & Matter Revision
Question Type:
Q4: Which of the following light sources will
produce coherent, monochromatic light
A. Sunlight
B. LED
C. Light globe with filter
D. LASER
Coherent Light
12. Double Slits
1.5 Young’s Experiment
Screen
Long wavelength, RED light
produces a pattern with wider
red bands which are spread
farther apart.
First performed by
Thomas Young in the
early 1800’s this
experiment proved
light was a wave.
It has been voted the
most elegant
experiment ever
devised.
BLUE Light
using the same slits
RED Light
When light of a single frequency
(colour) is passed through a pair
of closely spaced, narrow slits
an “interference pattern” is
produced.
This pattern has a series of equally
spaced coloured and black bands
spread across the screen onto
which it is projected.
The width of the coloured bands
and their spacing depends on
the wavelength of the light used.
Short wavelength, BLUE light
produces a pattern with narrow blue
bands which are closely spaced.
Thomas Young
1773 –
1829
Incident Light
c
13. Light & Matter Revision
Question Type:
Thomas Young’s double slit experiment
has been replicated in the experimental
arrangement shown in Figure 4.
Q5: Explain using the wave theory of
light why a series of bright and dark
bars are observed on the screen.
The slits are now moved further
from the screen.
Q6: What effect would this have
on the pattern observed on the
screen?
Slits provide 2 coherent sources
leading to superposition which
produces constructive and
destructive interference leading to
bright and dark bars on screen
Young’s Experiment
The pattern will spread further
across the screen.
14. Light & Matter Revision
Question Type:
A physics teacher has
apparatus to show
Young’s double slit
experiment. The
apparatus is shown in
Figure 4.
The pattern of bright and
dark bands is observed
on the screen.
Q7: Which one of the following actions will increase the distance, Δx,
between dark bands in this double slit interference pattern?
A. decrease the slit width
B. decrease the slit separation
C. decrease the slit screen distance
D. decrease the wavelength of the light
Young’s Experiment
15. S1
S2
Slits
S1 S2
Light travels the same distance from S1 and S2
to reach the central bright band, BC
The path difference
S1BC – S2BC = 0.
1.6 Path Difference
So a crest and a crest
(or trough and trough)
arrive at AC at the same
time, leading to
constructive
interference or a bright
band
The dark band (D1) on
either side of AC occurs
because a crest and a
trough are arriving at the
same time leading to
destructive interference.
Path difference:
S1D1 – S2D1 = ½ λ
For the next bright
band path difference
S1B1 – S2B1 = 1 λ
For the next bright
band path difference
would be:
S1B2 – S2B2 = 2λ
So bright bands occur
when path difference = nλ
where n = 0,1,2,3,etc
The next dark band (D2)
has path difference = 1½λ
BC D1D1 B1B1 D2D2
So dark bands occur
when
path difference = (n + ½)λ
where n =
0,1,2,3, etc
16. Light & Matter Revision
Question Type:
In the following diagram, laser light of
wavelength 600 nm is shone onto a pair of
parallel slits and a pattern of alternating
light/dark bands is projected onto a wall.
Q8: Explain how the observed pattern
on the wall supports a wave model for
light.
The alternating pattern represents an interference pattern which is a wave
phenomenon. The bright bands represent regions of constructive interference
where the difference in path length from each source is a multiple of
wavelengths. Waves therefore arrive from both sources in phase. The dark
regions represent bands of destructive interference with the waves being half
a wavelength out of phase due to path differences.
Q9: Estimate the difference in
length between P1 and P2.
The indicated position is on
the sixth antinode from the
centre.
The path difference is
6λ = 6 × 600nm = 3.6 ×10⁻⁶
m
Interference – Path Difference
17. Light & Matter Revision
Question Type:
Students have set up an experiment similar
to that of English physicist Thomas Young.
The students’ experiment uses microwaves
of wavelength λ = 2.8 cm instead of light.
The beam of microwaves passes through
two narrow slits shown as S1 and S2 in
Figure 3.
The students measure the intensity of the
resulting beam at points along the line
shown and determine the positions of
maximum intensity. These are shown as
filled circles and marked P0, P1 . . .
Q10: What is the difference in length
(S2P2 - S1P2) where P2 is the second
maximum away from the central axis.
Path difference to 2nd
max = 2λ = 5.6 cm
Interference – Path Difference
18. 1.7 Single Slit Diffraction
Diffraction patterns for blue and
red light show that the shorter
wavelength blue light produces the
more “compact” pattern,
When light of a single
wavelength shines
through a narrow gap or
single slit, a “diffraction
pattern” is produced.
THE EXTENT OF
DIFFRACTION
DEPENDS UPON
THE RATIO λ/w,
WHERE λ =
WAVELENGTH
AND w = SLIT
WIDTH.
Appreciable diffraction will occur if
the ratio λ/w is between about 0.1
and 50. Outside this range,
diffraction is not observed.
The pattern consists of
a rather wide, coloured
central maximum with
a series of thinner
coloured and dark
bands spreading out
from the centre.
Screen
Single Slit
Width = w
Incident Light
Wavelength = λ
BLUE light using same slit
RED light
while
the longer wavelength red
produces a more spread out
pattern
In other words, the spacing
between the lines is
wavelength dependent and
patterns with the same line
spacing were made by light
of the same wavelength
Note: The wider the slit the narrower central maximum
19. Light & Matter Revision
Question Type:
In an experiment,
monochromatic laser light of
wavelength 600 nm shines
through a narrow slit, and the
intensity
of the transmitted light is
recorded on the screen some
distance away as shown in
Figure 2a. The intensity
pattern seen on the screen is
shown in Figure 2b.
Q11: Which one of the
intensity patterns (A-D) below
best indicates the pattern that
would be seen if a wider slit
was used?
Single Slit Diffraction
20. 1.8 Diffraction around Objects
In addition to diffraction
occurring when light passes
through gaps, it can also
occur when light passes
around objects
Sunlight diffracting around
a car tail light lens
The shadow of a
hand holding a coin
illuminated by a He –
Ne Laser.
Red Light
Diffracting around a
pinhead
You can see a
diffraction
pattern
through your
fingers
Point your hand
toward a light
source and view
through this gap
21. Chapter 2
Topics covered:
• Models for Light Behaviour.
• Particle like Properties of Light.
• Wave like Properties of Light.
22. 2.0 Models for Light Behaviour
• Light is/has energy and thus
can do work. We see this in
things like plants growing or
the chemical reactions on
photographic films.
• It is quite easy to list or show
what light DOES but more
difficult to say what light IS !
• Much time and effort has
been put into trying to find a
THEORY or MODEL which
will explain ALL the
properties and behaviours
exhibited by light.
Two separate models have
been proposed:
1. The Particle Model:
This says that all properties of
light can be explained by
assuming light is made up of
a stream of individual
particles.
2. The Wave Model:
This says that all properties of
light can be explained by
assuming light is made up of
a stream of waves.
23. 2.1 Particle like Properties of
Light
• Most properties of light can
be explained using the “Wave
Model”.
• However, some properties
can only be explained by
assuming light is made up of
a “stream of particles”.
• These particle like properties
are:
1. Light exerts pressure.
2. Light can travel through a
vacuum as well as through
transparent media.
3. Beams of light are bent by
gravity.
5. Light reflects from shiny
surfaces (both a wave and particle like
property).
6. Different colours correspond to
different energies of light (both a wave
and particle property).
4. Certain colours of light can cause
electrons to be emitted from some
metal surfaces. This is called the
Photoelectric Effect.
24. 2.2 Wave Like Properties of Light
• Light exhibits many properties which
can be demonstrated by other forms
of waves eg. Water waves or waves on
springs or strings.
• These wavelike properties of light are:
1. Light travels very fast, but its speed
does depend upon the medium
through which it moves.
2. Light undergoes Reflection according
to the Laws of Reflection.
3. Light undergoes Refraction according
to the Laws of Refraction.
4. Light undergoes Diffraction when
passing through narrow gaps.
5. Light beams can pass through one
another unaffected.
6. Different colours of light correspond
to different energies.
7. Light forms interference patterns
when passed through a pair of
closely spaced, narrow slits.
25. Light & Matter Revision
Question Type:
Q12. Light sometimes behaves as a particle and
sometimes as a wave. Which one or more of the
following properties does light sometimes show?
A. mass
B. momentum
C. charge
D. energy
Light Properties
26. Light & Matter Revision
Question Type:
Q 13: The table below contains some predictions for the
behaviour of light incident on a shiny metal sheet. Complete the
table by placing a .Y. (Yes) or .N. (No) in the appropriate boxes if
the prediction is supported by the wave and/or particle model of
light. Some answers have already been provided. It is possible for
predictions to be supported by both models
Y
N
N
Y
Models for Light
27. Chapter 3
Topics covered:
• The Photoelectric Effect.
• Electron Energies
• Energy Units
• Practical Applications
28. 3.0 The Photoelectric Effect
Einstein called these individual
light particles PHOTONS
The most important of the
particle like properties of
light is the Photoelectric
Effect.
Simply put, the photoelectric
effect occurs when light
shines on a metal surface
causing electrons to be
ejected from the metal.
There are, however, certain restrictions:
(a) Only certain metals respond.
(b) Light must be above a certain
frequency - the Cut Off Frequency.
Albert Einstein won his Nobel
Prize for his explanation of this
phenomena not for his work on
Relativity
Louis De Broglie working in the 1920’s
suggested a photon looked like this.
29. 3.1 The Photoelectric Effect (2)
Incident Photon
G
Rheostat
+
Galvanometer
e
Ejected Electron
The photoelectric effect is best studied
using the demonstration circuit shown.
An incident photon of the right frequency
(that is above the Cut Off Frequency)
striking a susceptible metal (such as
aluminium, copper, lead, zinc and many
others), will free an electron.
The electron will cross the gap in the
evacuated tube, due to electrostatic
attraction.
So a stream of incident photons striking
the metal will release a stream of electrons,
setting up a current in the circuit which will
be detected by the galvanometer (a
sensitive ammeter able to detect currents
in the μA range).
Evacuated
Glass Tube
+
30. 3.2 The Photoelectric Effect (3)
The size of the current DOES depend
upon the NUMBER of photons striking
the plate.
The NUMBER of photons depends
upon the INTENSITY of the incident
light.
The current (of ejected photoelectrons)
does NOT depend upon the VOLTAGE
between the plates.
Current (I)
Voltage (V)
Bright Light
Dim Light
Low Intensity or Dim Light of a
particular colour or frequency will
produce a small current.
Evacuated
Glass Tube
+
Incident Photon
e
Ejected Electron
High Intensity or Bright Light of the
same frequency will produce a large
current.
31. 3.3 The Photoelectric Effect (4)
Evacuated
Glass Tube
+
G
Rheostat
+
Galvanometer
All e- still have enough
energy to cross the gap
Evacuated
Glass Tube
+
+
G
Rheostat
+
Galvanometer
Some e- now don’t have enough
energy to cross the gap
G
Rheostat
+
Galvanometer
Evacuated
Glass Tube
+
+
+
+
No more electrons cross the gap
thus Current = 0
The slider is again moved until no
electrons have enough energy to cross
the gap and the current drops to zero.
This increasing voltage stops the least
energetic electrons crossing the gap,
reducing the current in the circuit.
Moving the slider on the rheostat
increases the voltage between the
plates.
The power supply has been reversed,
reversing the polarity of the plates.
To study the energy possessed by the
electrons ejected from the metal the
circuit is changed.
VC
Current (I)
Voltage (V)
At this point the “Cut Off Voltage”
(VC) has been reached.
32. -Vc
The fact that the current falls to zero
only slowly as the reverse voltage
increases indicates the photoelectrons
are ejected from the metal surface with
VARYING AMOUNTS OF ENERGY.
Different Intensities of the same
colour (frequency) have the
same cut off voltages
Different frequencies and/or
different metals will have
differing cut off voltages
3.4 The Photoelectric Effect (5)
Current (I)
Voltage (V)
33. Light & Matter Revision
Question Type:
A student carries out an experiment to
investigate the photoelectric effect. She
shines a monochromatic light onto a
metal plate (P) inside a sealed glass
chamber as shown in Figure 2.
The current in the circuit changes as the voltage is varied as shown in Figure 3.
Q14: What is the maximum kinetic
energy (in eV) of the electrons
ejected from the plate P?
1.7 eV
Photoelectric effect
Q15: What is the subsequent
maximum speed of these electrons
ejected from plate P?
KE = ½ mv2
v = 7.73 x 10⁵
ms-1
KEMAX = 1.7 eV = (1.7)(1.6 x 10⁻¹⁹
) J
= 2.72 x 10⁻¹⁹
J
34. Light & Matter Revision
Question Type:
Blue light of wavelength 360 nm was
incident on a potassium metal plate. The
photo electrons emitted from the
potassium plate were collected by a
cathode and anode at varying voltages to
obtain the curve in Figure 3. Potassium
has a work function of 2.3 eV.
Q16: Determine the threshold
frequency of potassium.
W = hfo
fo = W/h
= 2.3/4.14 x 10-15
= 5.56 x 10¹⁴
Hz
Photoelectric effect
Q17: UV light of 200 nm was now shone onto the
potassium plate at the same intensity striking the
cathode. Sketch the resulting curve on the graph in
Figure 3 above.
Q18: Which of the
following (A-D) would
occur if the frequency
was decreased to less
than the threshold
frequency?
A Increased
photocurrent
B Decreased
photocurrent
C Lower stopping
potential
D No signal.
35. 3.5 Electron Energy
When an electron is placed in a
region where a voltage difference
exists (ie. an electric field),
When initially placed into the field, the
electron will possess Electrical Potential
Energy given by the product of the
charge on the electron (q) and the size of
the voltage difference or accelerating
voltage (V) So, E.P.E. = qV
Before proceeding with more on
the Photoelectric Effect a short
detour into the world of electron
energy is required.
Plate 1,
V = 0
Plate 2,
V = +V
EPE
KE = 0
e -
EPE
KE
e -
KE
EPE
e -
EPE
= 0
KE
e -
EPE
KE
e -
it will
undergo an energy conversion
in passing through that voltage
difference.
At this point the electron is stationary
so its KE =0
The electron arrives at Plate 2
where all its initial E.P.E. has
been converted to K.E. Thus
E.P.E.at start = K.E.at finish
Mathematically:
qV = ½mv2
36. 3.6 Energy Units
• Electrons are tiny and the amount of
energy they carry, even when exposed
to accelerating voltages of tens of
millions of volts, is also tiny.
• In order to deal with this situation the
normal energy unit of Joules (a very
large unit) can be replaced by a
special energy unit called the
“electron-Volt” (eV).
• The electron-Volt is defined as the
energy change experienced by an
electron in passing through a Voltage
of 1 Volt.
• Mathematically:
E.P.E. = qV
= (1.6 x 10⁻¹⁹
)(1)
= 1.6 x 10⁻¹⁹
J
Thus 1 eV = 1.6 x 10⁻¹⁹
J
Plate 1, V = 0 Plate 2, V = +1V
e -
K
Ee -
EPE
At Plate 1 the E.P.E. of the e-
= qV = 1.6 x 10⁻¹⁹
J = 1 eV
On arrival at Plate 2 the K.E. of
the e- has increased by 1 eV
and
an electron passing through 10
million volts will have increased its
energy by 10 MeV
Thus an electron passing through
1 thousand volts will have
increased its energy by 1keV
37. 3.7 The Photoelectric Effect (6)
• The ENERGY of the incoming
photons depends upon the
FREQUENCY OF THE LIGHT. So,
blue photons are more energetic
than red ones.
• Mathematically:
E = hf
where E = Energy (J or eV)
h = Planck’s Constant
f = Frequency (Hz)
• Planck’s constant can have 2 values
depending upon the energy units
used:
If Joules: h = 6.63 x 10⁻³⁴
J s;
if eV: h = 4.14 x 10⁻¹⁵
eVs
Some of the photon energy is used free
the electron from the metal lattice and the
rest is converted into the Kinetic Energy
of the ejected electron. This can be
summarised mathematically as:
KEMAX = hf - W
where:
KEMAX = Maximum KE of ejected
electron (J or eV) hf =
Photon Energy (J or eV) W =
Work Function (J or eV)
The term, W, called the Work Function, is
the energy needed to bring the electron
from within the metal lattice to the surface
before it can be ejected.
The Energy carried by the incoming
Photon is TOTALLY ABSORBED by
the electron with which it collides.
38. 3.8 The Photoelectric Effect (7)
5. All metals will produce
graphs with the same
slope = h (Planck’s
constant)
4. Different metals have
different work functions.
3. Different metals have
different cut off
frequencies.
2. When KEMAX = 0, hf = W
and this frequency is called
the “cut off frequency” (fO)
for that particular metal.
1. Remember KE MAX = hf - W,
thus a graph of KE MAX vs
frequency is a straight line
graph of the form y = mx + c
with m = h and c = W
A plot of the KEMAX
of the ejected
electron versus the
frequency of the
incoming photons is
shown below. This
graph has a number
of important
features:
K.E.MAX
(eV or J )
Frequency (Hz)
W
fo
Slope = h
fo
Slope = h
W
Light below this frequency,
no matter how intense, will never
liberate electrons from this
metal.
39. Light & Matter Revision
Question Type:
Susan and Peter conducted a photo-
electric experiment in which they used a
light source and various filters
to allow light of different frequencies to fall
on the metal plate of a photo-electric cell.
The maximum kinetic energy of any emitted
photo-electrons was determined by
measuring the voltage required, VS
(stopping voltage), to just stop them
reaching the collector electrode. The
apparatus is shown in Figure 2.
Figure 3 shows the stopping
voltage, VS, as a function of the
frequency (f) of the light falling on
the plate.
Photoelectric effect
Table 1 shows the work
functions for a series of metals.
40. Light & Matter Revision
Question Type: Photoelectric effect
Q19: Use the information above to
identify the metal surface used in
Susan and Peter’s experiment.
Q20: Use the results in Figure 3 to
calculate the value for Planck’s constant
that Susan and Peter would have
obtained from the data.
You must show your working.
The work function corresponding to
sodium could be found by drawing a
line of best fit through the points on the
graph to determine the y-intercept.
The gradient of the line of best fit gave Planck’s
constant as approximately 4.5 x 10⁻¹⁵
eV s.
41. Light & Matter Revision
Question Type:
Measurements of the kinetic energy of
electrons emitted from potassium
metal were made at a number of
frequencies. The results are shown in
Figure 1.
Q21: What is the minimum energy
of a light photon that can eject an
electron from potassium metal?
1.8 eV
Q22: Which one of the graphs (A-
D) would best describe the result
if the experiment was repeated
with silver metal instead of
potassium metal?
The work function for silver
metal is higher than the work
function for potassium metal.
Photoelectric effect
42. Light & Matter Revision
Question Type:
Some students are
investigating the
photoelectric effect. They
shine light of different
wavelengths onto a
rubidium plate. They
measure the maximum
kinetic energy of
photoelectrons emitted
from the plate. Their data
of maximum kinetic energy
of ejected photoelectrons
as a function of the
frequency of incident light
is shown in Figure 1.
In answering the following
questions, you must use
the data from the graph.
Take the speed of light to
be 3.0 × 10⁸
m s-1
Q23: From the data on the graph, what is the
minimum energy, W, required to remove
photoelectrons from the rubidium plate?
2.0 eV
Photoelectric effect
The students shine light of wavelength λ = 400 nm
onto the rubidium plate.
Q24: From the graph, with what maximum kinetic
energy would the photoelectrons be emitted?
1.0 eV
43. 3.9 The Photoelectric Effect (8)
PHOTOELECTRIC EFFECTS OBSERVED WAVE MODEL PREDICTIONS
3. The photoelectrons are emitted
IMMEDIATELY the metal is exposed to
light above the cut off frequency.
3. Because of the nature of the energy
delivery process, electrons should take
SOME TIME to build enough energy to
be ejected. A TIME DELAY should exist.
2. The KEmax of the ejected
photoelectrons is INDEPENDENT
of the INTENSITY of the incident
light, but DEPENDENT on the
FREQUENCY of that light.
2. The energy of the light beam is
completely described by its INTENSITY,
so the KEMAX of the ejected
photoelectrons should be INDEPENDENT
of Frequency.
These anomalies between the observed and predicted results meant the death of the wave
theory as a complete explanation for light behaviour. A new theory was required.
1. The energy of the light beam
arrives uniformly and continuously at
the metal surface. If the intensity
increases, the energy available to the
electrons increases, so KEMAX of the
ejected electrons should also
increase.
1. Below a certain frequency,
different for different metals, NO
photoelectrons are observed, no
matter how INTENSE the light.
44. Light & Matter Revision
Question Type: Photoelectric effect
The students use a light source that
emits a large range of frequencies.
They use filters which allow only
certain frequencies from the source
to shine onto the plate. Most of the
students filters produce frequencies
below the cut-off frequency.
Alice says that if they increase the
intensity of light, these frequencies
below the cut-off
frequency will be able to produce
emitted photoelectrons.
They experiment and find Alice is
incorrect.
Q25: Comment whether this
experimental evidence supports
the wave like or the particle-like
theory of light.
The experimental evidence supported
the particle theory.
The wave theory predicts that
photoelectrons would be emitted at
any frequency if the intensity was
sufficient.
the particle theory, the energy of the
photons is related to the frequency,
not the intensity, so there would be
no electrons emitted below the
threshold frequency.
45. 3.10 The Photoelectric Effect (9)
Individual Photon
Light beam
Light Beams can be
regarded as a series of
photons radiating out
from the source.
As mentioned previously it
was in 1905 that Einstein
proposed that light travels
as a series of discrete units
or particles or “quanta”
which he called “photons”
and each carried a discrete
amount of energy
dependent upon the light’s
frequency. (ie E = hf).
Photons are neither
waves nor particles,
having properties
similar to particles when
travelling through a
vacuum and when in a
gravitational field, while
also having properties
similar to waves when
refracting and
interfering.
Photons can be
visualised as a series of
individual particles each
of which displays some
wave like properties.
46. 3.11 Practical Applications
The photoelectric effect has
practical applications in many
areas:
Solar Cells
Night Vision Goggles
Spacecraft
The photoelectric effect will cause
spacecraft exposed to sunlight to
develop a positive charge.
This can get up to the tens of volts.
This can be a major problem, as
other parts of the spacecraft in
shadow develop a negative charge
(up to several kilovolts) from
nearby plasma, and the imbalance
can discharge through delicate
electrical components.
47. Chapter 4
Topics covered:
• Investigating the Electron
• Electrons and Matter as Waves.
• Electron Interference
• Electron Diffraction
• Electrons and X Rays
• Photon Momentum.
• Photons as Waves.
48. 4.0 Investigating the Electron
• The electron is the smallest of the 3
fundamental particles which make
up all atoms.
• It carries the basic unit of electric
charge (1.6 x 10⁻¹⁹
C)
• It has a mass of 9.1 x 10⁻³¹
kg
• When in an atom, the electron
circulates around the nucleus BUT
only in certain allowed positions or
orbits.
• This restriction on position means
that electrons are behaving more like
waves than the particles we know
them to be.
• It was not until the development of
“Quantum Mechanics” that the
problem of restricted position was
satisfactorily explained.
• Electrons are stripped from atoms
and then used as individual
particles in many applications.
• One important application is in
Cathode Ray Tubes - the basis for
Cathode Ray Oscilloscopes
(CRO’s), T.V. and non LCD video
display units.
• These devices rely on a stream of
“energetic” electrons, which are
“boiled off” a hot wire filament.
• Their energy is then increased by
being accelerated through a large
Voltage.
• Their trajectory can be manipulated
by using magnetic or electric fields.
49. 4.1 Electrons and Matter as Waves
• DeBroglie suggested that matter (with
mass, m, moving with velocity, v), will
have a wavelength (called the DeBroglie
wavelength) associated with its motion.
• This wavelength is calculated from the
momentum equation:
λ = h/p = h/mv
where λ = DeBroglie wavelength (m)
h = Planck’s Constant
p = Particle Momentum
(kgms-1
) m = Mass (kg)
v = Velocity (ms-1
)
A racing car, mass 800 kg, travelling at
200 kmh-1
(55.6 ms-1
) has a DeBroglie
wavelength of:
λ = h/p = h/mv
= 6.63 x 10⁻³⁴
/(800)(55.6)
= 1.5 x 10-38
m
An indescribably small number. Too
small to measure or even notice.
An electron of mass 9.1 x 10⁻³¹
kg travelling
at 1.4 x 10⁴
ms-1
has a DeBroglie wavelength
of:
λ = h/p = h/mv
= 6.63 x 10⁻³⁴
/(9.1 x 10-31
)(1.4 x 10⁴
)
= 5.2 x 10⁻⁸
m
A measurable quantity, so electrons are
able to display wave like properties like
interference and diffraction.
v
In 1924 French Physicist
Louis DeBroglie suggested
that “the universe is
symmetrical” so, if radiation (light)
displayed both particle and wave
like properties simultaneously,
matter should also display similar
behaviours.
50. Light & Matter Revision
Question Type:
A sketch of a cathode ray tube (CRT) is
shown in Figure 5. In this device, electrons
of mass 9.10 × 10⁻³¹
kg are
accelerated to a velocity of 2.0 × 10⁷
m s-1
. A
fine wire mesh in which the gap between the
wires is w = 0.50 mm
has been placed in the path of the electrons,
and the pattern produced is observed on the
fluorescent screen.
Q26: Calculate the de Broglie
wavelength of the electrons. You
must show your working.
λ= h/mv
the de Broglie wavelength was
found to be 3.64 x 10⁻¹¹
m.
De Broglie Wavelength
Q27: Explain, with reasons,
whether or not the students
would observe an electron
diffraction pattern on the
fluorescent screen due to the
presence of the mesh.
For diffraction, the gap width
must be the same order of
magnitude as the wavelength.
Since the wavelength was much
smaller than the gap, no
diffraction pattern would be
observed.
51. Light & Matter Revision
Question Type:
Neutrons are subatomic particles and, like electrons, can
exhibit both particle-like and wave-like behaviour.
A nuclear reactor can be used to produce a beam of
neutrons, which can then be used in experiments.
The neutron has a mass of 1.67 × 10⁻²⁷
kg.
The neutrons have a de Broglie wavelength of 2.0 × 10⁻¹⁰
m.
Q28: Calculate the speed of the neutrons.
Q29: The neutron beam is projected onto a
metal crystal with interatomic spacing of 3.0 ×
10-10
m.
Would you expect to observe a diffraction
pattern? Explain your answer.
λ= h/mv gives
2.0 × 10³
ms–1
(or 1985 ms–1
)
There would be a diffraction pattern because
the wavelength is of the same order of
magnitude as the interatomic spacing.
De Broglie Wavelength
52. 3.11 Practical Applications
The photoelectric effect has
practical applications in many
areas:
Solar Cells
Night Vision Goggles
Spacecraft
The photoelectric effect will cause
spacecraft exposed to sunlight to
develop a positive charge.
This can get up to the tens of volts.
This can be a major problem, as
other parts of the spacecraft in
shadow develop a negative charge
(up to several kilovolts) from
nearby plasma, and the imbalance
can discharge through delicate
electrical components.
53. 4.2 Electron Interference
The now familiar Young’s
double slit experiment is
performed with the light
source replaced by an
“electron gun” which fires
a single electron at a time.
8 electrons 270 electrons
2000 electrons 6000. electrons
Initially, with only small
numbers, electrons arrive
at the screen in a random
fashion.
. ...
.
Even as the numbers reach
the thousands still nothing
unusual appears on the
screen.
However as the numbers
climb past 5000 the familiar
light and dark bands begin
to appear
The total exposure time
from picture (a) to the
picture (d) was 20 min.
This result shows
particles (in this case
electrons) can display
wave like properties.
54. 4.3 Electron Diffraction
Just as waves diffract
when hitting a solid
object so electrons
can diffract from a
well-ordered
arrangement of atoms
on the surface of a
sample.
Electrons which have been
accelerated through a potential
of 30 to 500 volts (i.e., have
K.E.’s of 30 to 500 eV), have a
de Broglie wavelength between
2.2 x 10⁻¹⁰
m and 0.5 x 10⁻¹⁰
m.
This fits nicely into the range of
distances between atoms in
solids and can therefore
strongly diffract from them.
The arrangement of the
spots is interpreted to
provide information about
the ordered arrangement of
atoms on the surface and
the distances between the
spots gives information on
the distance between the
atoms.
Platinum Sample
e-
energy = 65 eV
55. Light & Matter Revision
Question Type:
A beam of electrons, pass through two
very thin slits (approximately 10-10
m)
and are detected on a electron detector
screen as shown in Figure 5.
Q30: Explain whether the
particle model or the wave
model best explains the
expected observations from
this experiment.
Electron Diffraction
The wave model best explains
this.
The wave model is better:
Interference pattern (a wave
phenomenon) will be
observed.
The Particle model would not
predict the interference
pattern, rather two zones
where the electrons would
strike the screen.
56. 4.4 Electrons and X Rays
High energy
electron beam
Al foil
Diffraction
Pattern
A high energy electron
beam is fired at an
Aluminium target
X Ray Beam
When the electron beam is
replaced with an X Ray
beam a somewhat similar
diffraction is produced
The distance between the bright lines in
both patterns is the same, meaning the
wavelengths of both beams was the same.The diffraction pattern
shown is produced.
Hence if λX Ray is known, then the De
Broglie wavelength of the electrons is
also known.
57. Light & Matter Revision
Question Type:
A beam of X-rays, wavelength λ = 250
pm (250 × 10-12
m), is directed onto a
thin aluminium foil as shown in Figure
4a. The X-rays scatter from the foil onto
the photographic film.
Q31 : Calculate the energy, in
keV, of these X-rays.
E=hc/λ
= (4.14 x 10⁻¹⁵)(3.0 x 10⁸
)/ 250 x 10-12
)
= 4.97 x 10³
ev
= 4.97 keV or 5.0 keV
X ray Energy
58. After the X-rays pass through the foil,
a diffraction pattern is formed as
shown in Figure 4b.
In a later experiment, the X-rays are
replaced with a beam of energetic
electrons. Again, a diffraction pattern
is observed which is very similar to
the X-ray diffraction pattern. This is
shown in Figure 4c.
Light & Matter Revision
Question Type: X ray Diffraction
Electrons have a de Broglie
wavelength which was the same
(or very similar) to the wavelength
of the X-rays.
Q32: Explain why the electrons
produce a diffraction pattern similar
to that of the X-rays.
Q33: Assuming the two diffraction
patterns are identical, estimate the
momentum of the electrons. Include
the unit.
p = h / λ
= (6.63 x 10⁻³⁴)/(250 x 10-12
)
= 2.7 x 10⁻²⁴
kgms-1
The diffraction pattern were the
same, so the wavelength of the
electrons must equal that of the X-
rays.
59. Light & Matter Revision
Question Type:
In 1927, G.I. Thomson fired a beam of
electrons through a very thin metal foil
and the emerging electrons formed
circular patterns, similar to the pattern
obtained when the exercise was repeated
with a beam of X-rays. The following
diagram shows a comparison of the
patterns obtained.
Q34: How does this evidence support the
concept of matter waves?
Q35: If the X-rays have frequency of
1.5 x 10¹⁹
Hz, what is the wavelength
of the electrons?
Q36: What is the momentum of an X-
ray photon?
The circular pattern is a diffraction
pattern. With X-rays, the bright lines
represent regions of constructive
interference alternating with regions of
destructive interference.
The corresponding electron pattern
shows similar diffraction properties
which suggests electrons have wave
properties, as diffraction is a wave
phenomenon.
X ray & electron Diffraction
λ = c/f = 3.0 x 10⁸
/1.5 x 1019
= 2.0 x 10⁻¹¹
m
p = h/λ = 6.63 x 10⁻³⁴
/2.0 x 10-11
= 3.3 x 10⁻²³
kgms-1
60. 4.5 Evidence for Photons as Waves
Young’s double slit experiment is
well known as evidence for the wave
like nature of light.
This experiment creates difficulties
for the particle (photon) model.
How can individual photons, which
must pass through one or other of
the slits, interact with themselves to
produce an interference pattern ?
When the experiment is carried out
at extremely low light intensities, it
is found that, for a while, no
interference pattern is noticed.
However, as time passes the
number of photons arriving at the
screen builds and an interference
pattern does emerge with more
photons going to the areas of
bright bands and less to areas of
dark bands.
It appears trying to predict the fate of
individual photons is not possible,
but as their numbers build the wave
model allows the prediction of their
average behaviour with great
accuracy.
Thus photons (en masse) can display
wave like properties although they
are generally regarded as discrete,
individual particles.
61. 4.6 Photon Momentum
• When a light beam strikes a surface, the
individual photons will transfer MOMENTUM
as they are absorbed or reflected and so will
exert a pressure on that surface.
• The size of the MOMENTUM can be
calculated from
p = E/c …………(1)
where, p = Photon Momentum (kgms-1
)
E = Photon Energy (J or eV)
c = Speed of Light (ms-1
)
• Using Photon Energy, E = hf, Equation 1 can
be rewritten as:
p = hf/c …………(2)
• Using the Wave Equation, c = fλ
• Equation 2 can be rewritten as:
p = hf/f λ
p = h/λ
62. Light & Matter Revision
Question Type:
A monochromatic violet light of wavelength
390 nm is emitted by a light source with a
power of 200 Watt.
Q37: How many photons leave this
light source in a 10 second interval?
p = h/λ = 1.7 x 10⁻²⁷
kgms-1
Q38: What is the momentum of
each of these photons?
P = W/t = E/t E = Pt = (200)(10)
= 2000 J
Each photon has Energy = hc/λ =
= (6.63 x 10⁻³⁴
)(3.0 x 10⁸
)/(390 x 10-9
)
= 5.1 x 10⁻¹⁹
J
No of photons in 2000 J = 2000/(5.1 x 10-19
)
= 3.92 x 10²¹
Photon energy
63. Chapter 5
• Topics covered:
• Quantised Energy Levels for Atoms.
• Emission Spectra
• Absorption Spectra
• Solar Spectrum.
• Quantised Energy Levels
• Wave Particle Duality.
64. 5.0 Quantised Energy
Levels for Atoms
• The Bohr model for the atom,
restricting electrons to
certain regions or orbits with
fixed energy levels, worked
well in describing atomic
structure and behaviour.
• But it was not until DeBroglie
suggested electrons had a
wavelength, was there a
satisfactory explanation of
why fixed orbits and energies
existed.
• DeBroglie suggested that for
an electron to survive in an
orbit, it must form a standing
wave which represents a
stable state for the electron.
• Only certain radius orbits
allow the standing wave to be
set up, so electrons can only
exist certain regions.
Allowed Orbit
Disallowed orbit
The 1st
five
electron shells
with their standing
waves
65. 5.1 Emission Line Spectra
Sodium Emission Spectra
When atoms of substances are exposed to
certain kinds of energy sources, the
electrons surrounding the nucleus can
gain energy and move up to higher energy
levels, called “excited states”.
The energy absorbed corresponds
to jumps between the fixed energy
levels of the electron shells within
the atom
The excited electrons
return to their ground
state by emitting a
photon of a certain
frequency (colour)
The emitted photons from all electrons transitions
form “a picture” called an “Emission Spectrum”.
These Spectra are unique to each element and
are used to identify unknowns in a field called
spectroscopy.
Helium Emission Spectra
66. Light & Matter Revision
Question Type:
i Continuous (or broad)
ii Discrete (or individual lines)
A class looks at spectra from two
sources.
i. an incandescent light globe
ii. a mercury vapour lamp
They observe that the spectra are
of different types.
Q39: State the type of spectrum
seen from each source.
i. Incandescent light globe
ii. Mercury vapour lamp
Emission Spectra
Q40: State the electron mechanism,
in each of the sources below, that
produces each spectrum.
i. Incandescent light globe
ii. Mercury vapour lamp
i Thermal motion of free electrons
ii Energy transition of bound electrons
67. 5.2 Absorption Line Spectra
If you look at the spectrum
from a common incandescent
light bulb, you'll see a
relatively smooth spectrum
with no part being brighter or
darker than any other part.
This type of a spectrum is
called a continuous spectrum.
Electrons in an atom can jump between
discreet energy levels by absorbing a
photon.
So certain atoms under certain
conditions will absorb very specific
wavelengths of light dependent on the
configuration of their electrons.
This will remove energy and leave blank
spaces (dark lines) in the spectrum.
An emission spectrum is simply the
reverse of an absorption spectrum.
The pattern of absorption lines in
a spectrum will be unique to a
chemical element so we can use
absorption lines to detect the
presence of specific elements in
astronomical objects.
68. Light & Matter Revision
Question Type:
Figure 5a shows part of the emission
spectrum of hydrogen in more detail.
With a spectroscope, Val examines the
spectrum of light from the sun. The
spectrum is continuous, with colours
ranging from red to violet. However
there were black lines in the spectrum,
as shown in Figure 5b.
Q41: Explain why these dark lines are
present in the spectrum from the sun.
The dark lines exist because photons are
absorbed which correspond to the energy
levels in hydrogen. This indicates the
presence of hydrogen.
Absorption Spectra
69. 5.3 The Solar Spectrum
In 1802 English chemist William Wollaston was
the first to note the appearance of a number of
dark lines in the solar spectrum.
It was later discovered that each
chemical element was
associated with a set of spectral
lines, and that the dark lines in
the solar spectrum were caused
by absorption by those elements
in the upper layers of the sun.
Some of the observed features
are also caused by absorption in
oxygen molecules in Earth’s
atmosphere.
Solar Spectrum When the “White Light” arriving at
the Earth’s surface is passed
through a prism, it is broken up into
its constituent colours.
This produces the “solar spectrum”
In 1814, Joseph Von Fraunhofer
independently rediscovered the
lines and began a systematic
study and careful measurement of
the wavelength of these features.
In all, he mapped over 570 lines.
70. 5.4 Quantised Energy Levels
Mercury Energy Levels
Ground State
n = 10 eV
n = 24.9 eV
n = 36.7 eV
8.8 eV n = 4
n = 510.4 eV
Ionisation
The Ground State (n = 1)
represents the lowest electron
energy level
States n = 2 to n = 5 represent
allowed energy levels for
electrons in Mercury atoms.
Electrons absorbing more than 10.4 eV of
energy from a photon collision will be
stripped completely from the Mercury
atom leaving it ionised
Electrons in excited state n = 3 can
return to the ground state by:
1. Emitting a single 6. 7 eV photon
OR
2. By emitting a 1.8 eV photon
followed by a 4.9 eV photon
Electrons surrounding the nucleus
can “jump” up and down between
allowed energy levels by absorbing
or emitting a photon.
The ABSORPTION and EMISSION
SPECTRA for atoms show the
energy values associated with the
“jumps”.
The energy is associated with
these “jumps” is given by E = hf
where
E = Energy of the emitted photon
for a downward jump OR the
energy absorbed from an incident
photon for an upward jump. (eV)
h = Planck’s Constant
f = Frequency of Photon
(Hz)
71. Light & Matter Revision
Question Type:
The spectrum of photons emitted by
excited atoms is being investigated.
Shown in Figure 6 is the atomic energy
level diagram of the particular atom
being studied. Although most of the
atoms are in the ground state, some
atoms are known to be in n = 2 and n =
3 excited states.
Q42: What is the lowest energy
photon that could be emitted
from the excited atoms?
The smallest energy gap was
that from n = 3 to n = 2, an
energy difference of 1.8 eV.
Energy Levels
Q43: Calculate the wavelength of
the photon emitted when the atom
changes from the n = 2 state to the
ground state (n = 1).
Data: h = 4.14 × 10⁻¹⁵
eV s ,
c = 3.0 × 10⁸
m s-1
The energy of the photon was 3.4 eV.
By substituting this into the equation
E =hc/λ,
the wavelength was 3.65 x 10⁻⁷
m.
72. Light & Matter Revision
Question Type:
Figure 2 shows the energy levels
of a sodium atom. A sodium atom is initially in an n = 4
excited state.
Q44: Calculate the highest frequency
of light that this sodium atom could
emit.
ΔE = 3.61 = h f
Hence f = 8.7 x 10¹⁴
Hz
Energy Levels
Figure 2 shows that electrons in a
sodium atom can only occupy specific
energy levels.
Q45: Describe how the wave nature of
electrons can explain this.
Electrons have an equivalent or de
Broglie wavelength.
Only orbits of an integral number of
wavelengths are allowed as these
will form a standing wave
73. Light & Matter Revision
Question Type:
Part of the visible region of the
spectrum of light emitted from excited
hydrogen gas has three lines as shown
in Figure 3.
The energy level diagram for the
hydrogen atom is shown in Figure 4.
The binding energy is 13.6 eV.
Q46: What is the energy of the
photons with a wavelength 434.1
nm in Figure 3?
E = hc/λ
= 2.86 eV
Q47: A different photon has an energy
of 3.0 eV.
On Figure 4 indicate with an arrow the
electron transition that leads to
emission of a photon of light with this
energy.
Energy Level Diagrams
74. 5.5 The Wave - Particle Duality
• As you can see from what has been
presented, attempting to
characterise light as only wave like
or only particle like in nature has
failed.
• In fact, as of today, light (and matter)
are regarded as some part particle
like and some part wave like in
nature.
• This conflict is summarised in the
use of the term “wave-particle
duality” to describe light’s known
behaviour.
• This is an unsatisfactory situation,
as it defies our need for simple all
encompassing explanations for the
behaviours we observe around us
and in the universe.
• It would appear, at this stage, we
have not yet unravelled all the details
of the behaviour of light and matter.
BUT THIS IS WHAT PHYSICS IS ALL
ABOUT –
PUSHING THE ENVELOPE –
EXPLORING THE UNKNOWN –
TRYING TO FIT RATIONAL AND LOGICAL
EXPLANATIONS TO THAT WHICH HAS
BEEN OBSERVED.