Downloaded 102 times
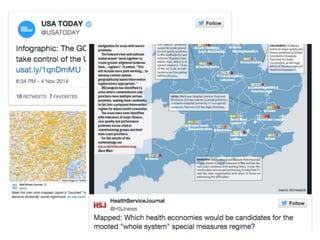
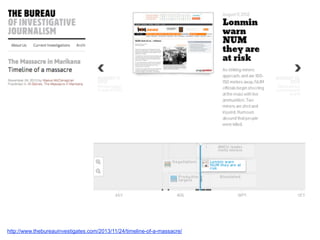
![The maps provided something
that the narrative and
statistics lacked,
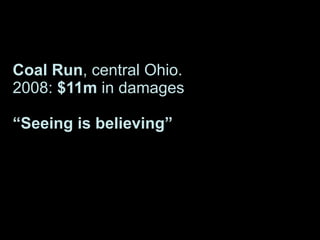
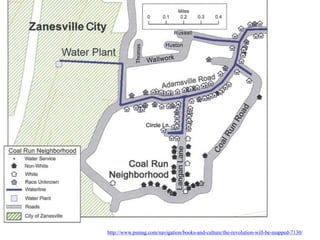
says civil rights attorney Reed
Colfax. “We could articulate
the case in words. But when
you’d put up the maps,
they’d stop listening to you
and look at them [as if to]
say, ‘Is this really possible?’”
http://www.psmag.com/navigation/books-and-culture/the-revolution-will-be-mapped-7130/](https://image.slidesharecdn.com/datavisedinburgh12-150401084208-conversion-gate01/85/Visual-storytelling-6-320.jpg)


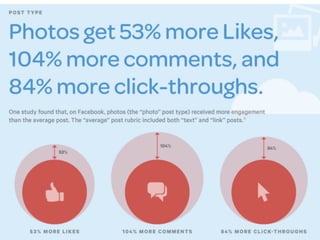


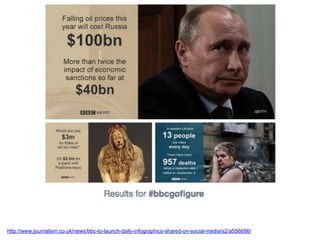
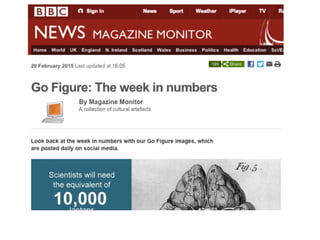
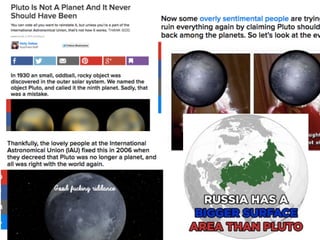
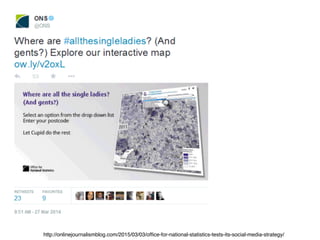
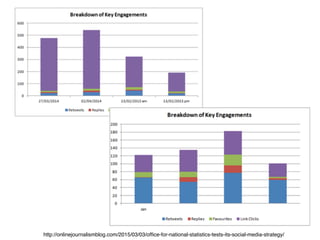
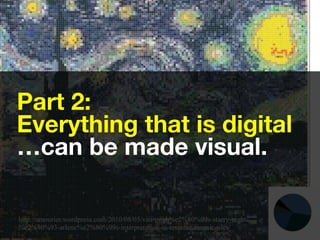


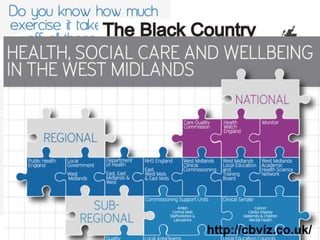
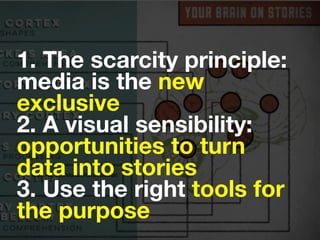

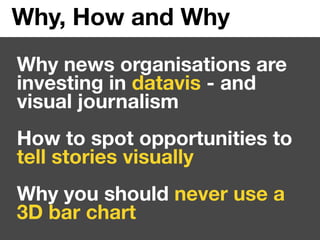
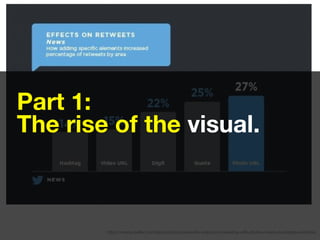
News organizations are increasingly investing in visual journalism and data visualization because it improves engagement with audiences. Visuals like photos and videos perform particularly well on social media in boosting shares. When telling stories about issues like civil rights cases, maps and data visualizations can help illustrate complex topics in a way that resonates more with audiences. As digital media has grown, there are more opportunities to take any type of data or information and present it visually through tools like infographics, charts, and timelines. The rise of visual storytelling across news and online media has led journalists to find new ways to activate audiences and illustrate stories through visual methods.