Datavis: 3 things you need to know (Data4Good 2018)
1.
@PaulBradshaw, Birmingham CityUniversity, BBC
Author: Scraping for Journalists, Finding Stories in Spreadsheets, Data
Journalism Heist, Online Journalism Handbook
Datavis: 3 things you
need to know
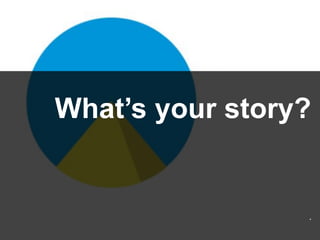
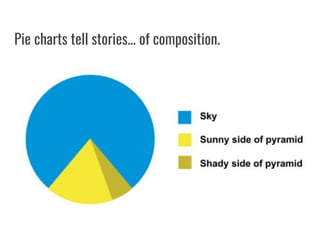
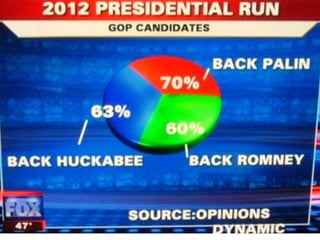
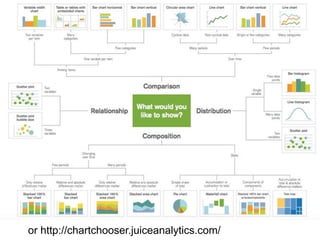
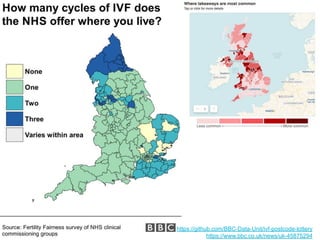
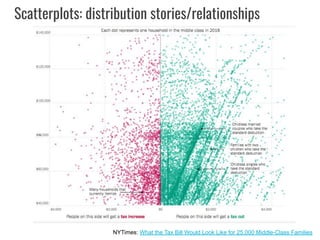
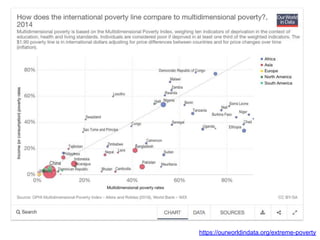
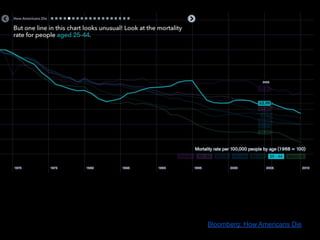
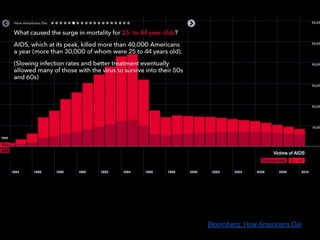
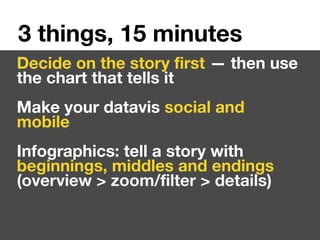
Decide on thestory first — then use
the chart that tells it
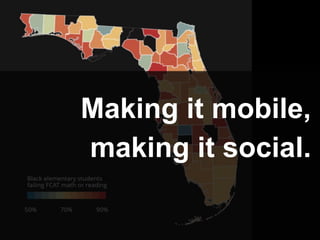
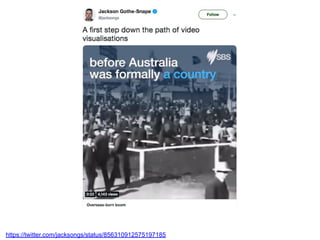
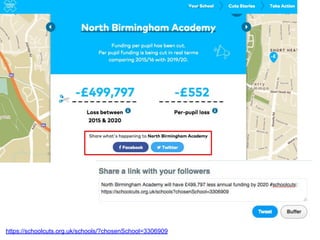
Make your datavis social and
mobile
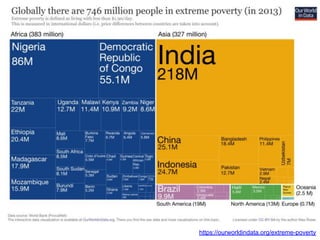
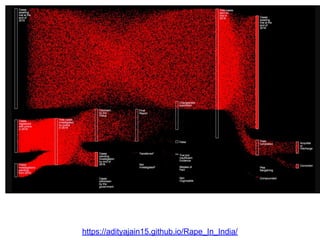
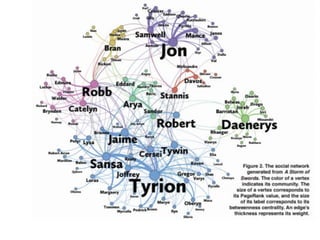
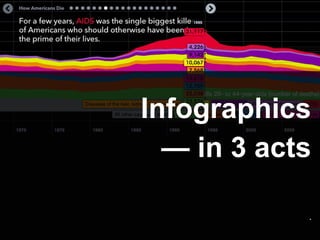
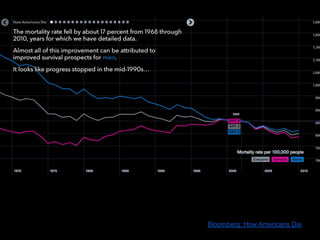
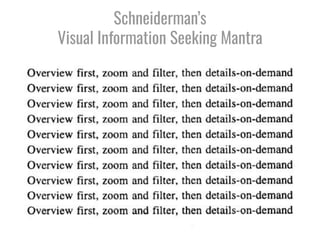
Infographics: tell a story with
beginnings, middles and endings
(overview > zoom/filter > details)
3 things, 15 minutes
40.
@PaulBradshaw, Birmingham CityUniversity, BBC
Author: Scraping for Journalists, Finding Stories in Spreadsheets, Data
Journalism Heist, Online Journalism Handbook
paulonhismobile@
gmail.com
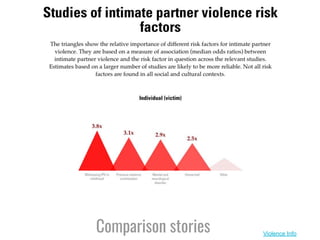
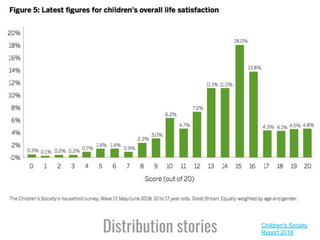
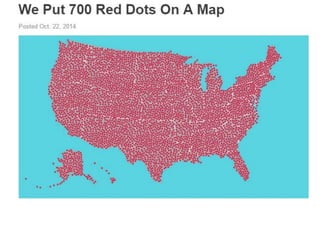
The stories thatcharts can (and
can’t) tell
Being social and mobile
Infographics in 3 acts
3 things in 15 minutes
43.
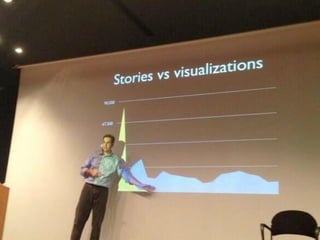
Start with theobjective
● Insight (better service, comms)
● Distribution (bigger audiences)
● Clarity (understanding)
● Engagement and stickiness (depth)
● Branding (relationships)
45.
“Having a simpledata
vis on the page
increases dwell time by
a third”
Trinity Mirror
46.
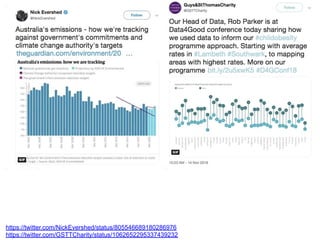
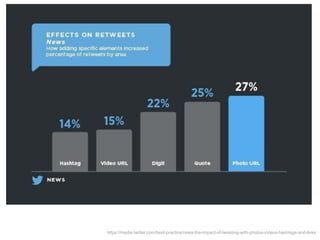
“Photos give thebiggest lift with
quotes coming in a close second.
Tweets containing numbers, a video url and hashtags also lead to double-digit boost.”
https://media.twitter.com/best-practice/news-the-impact-of-tweeting-with-photos-videos-hashtags-and-links


![[DSC Europe 23] Miodrag Markovic - Data Journalism.pdf](https://cdn.slidesharecdn.com/ss_thumbnails/dsceurope23miodragmarkovic-datajournalism-231128225800-405b73be-thumbnail.jpg?width=640&height=640&fit=bounds)


