Downloaded 83 times
![Innovative Interfaces Transforming data into insight Eva Kaniasty [email_address] May 2008](https://image.slidesharecdn.com/kaniastyinnovativeinterfaces-1212086950487516-8/75/Innovative-Interfaces-Transforming-Data-Into-Insight-1-2048.jpg)
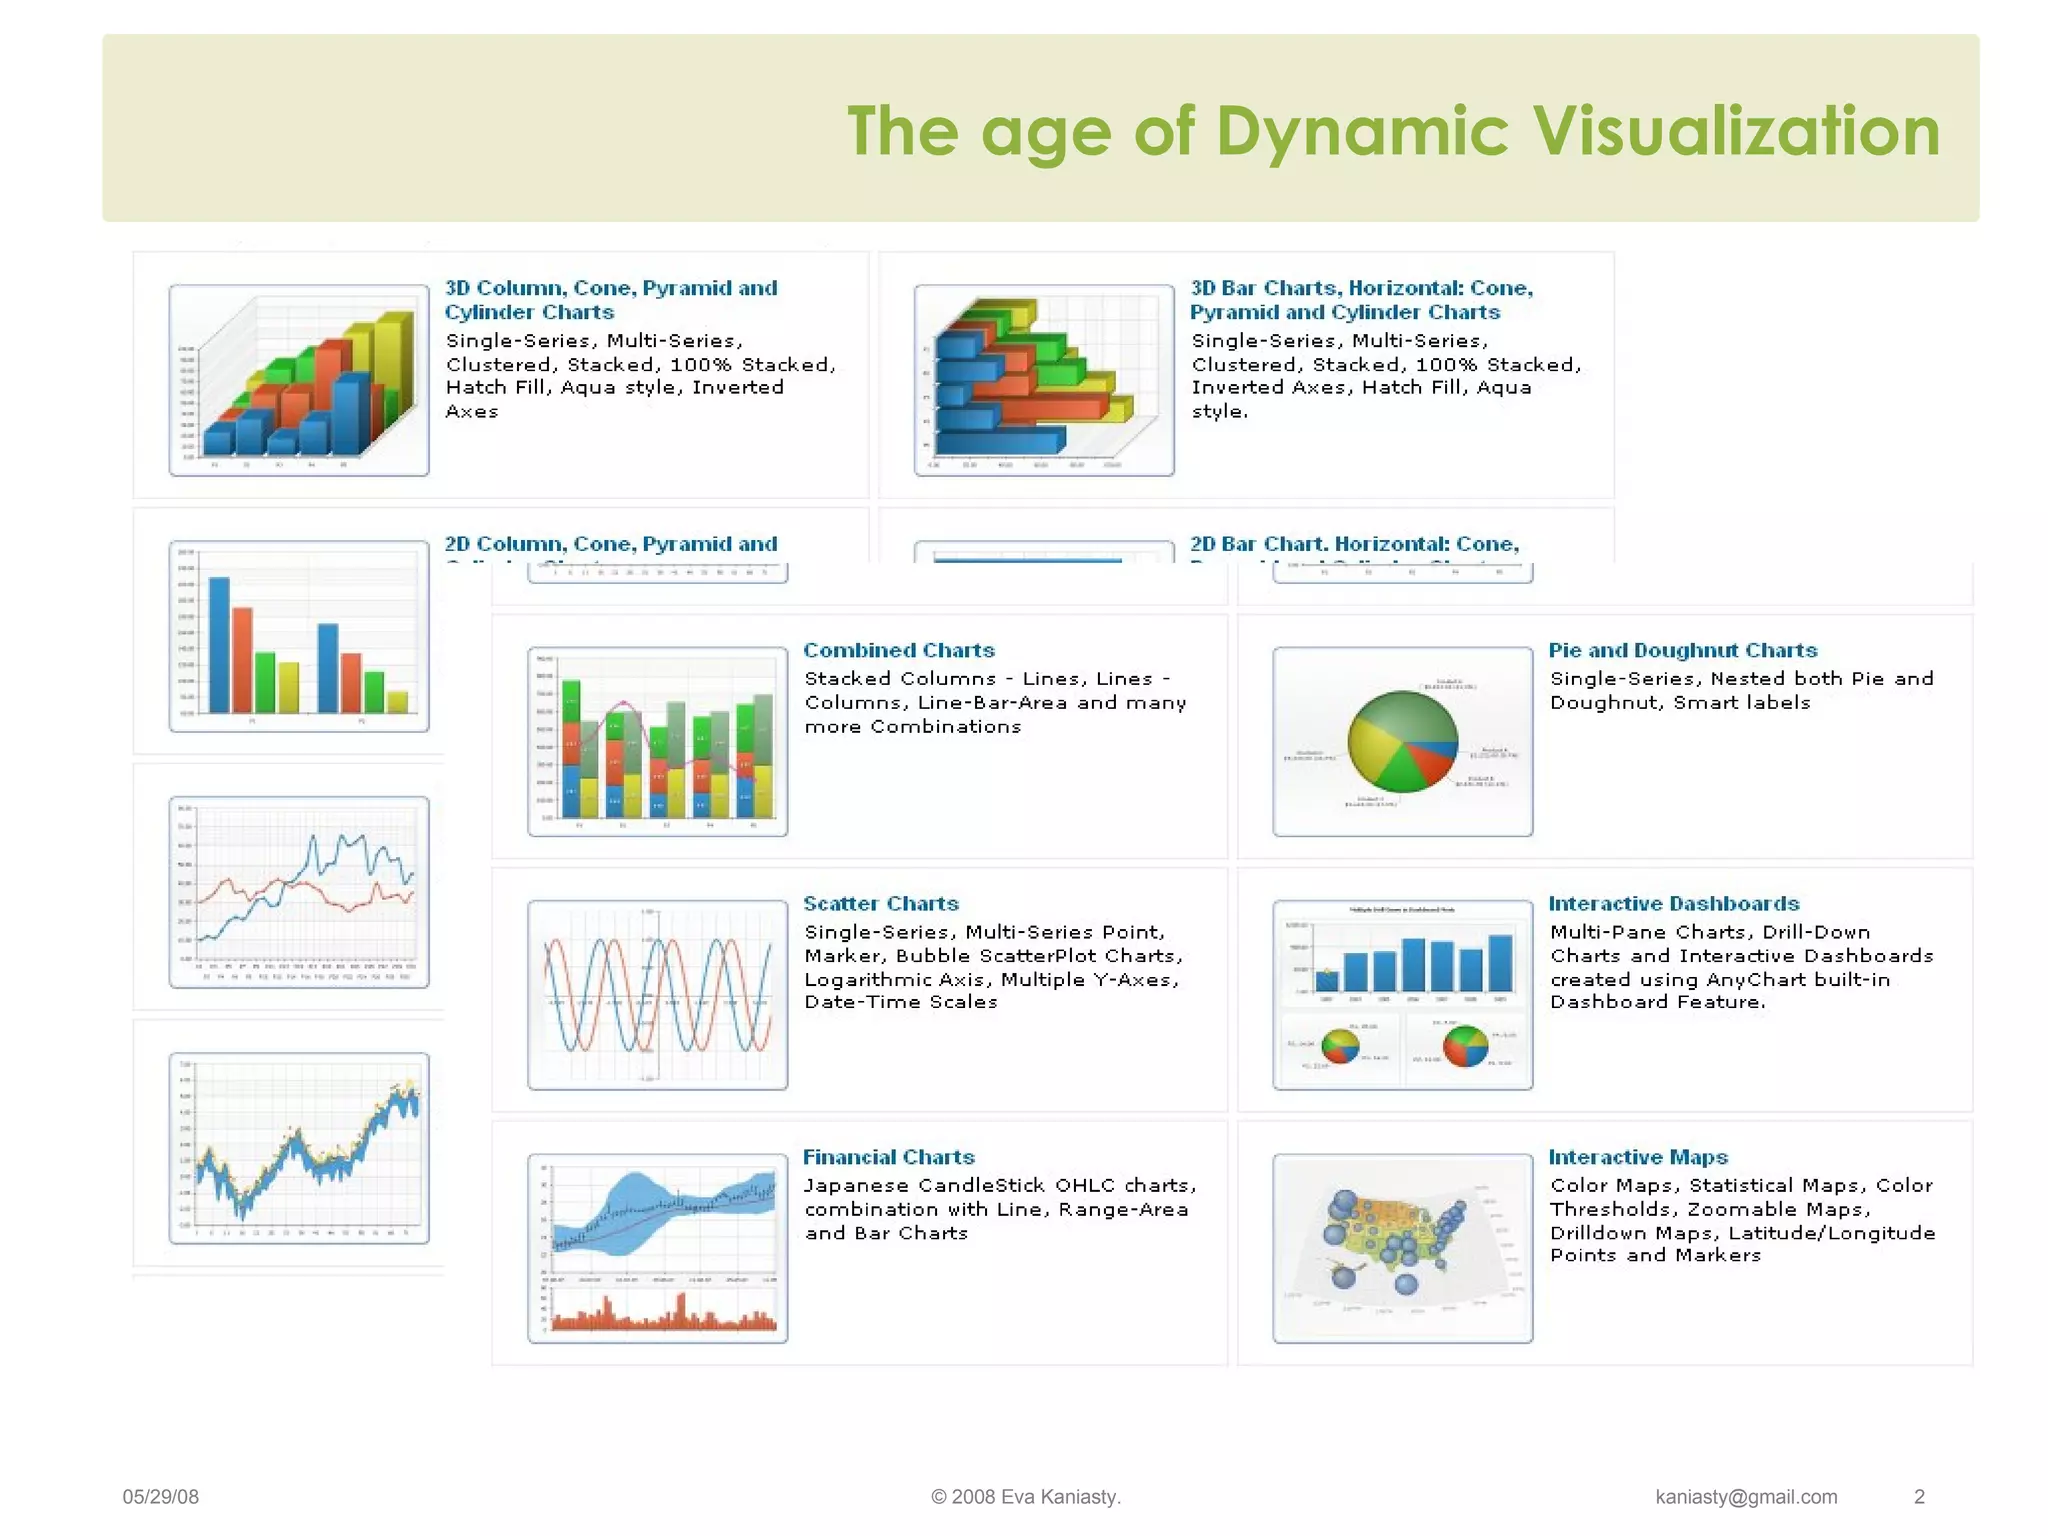
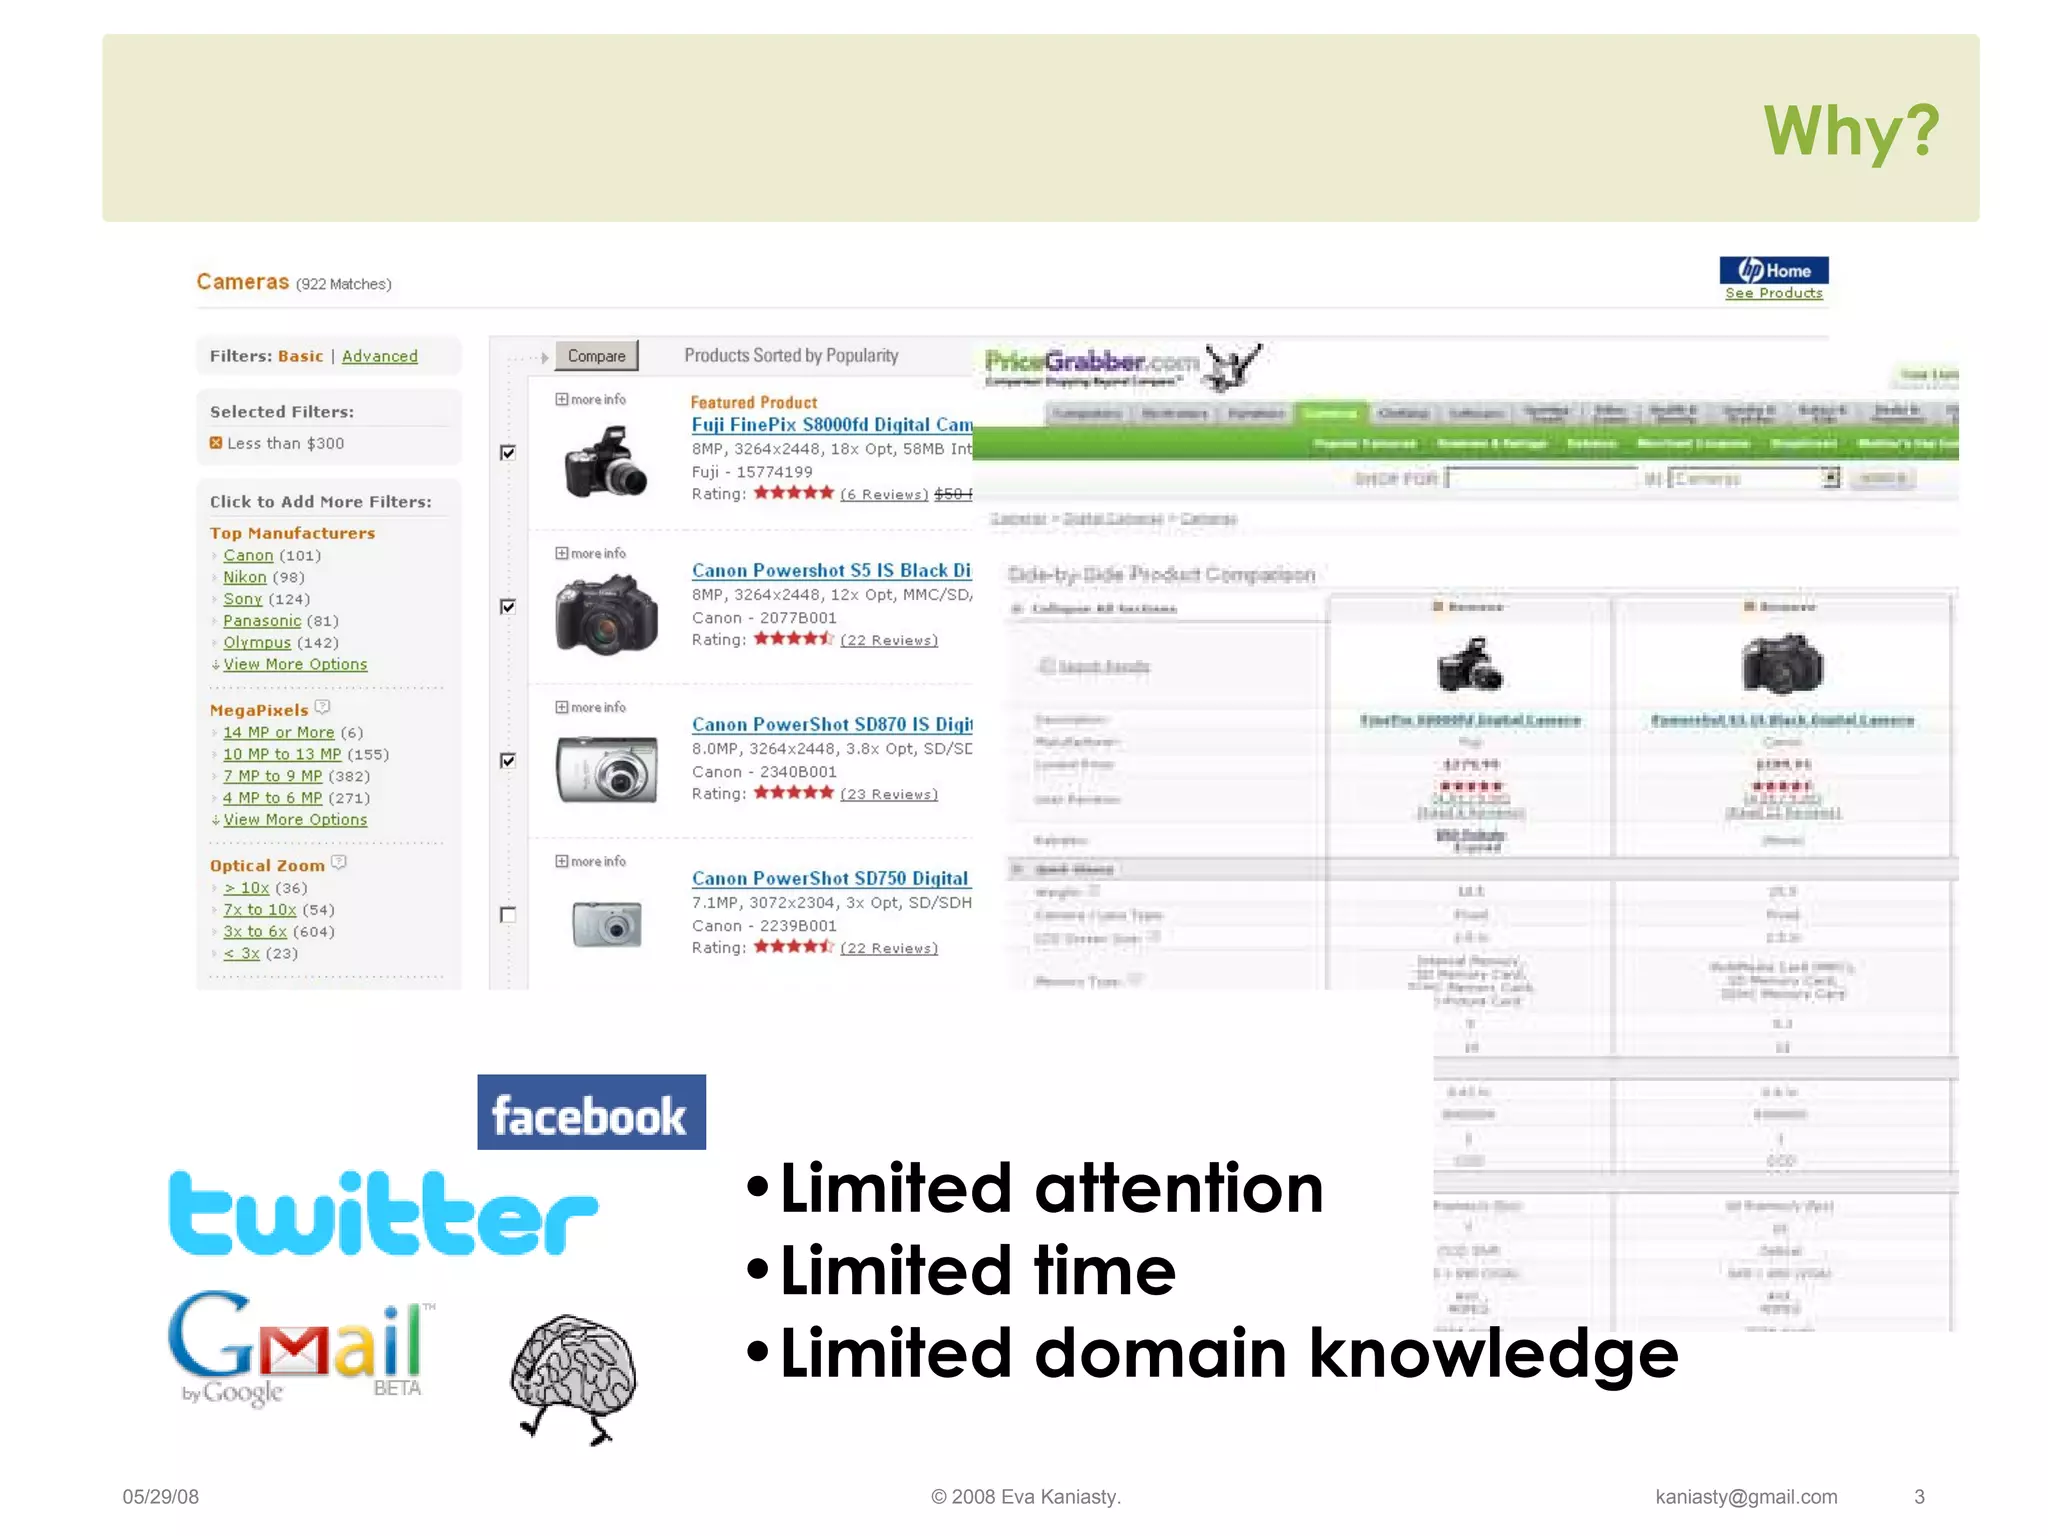
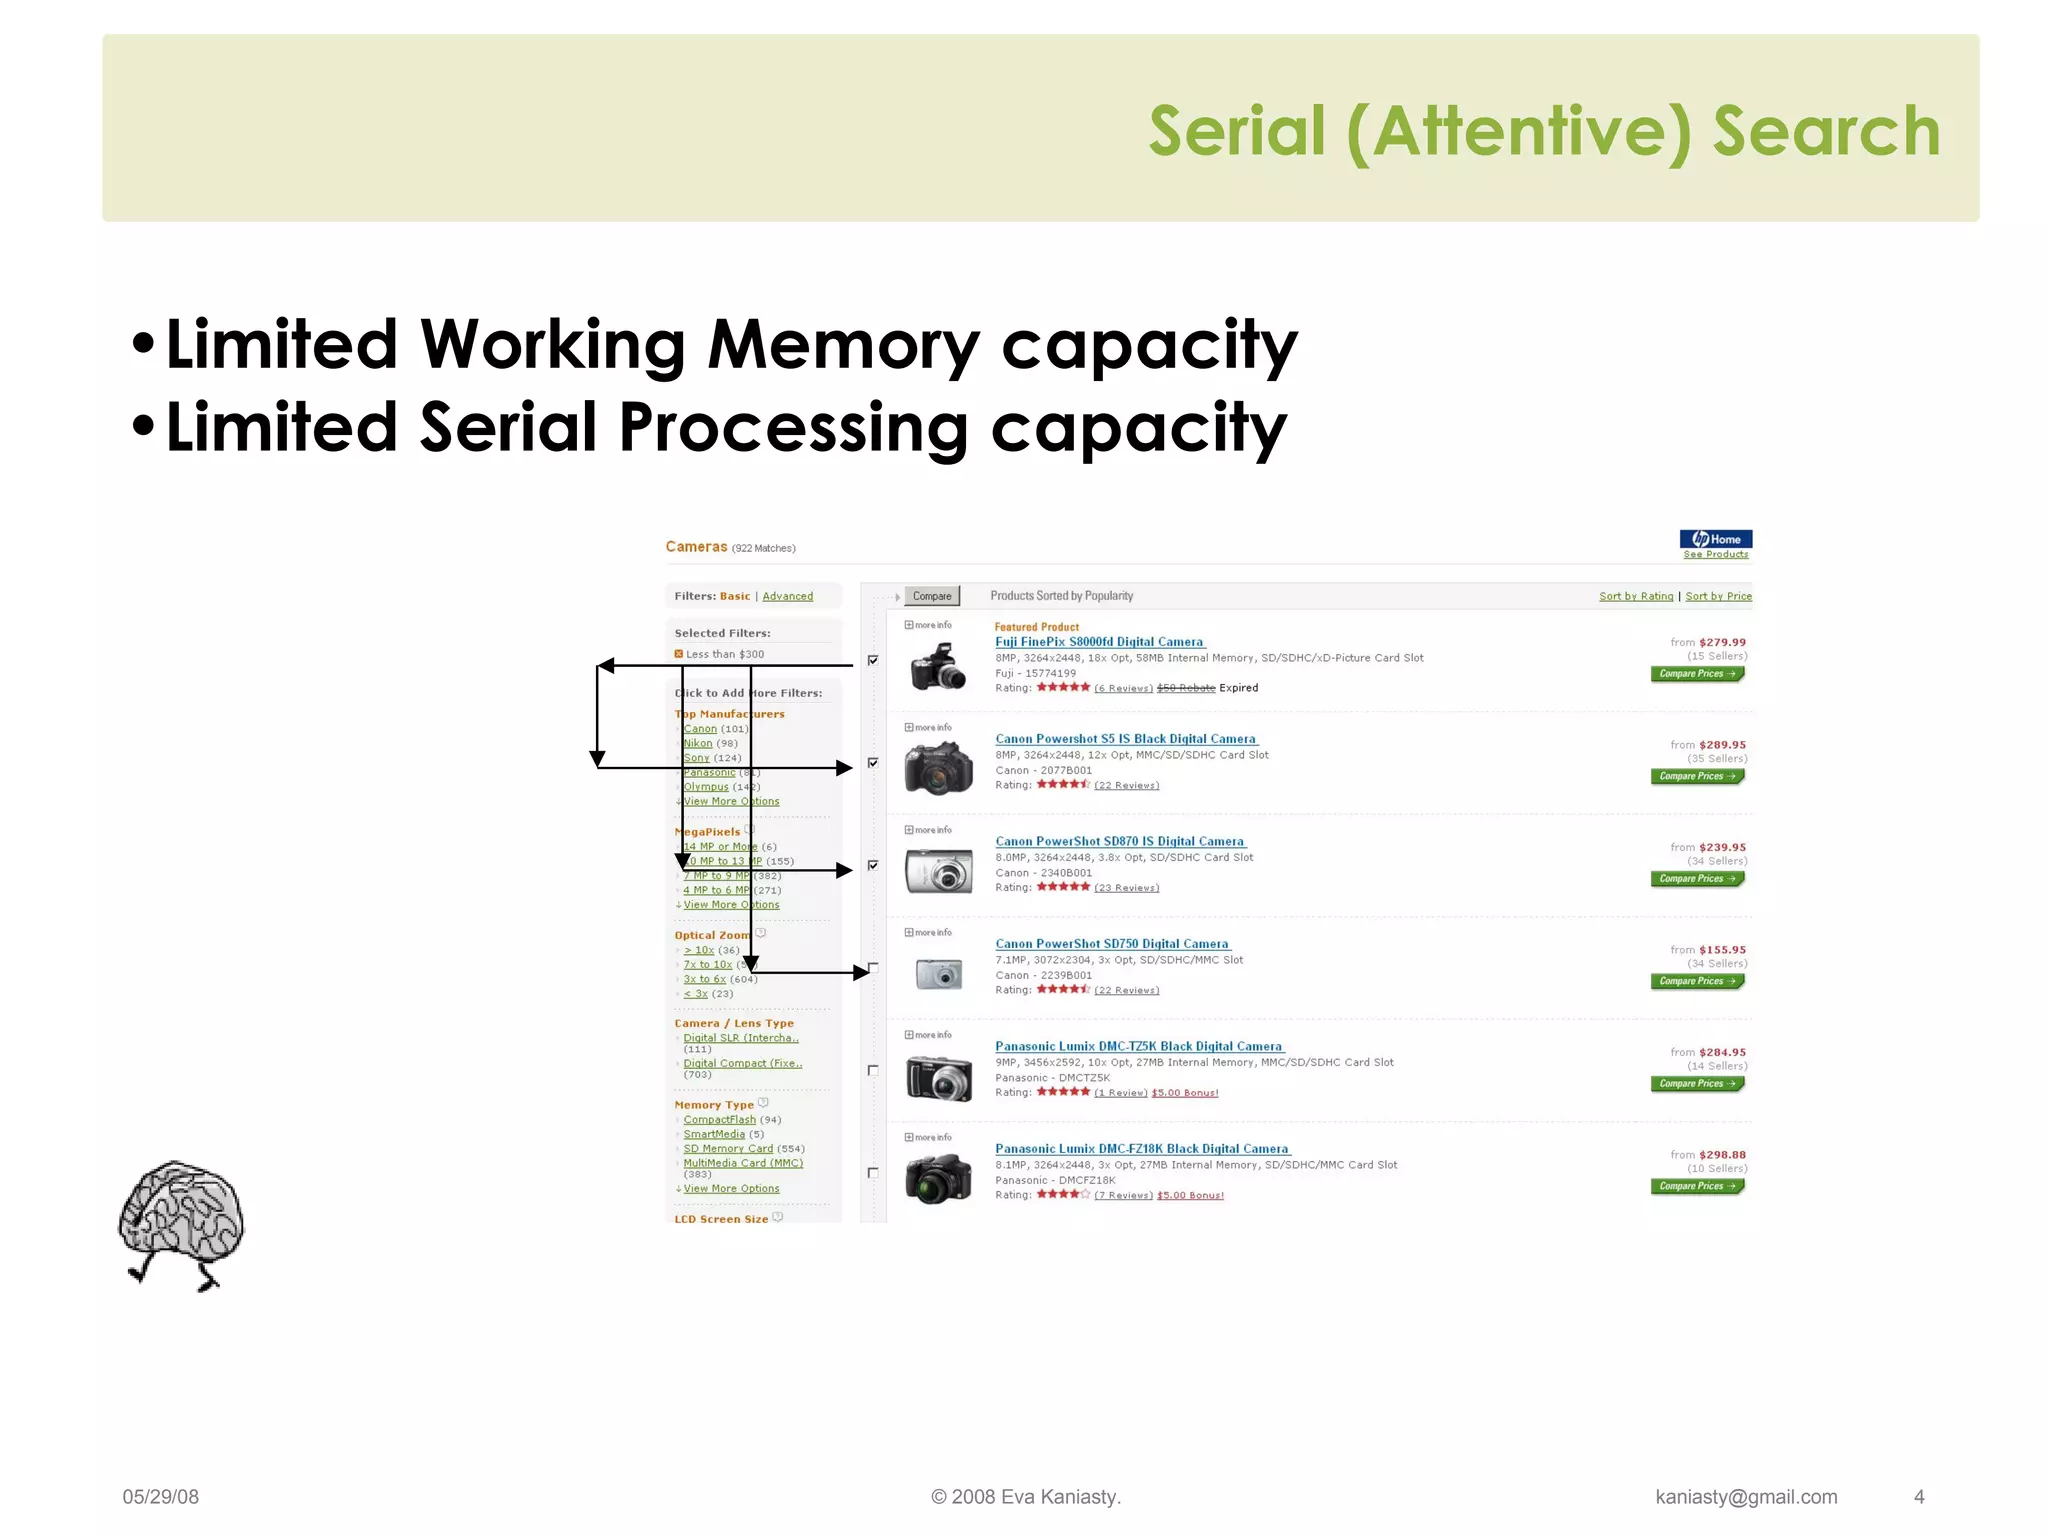
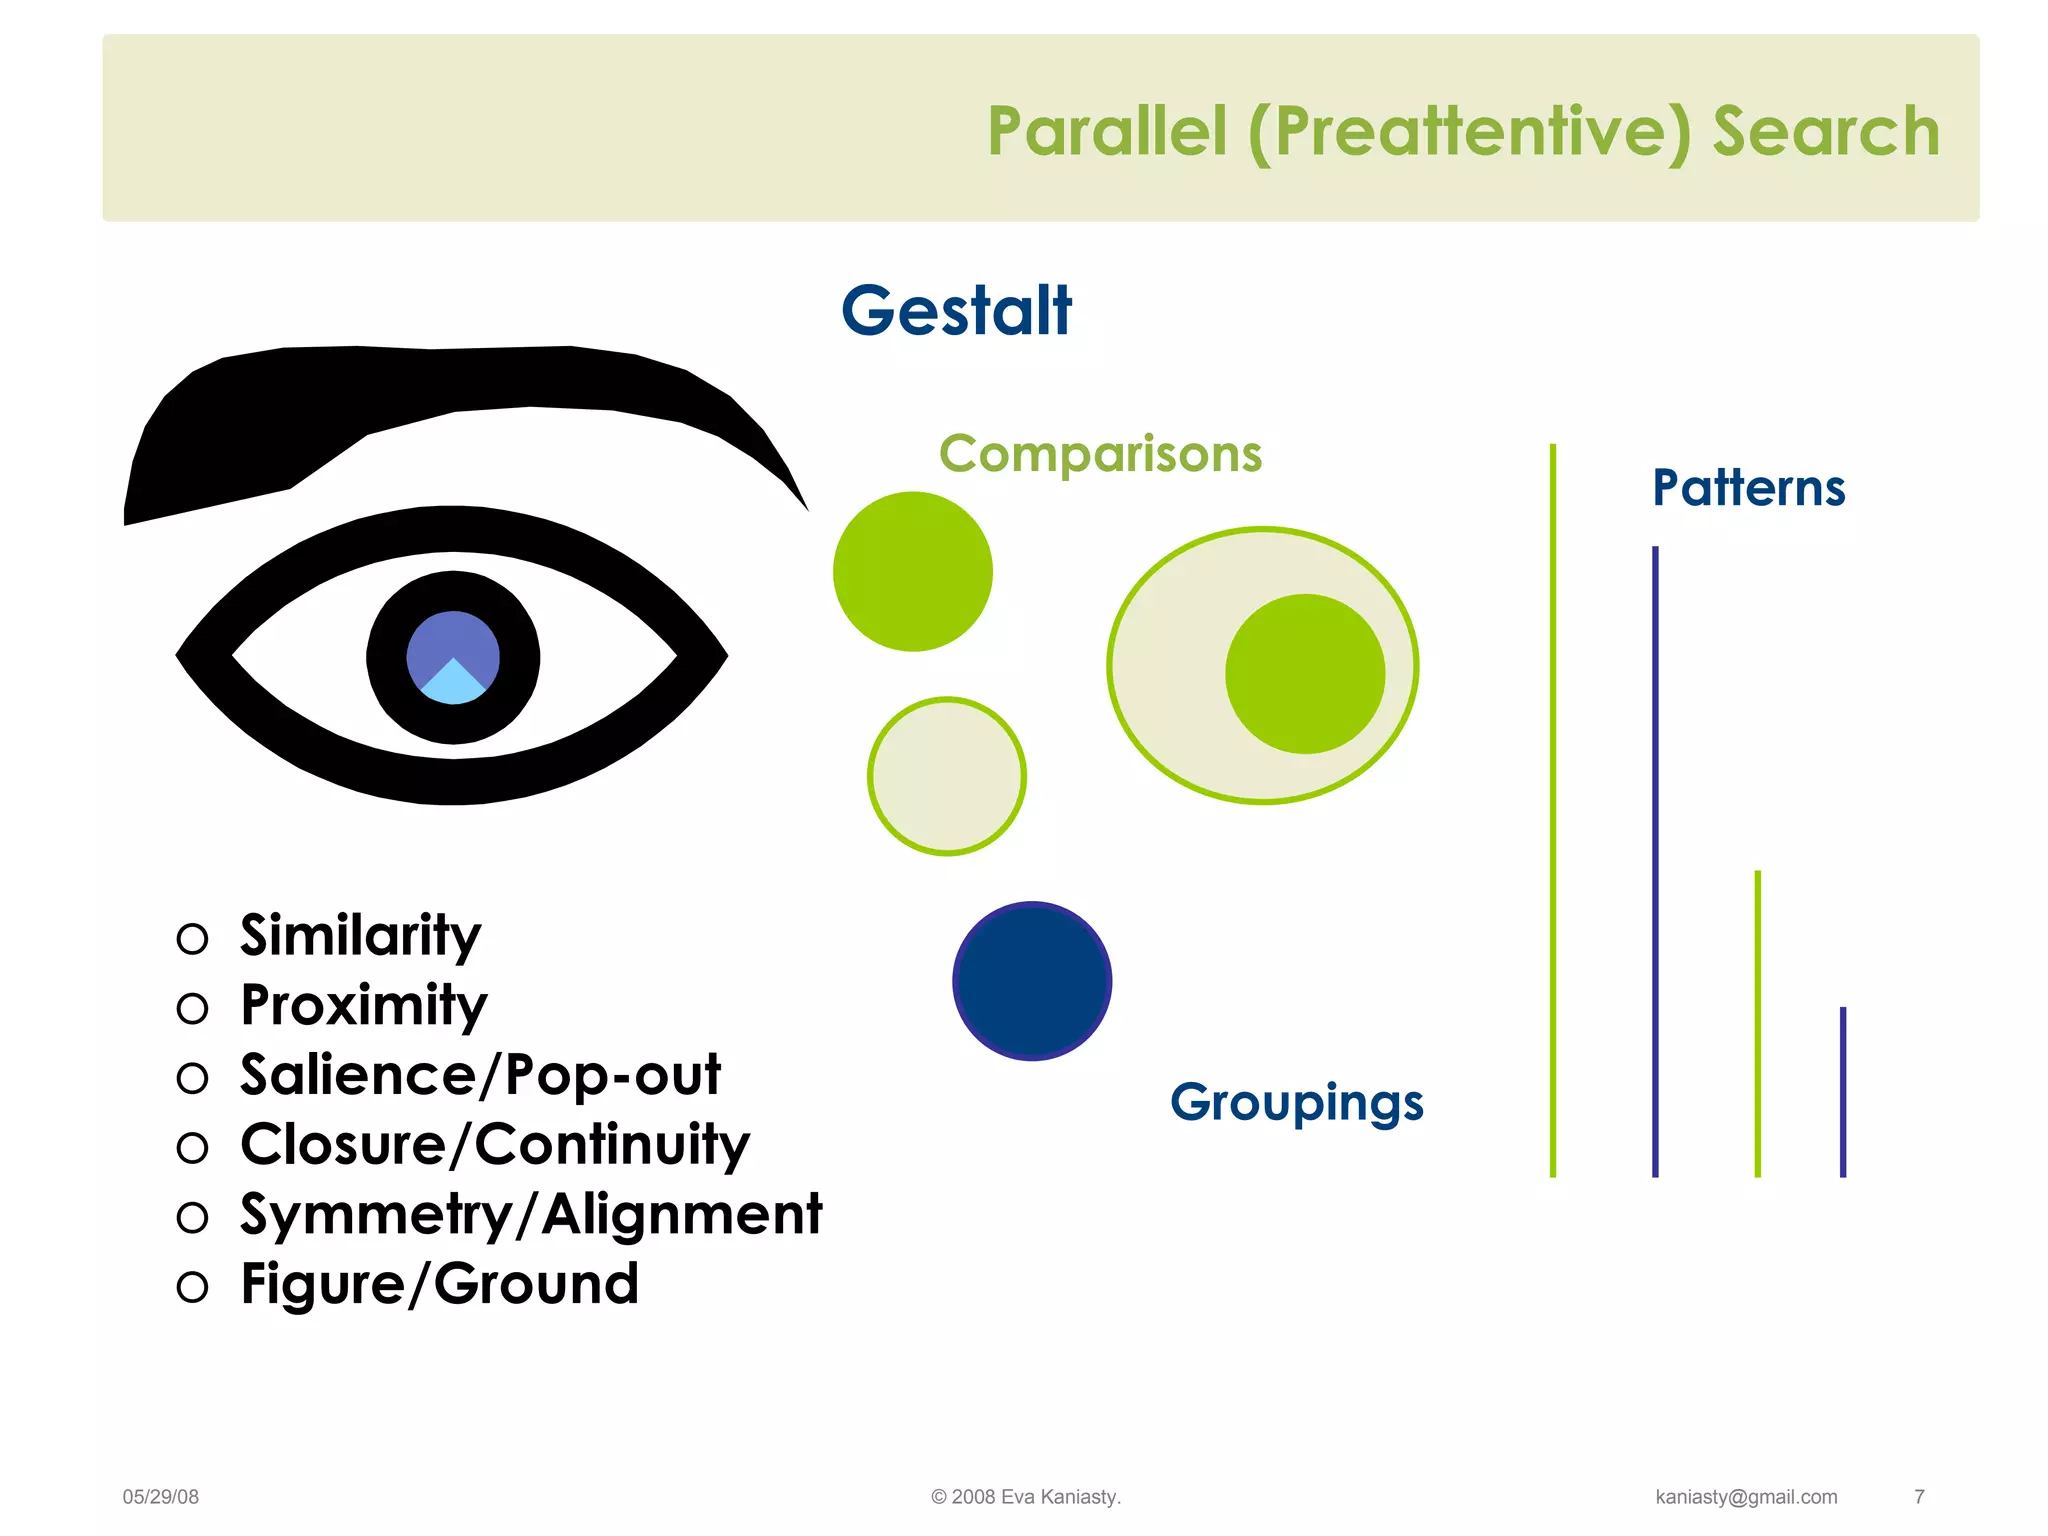
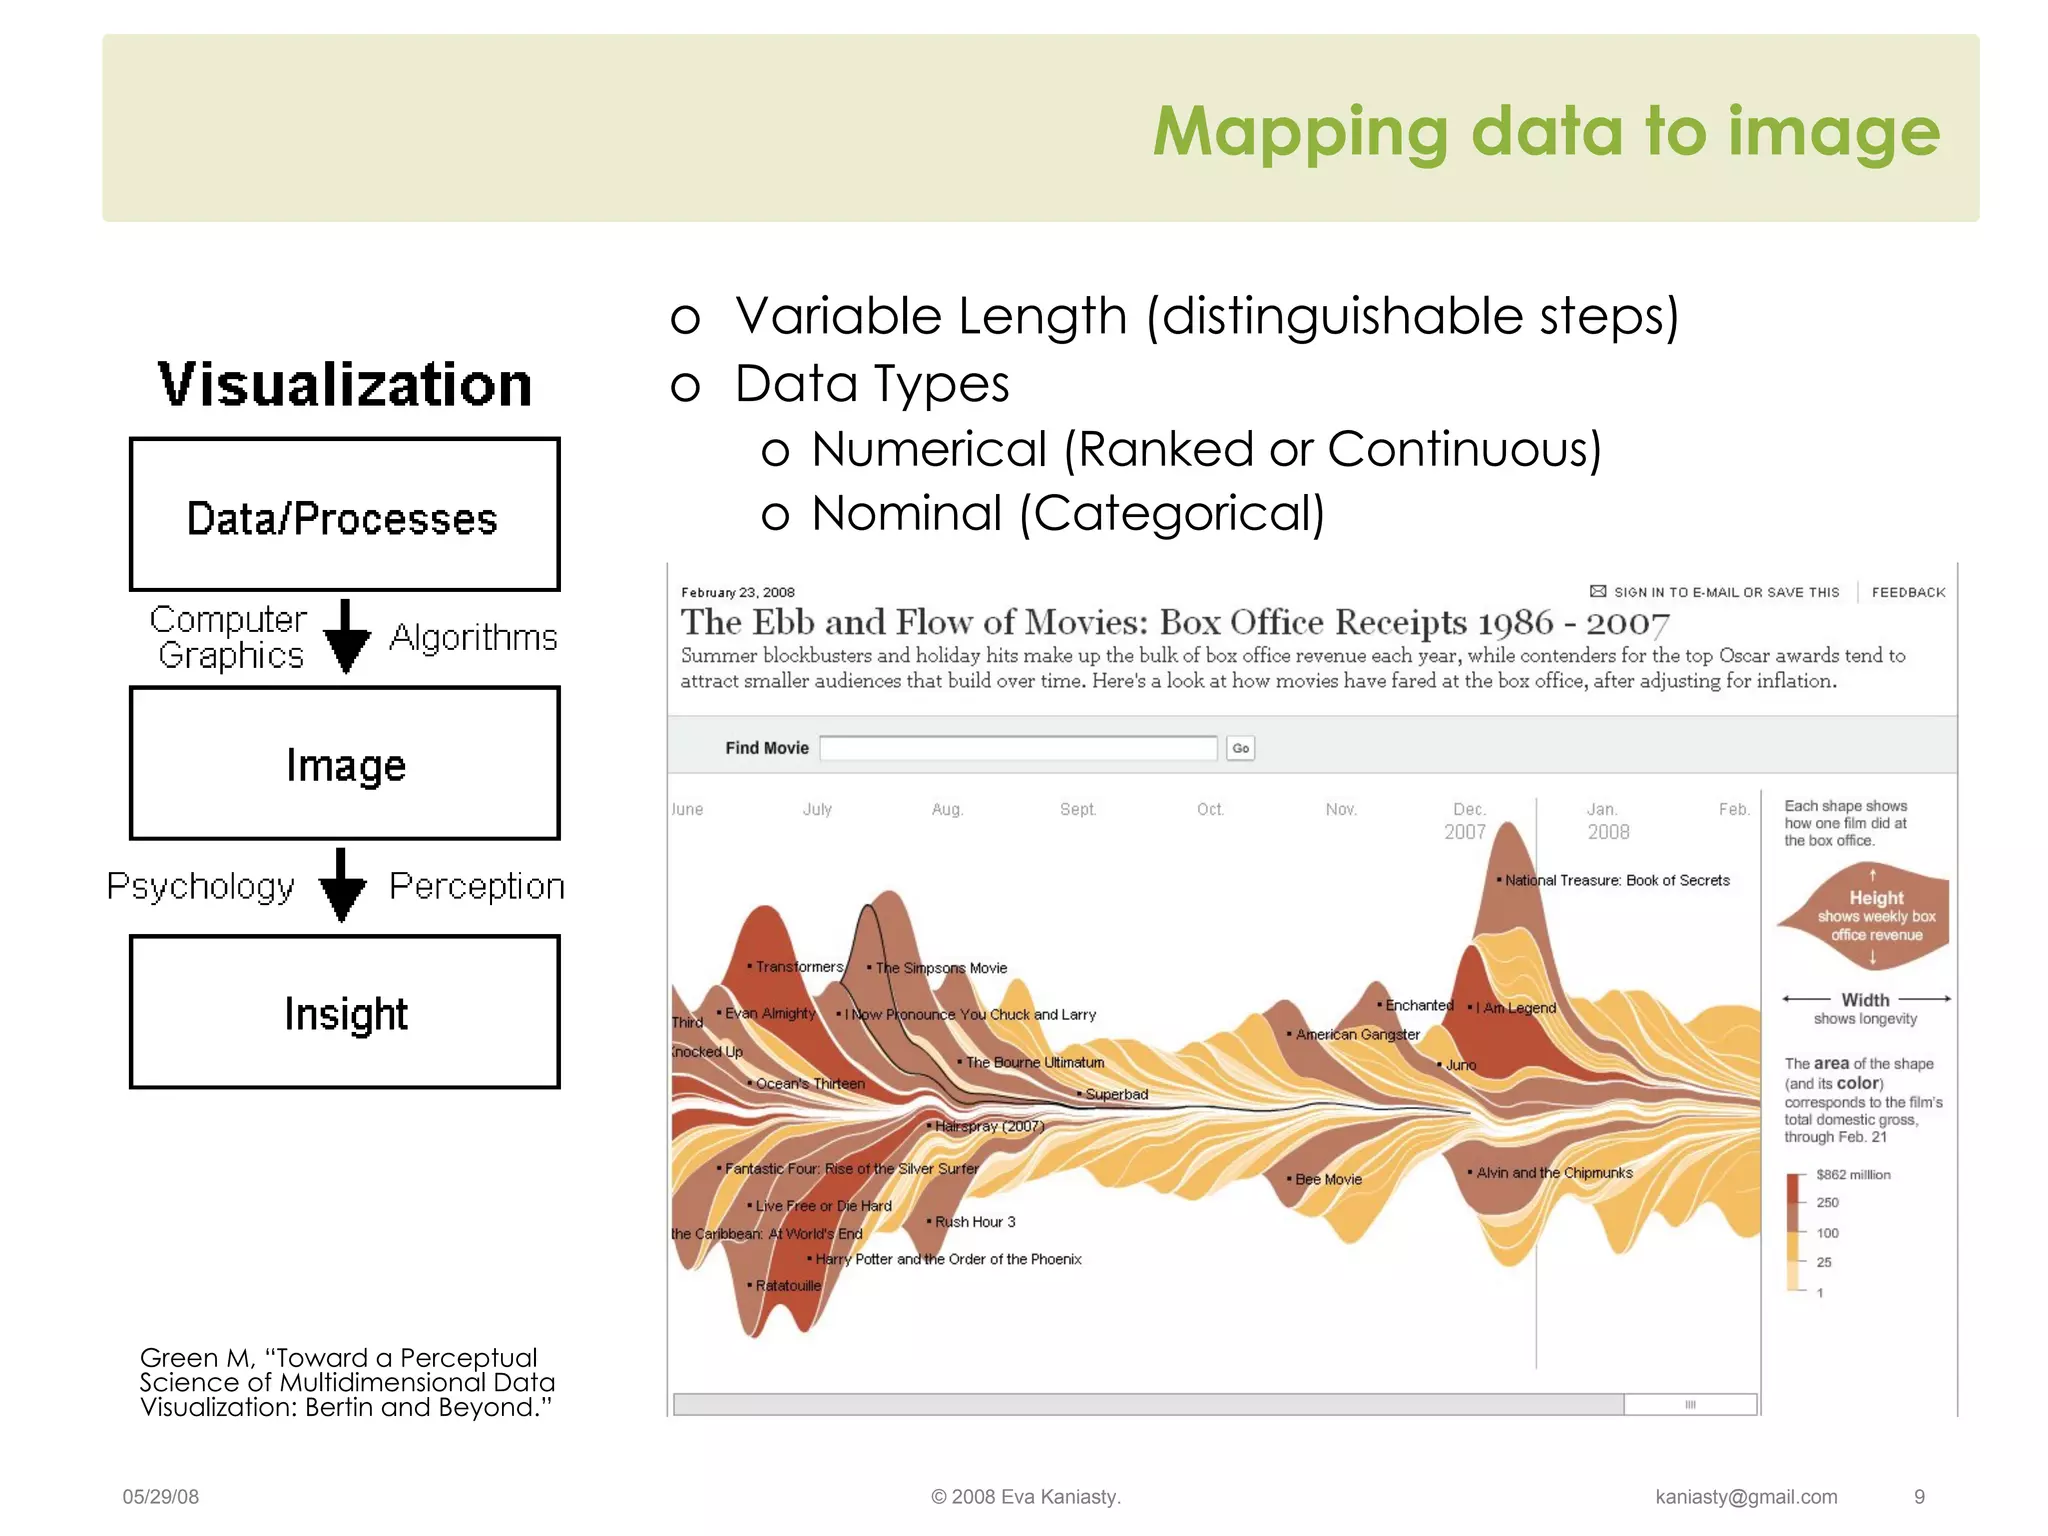
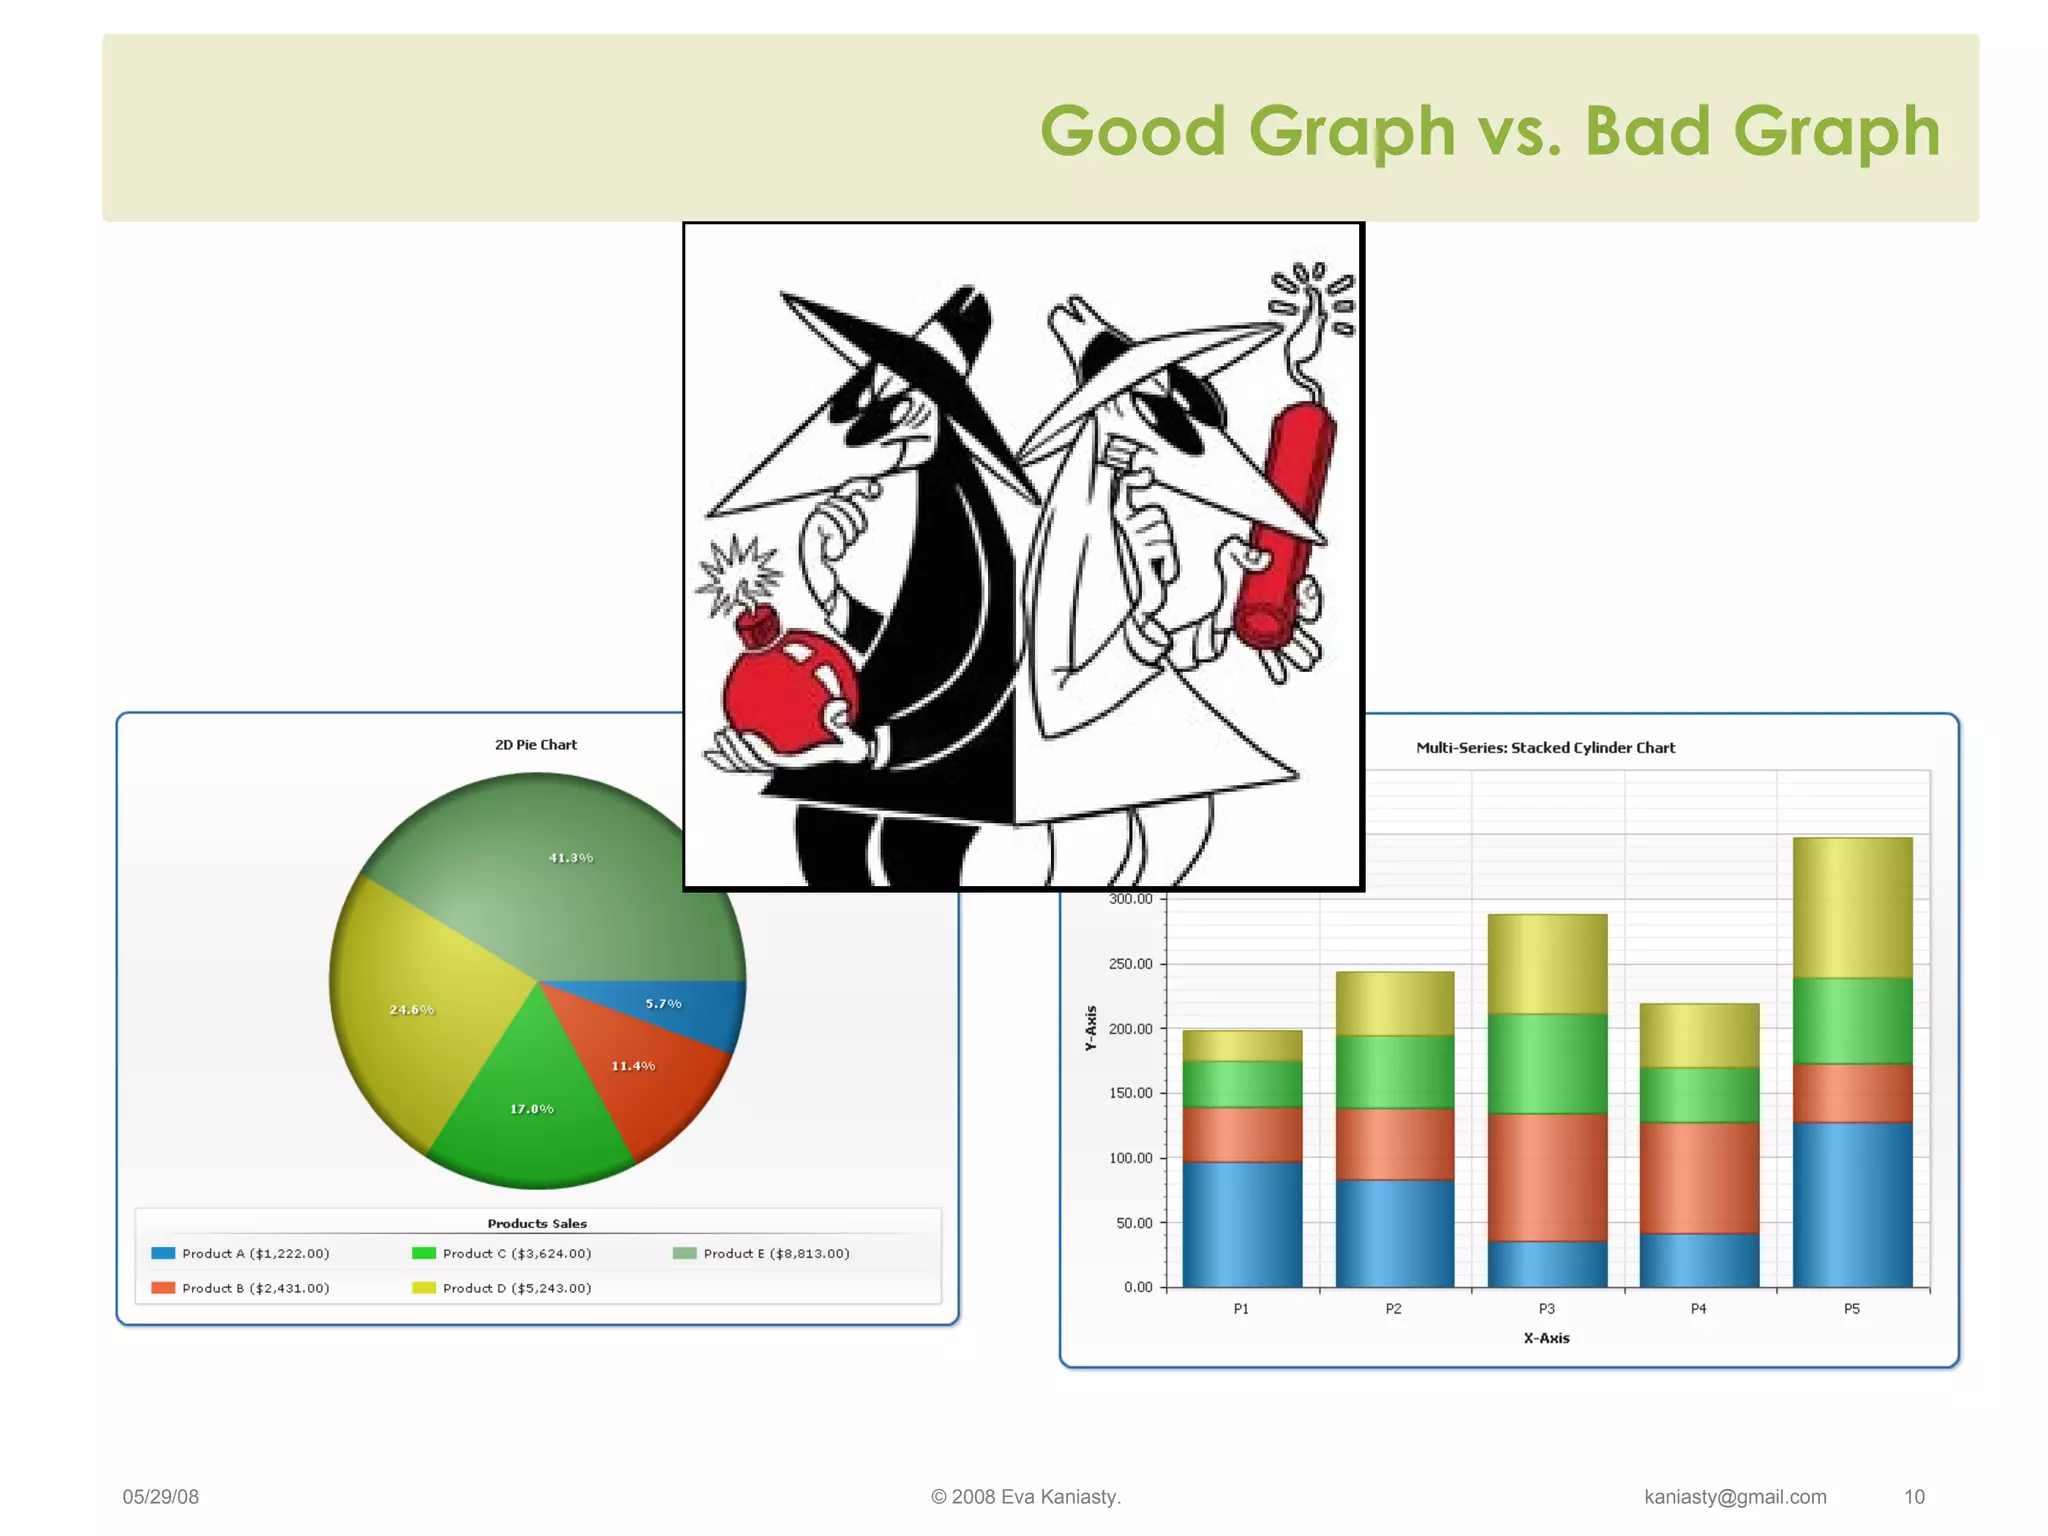
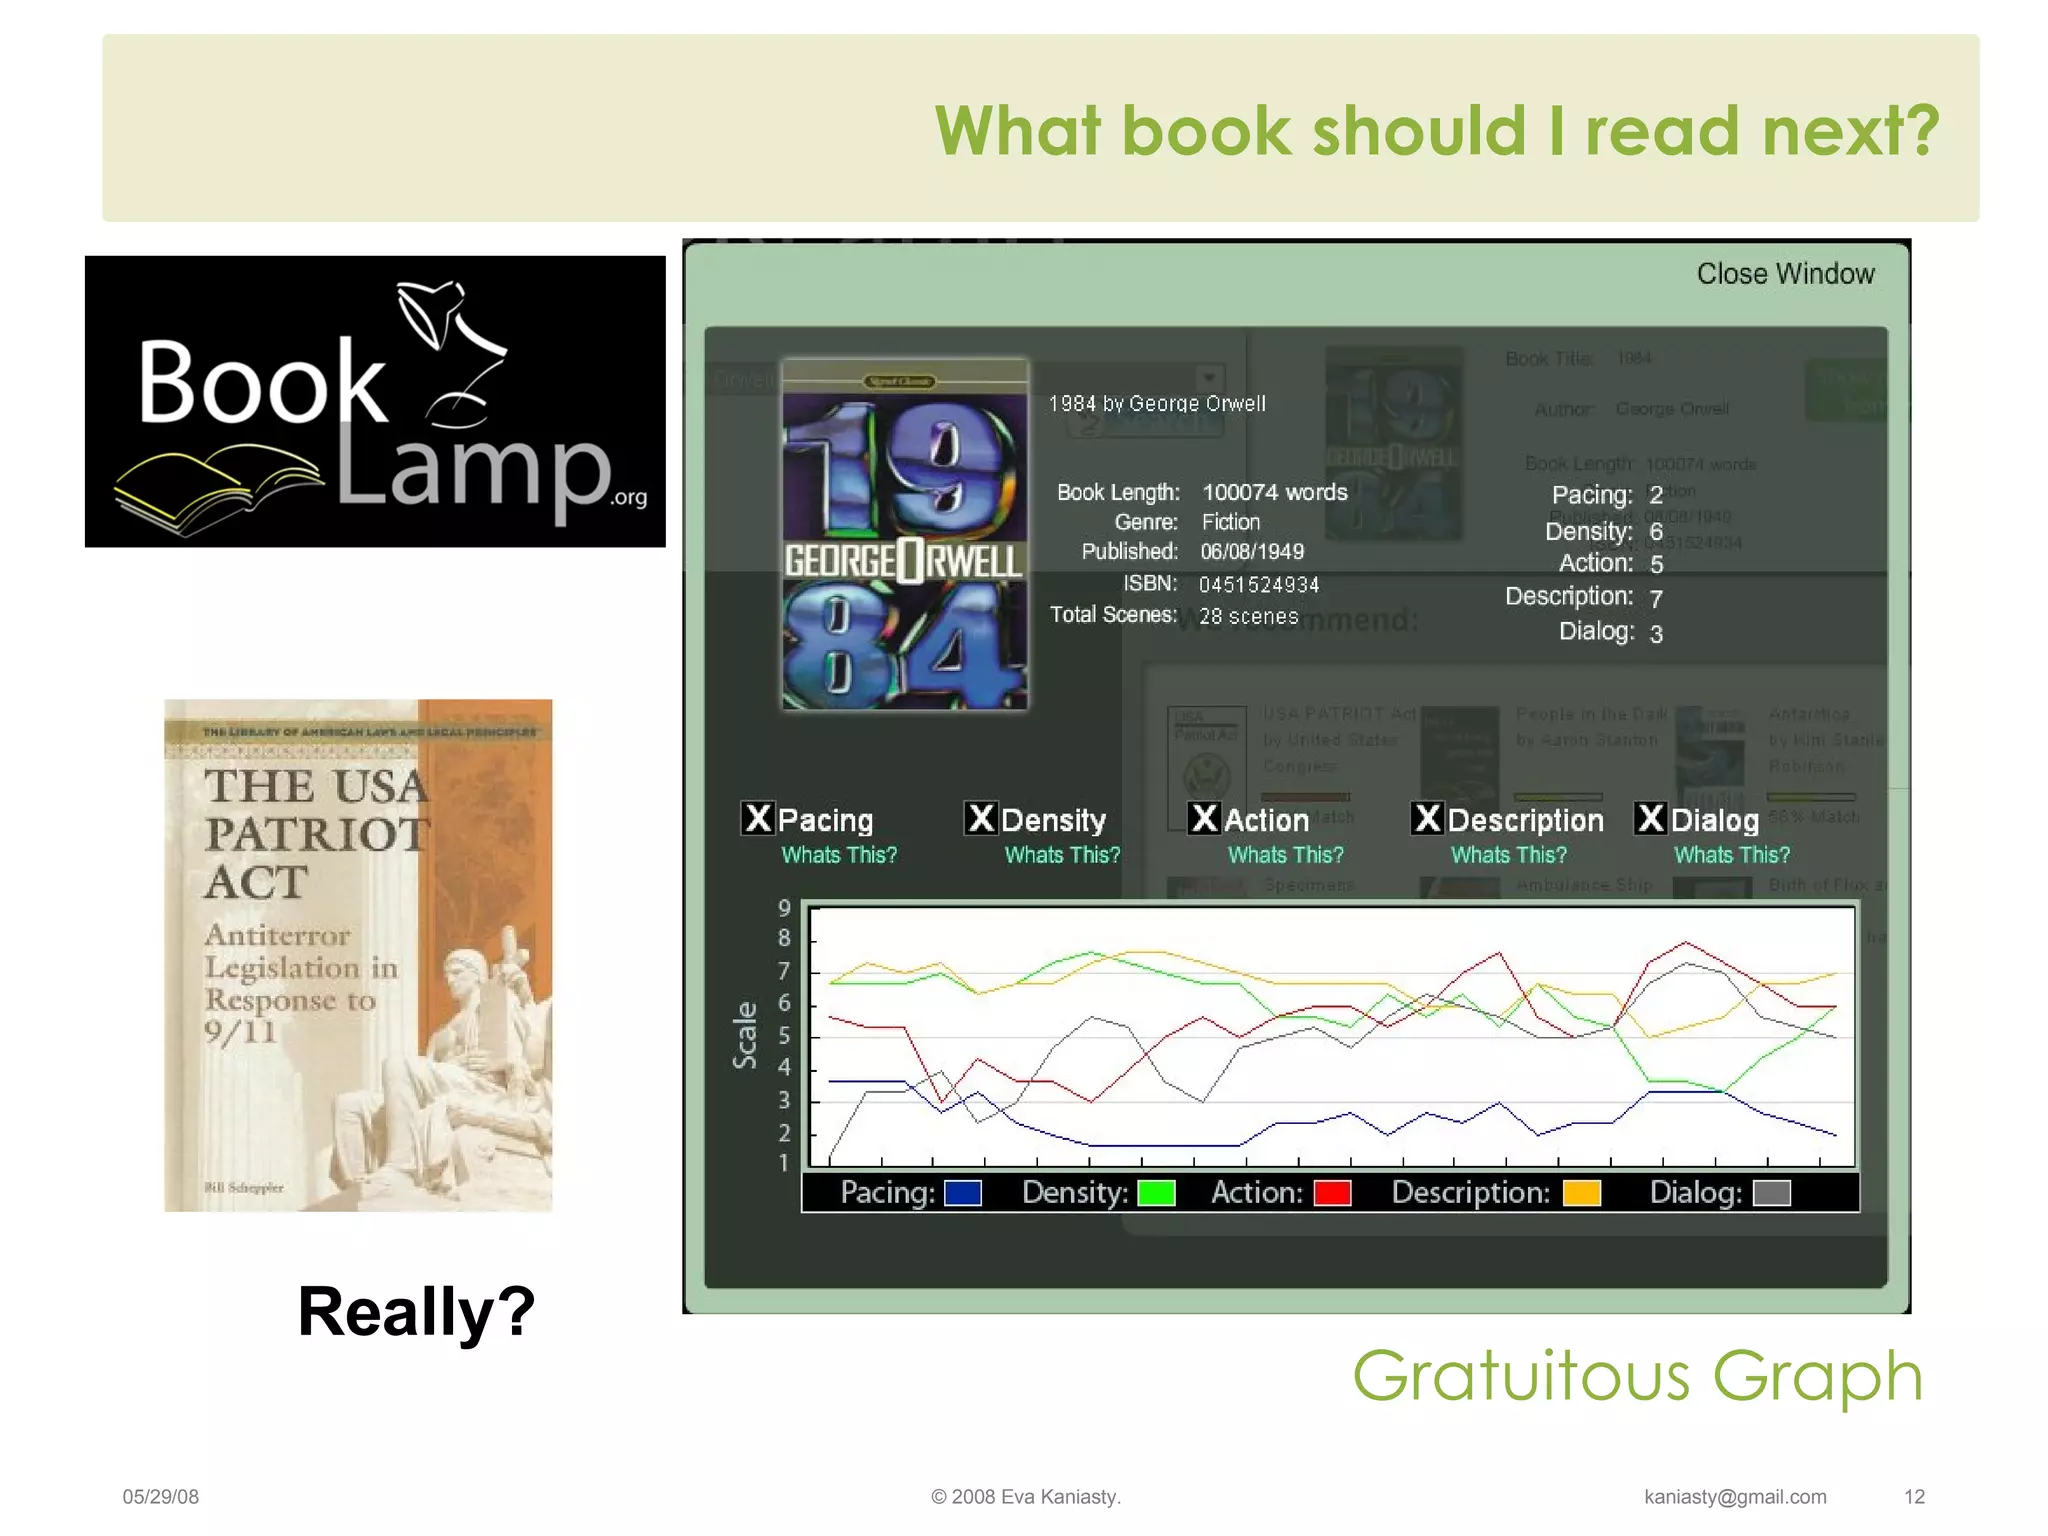
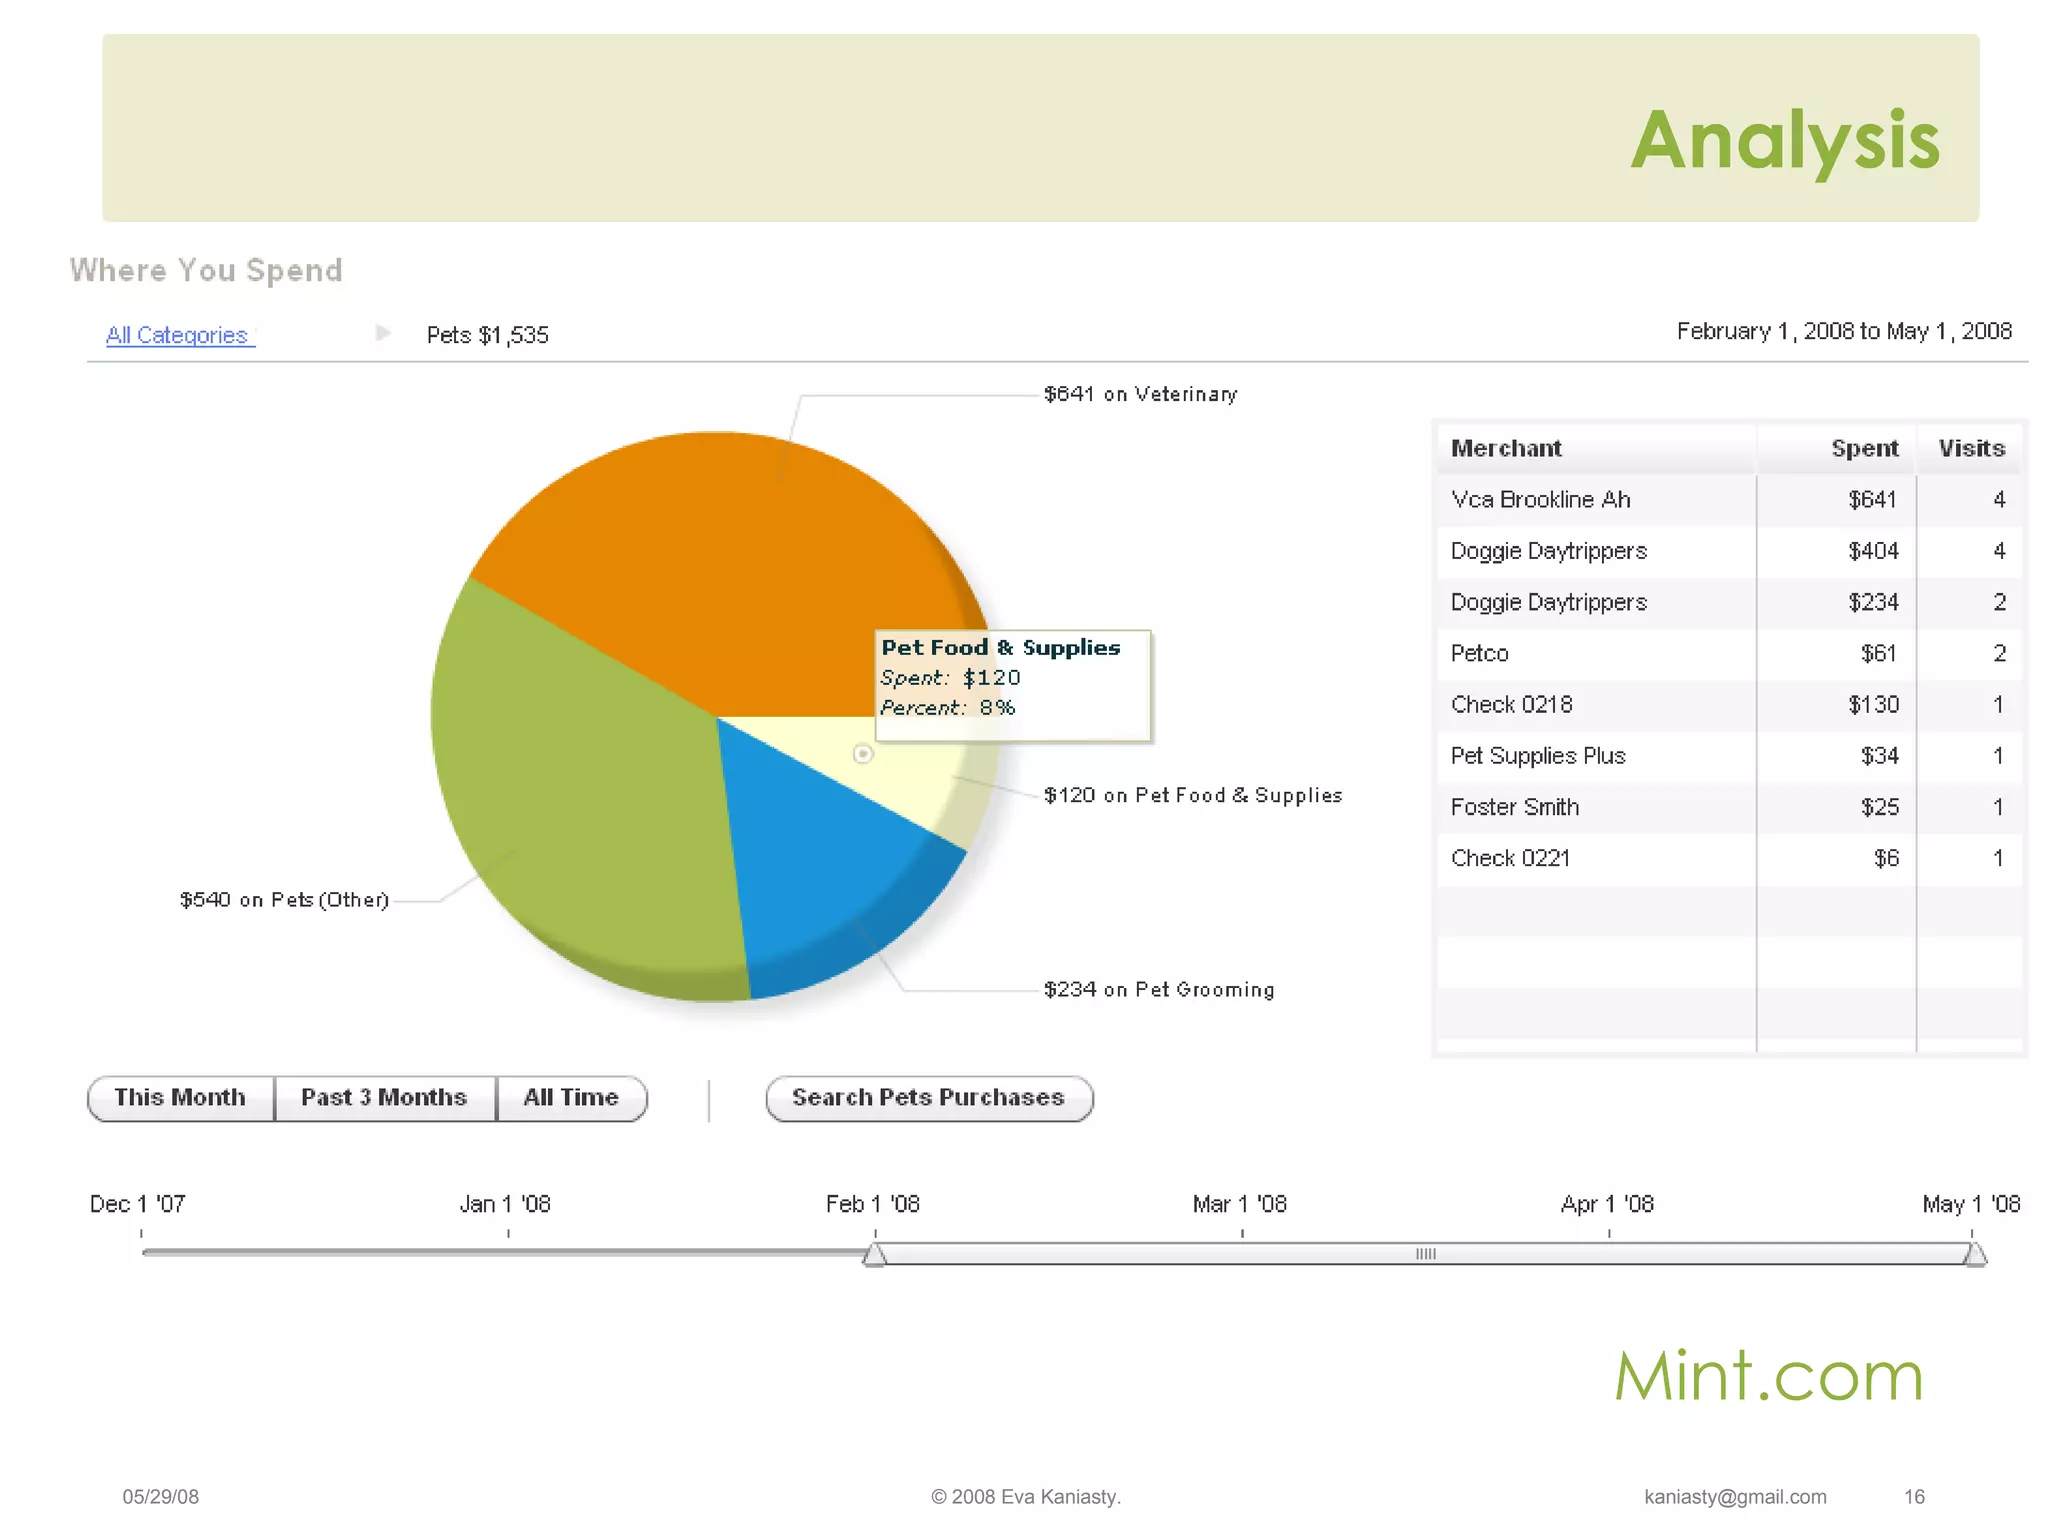
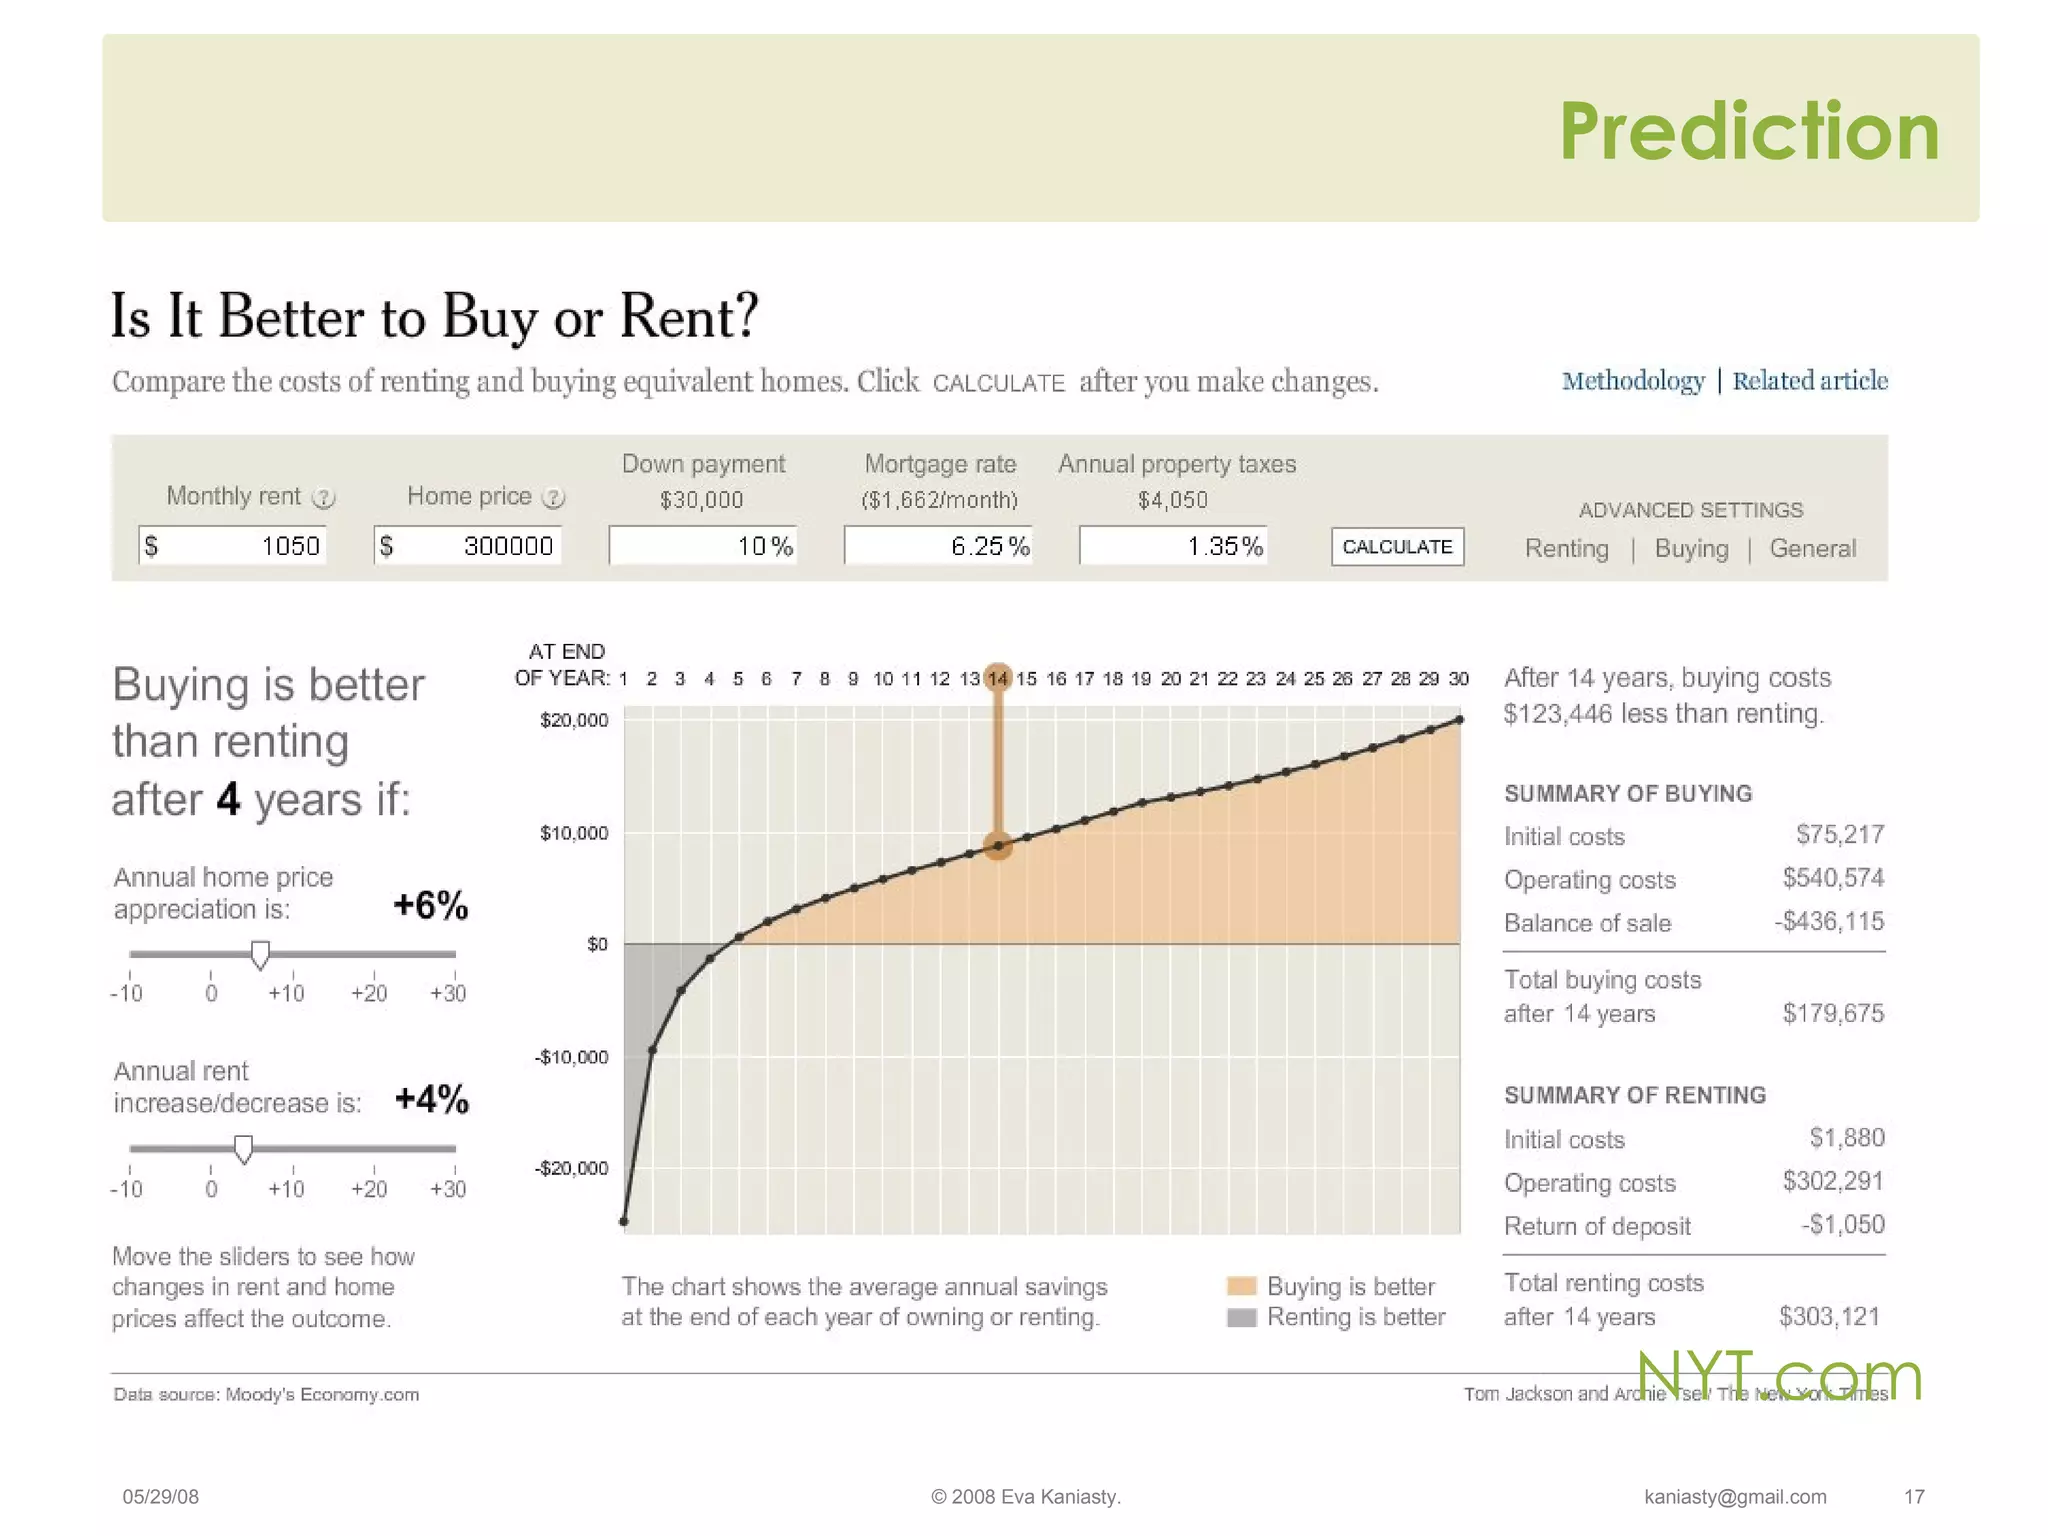
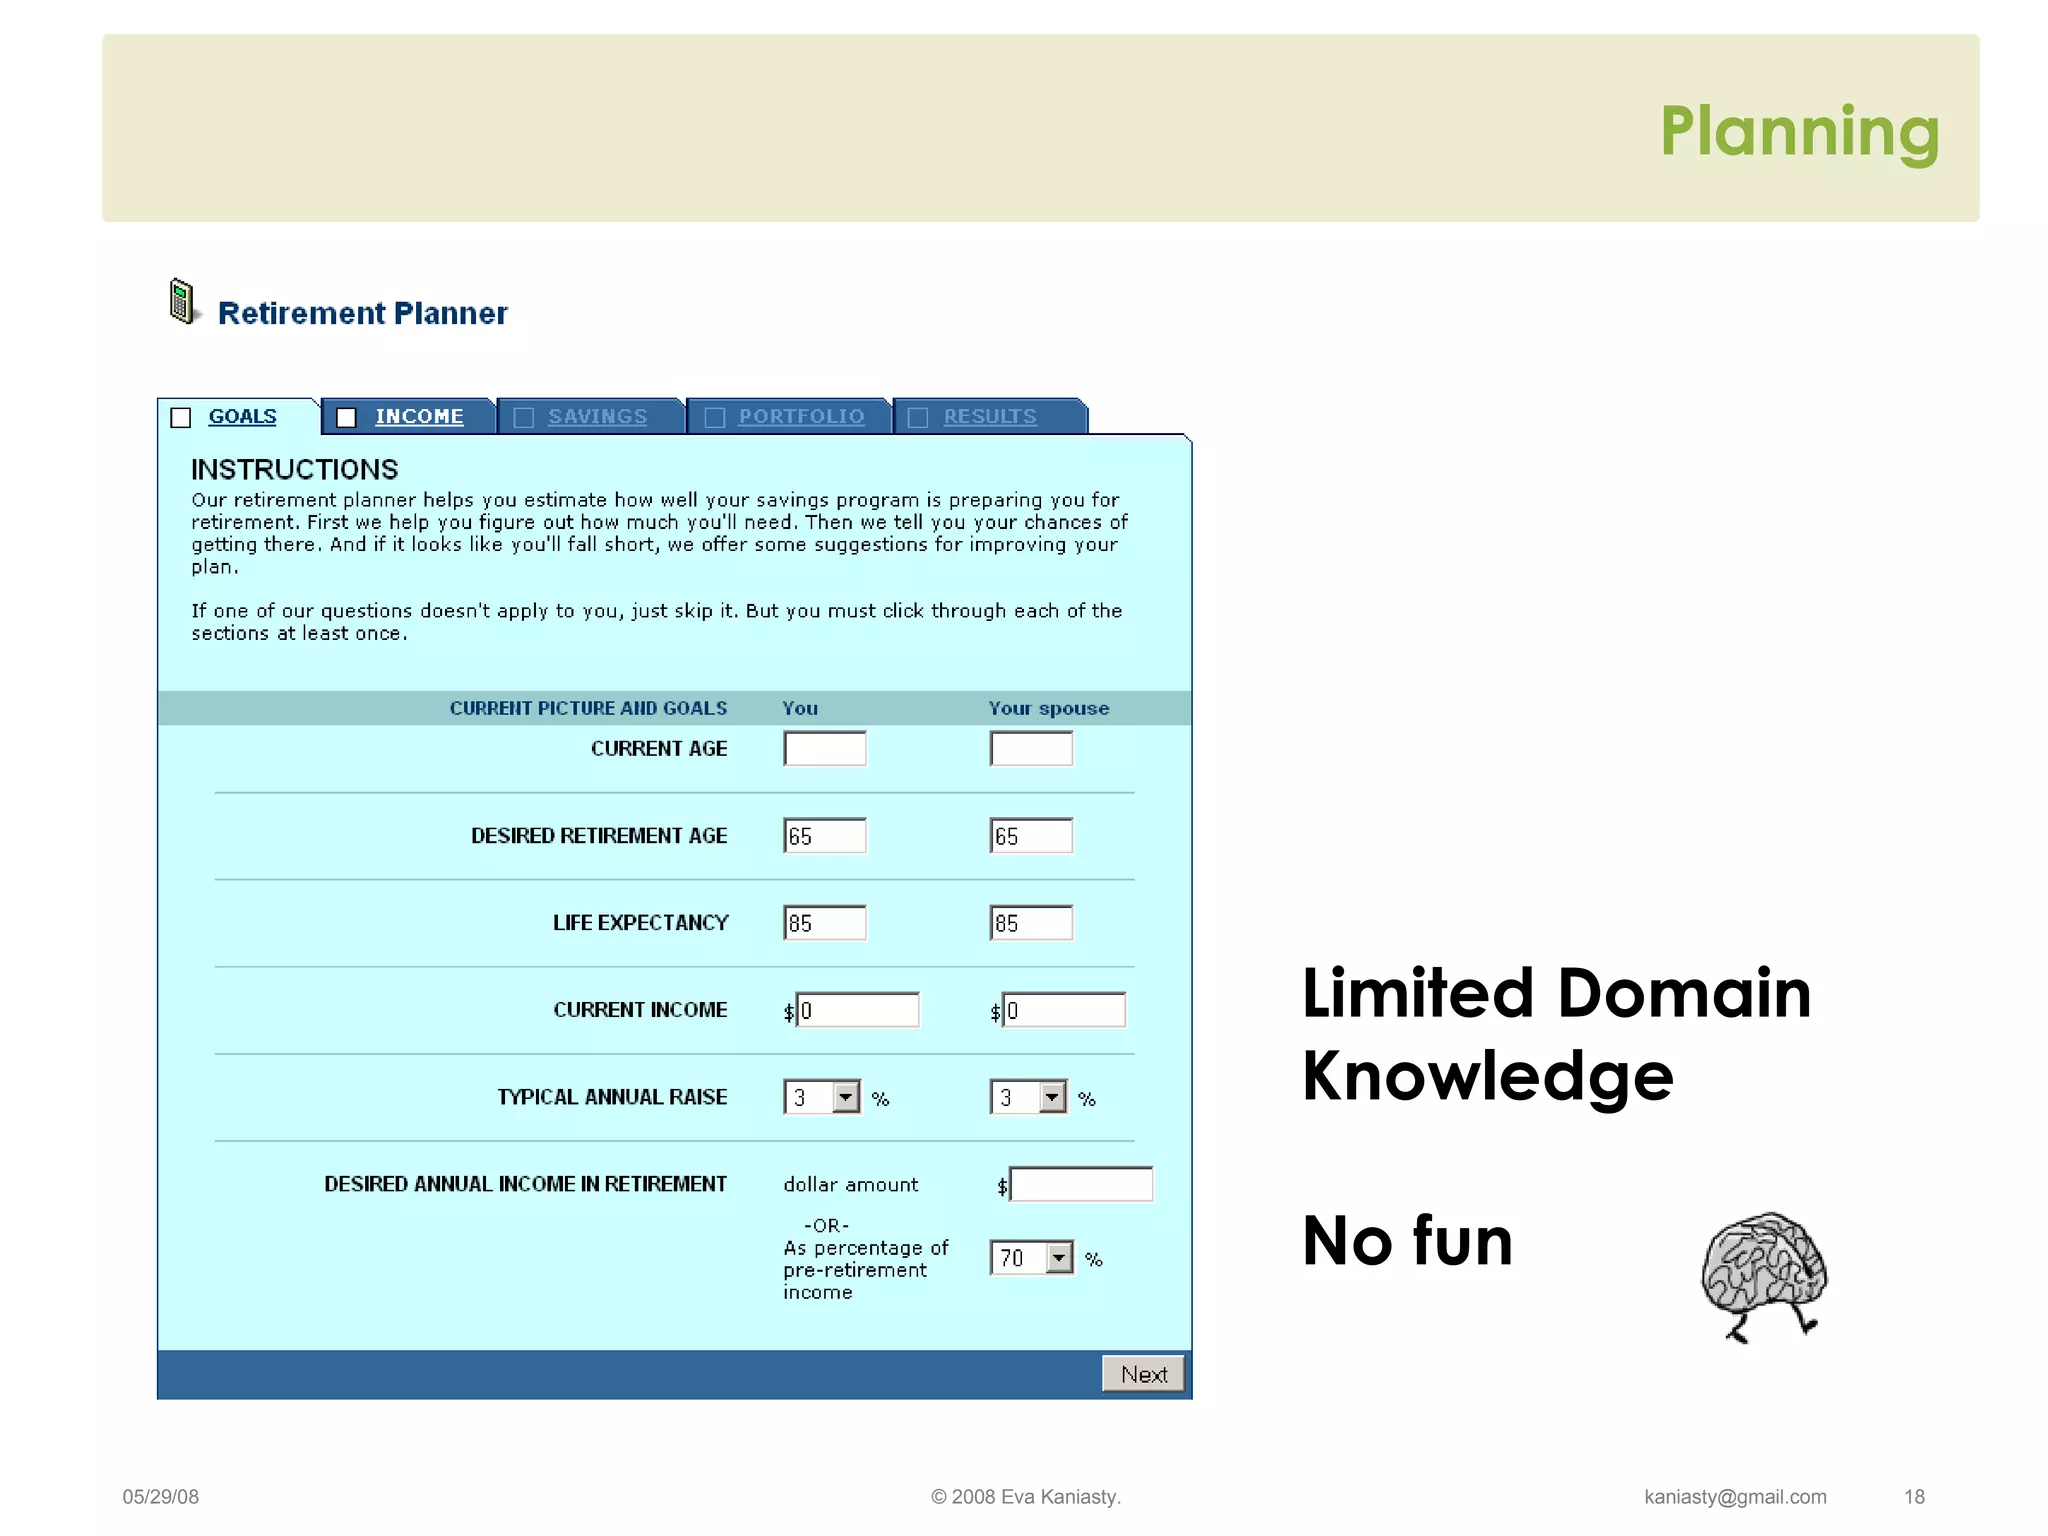
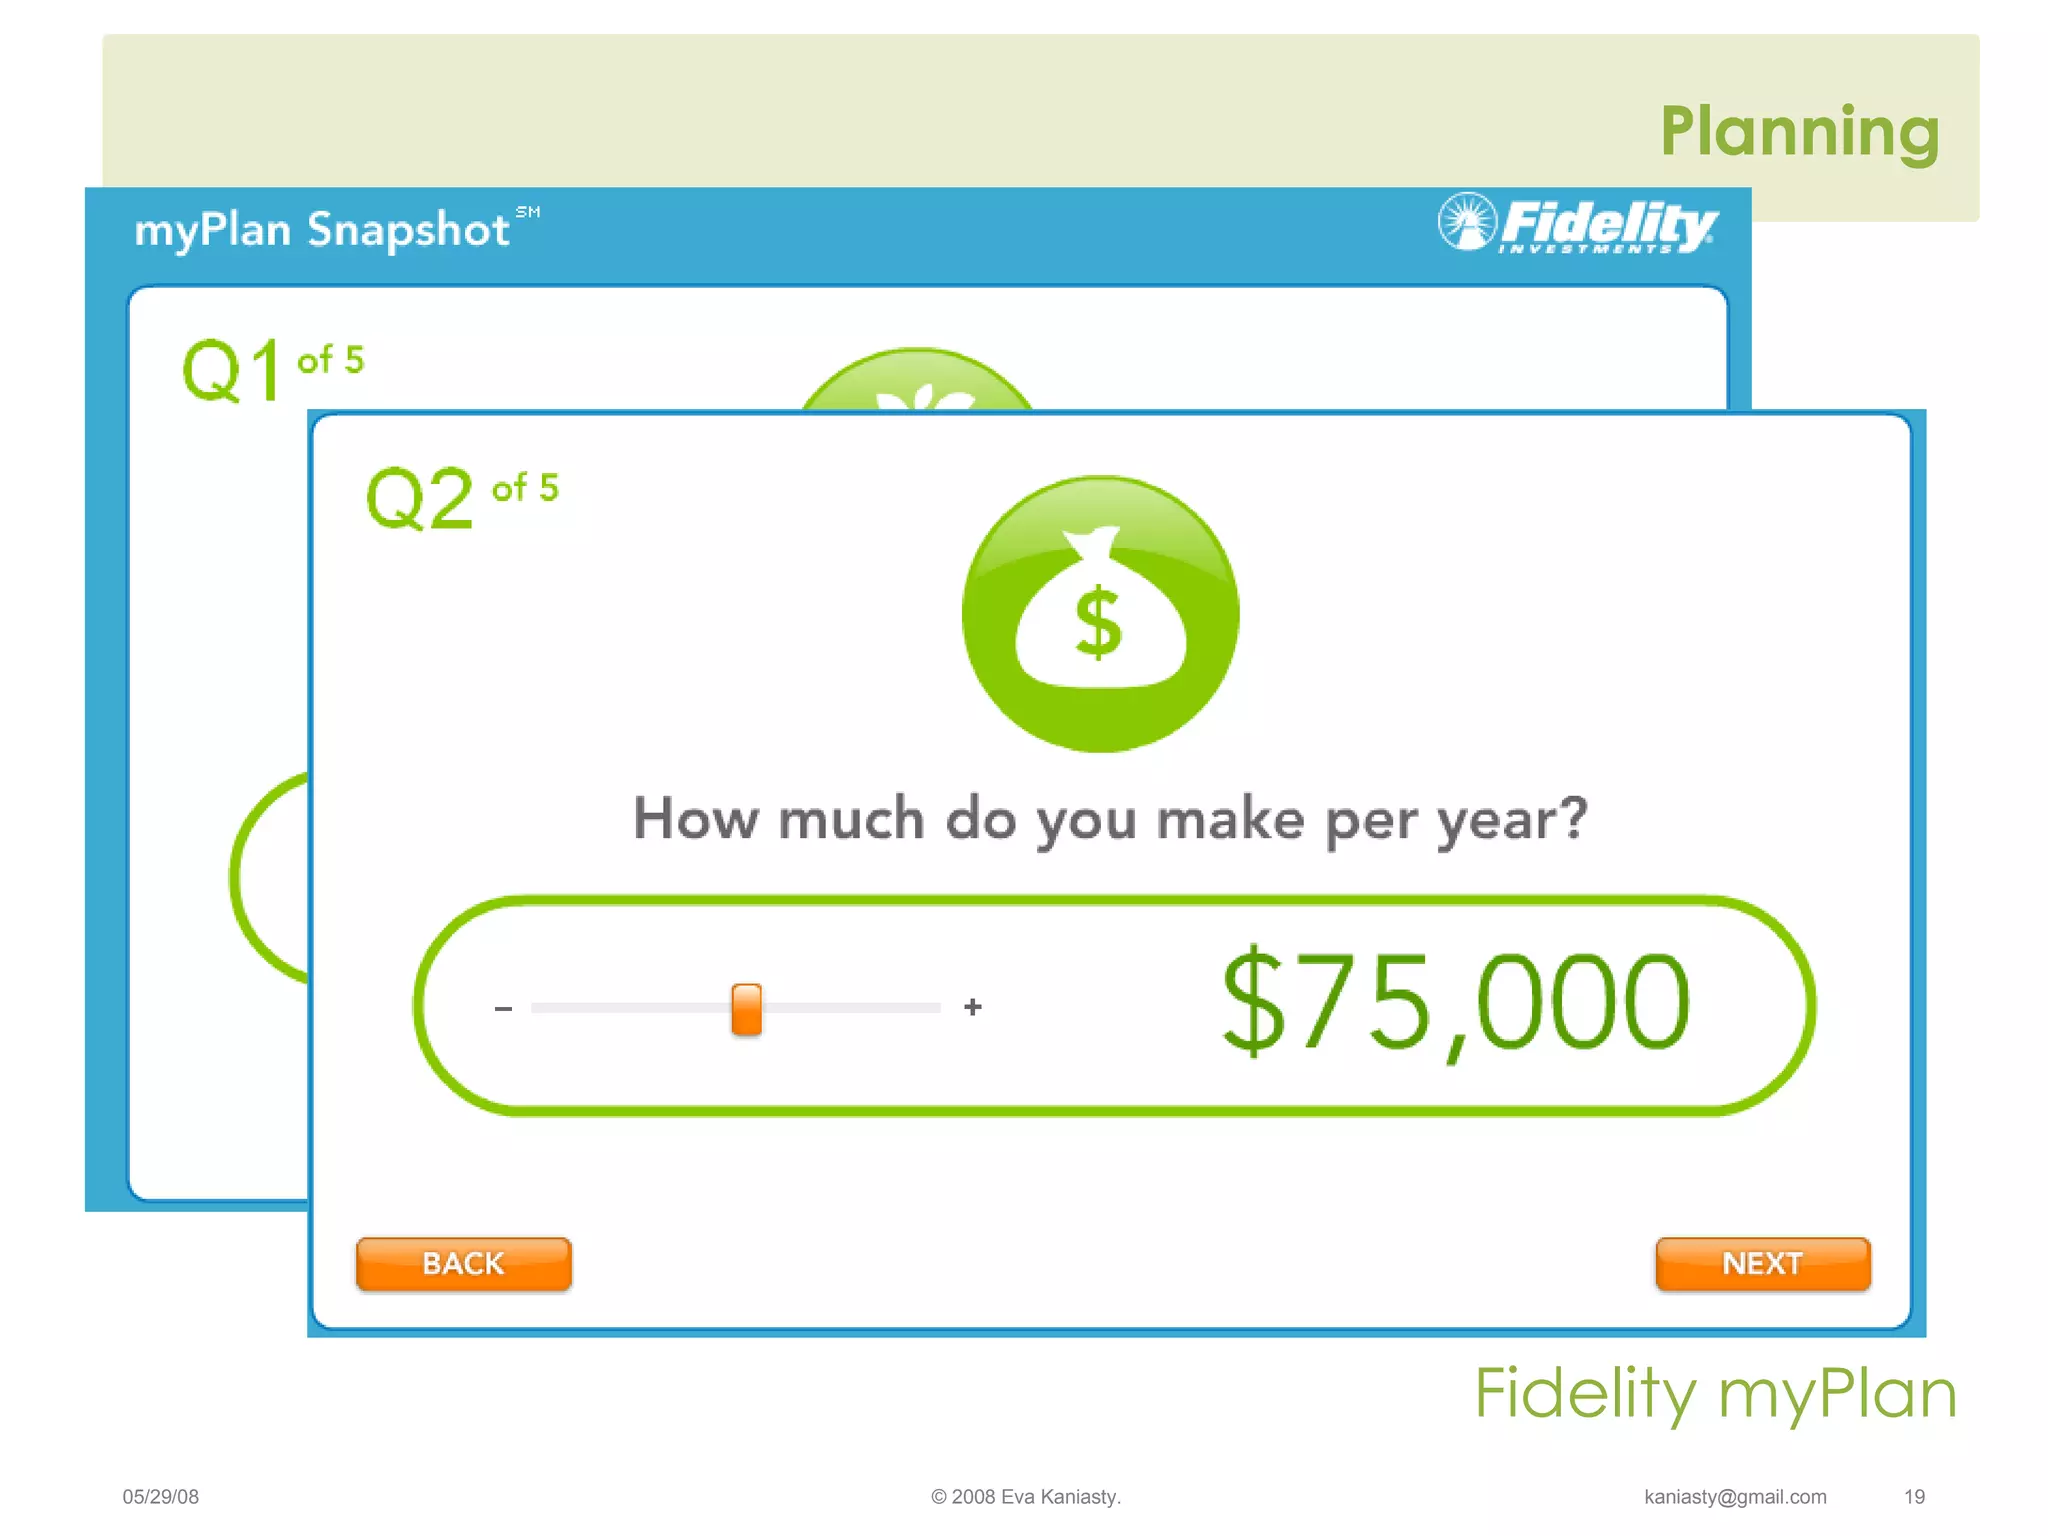
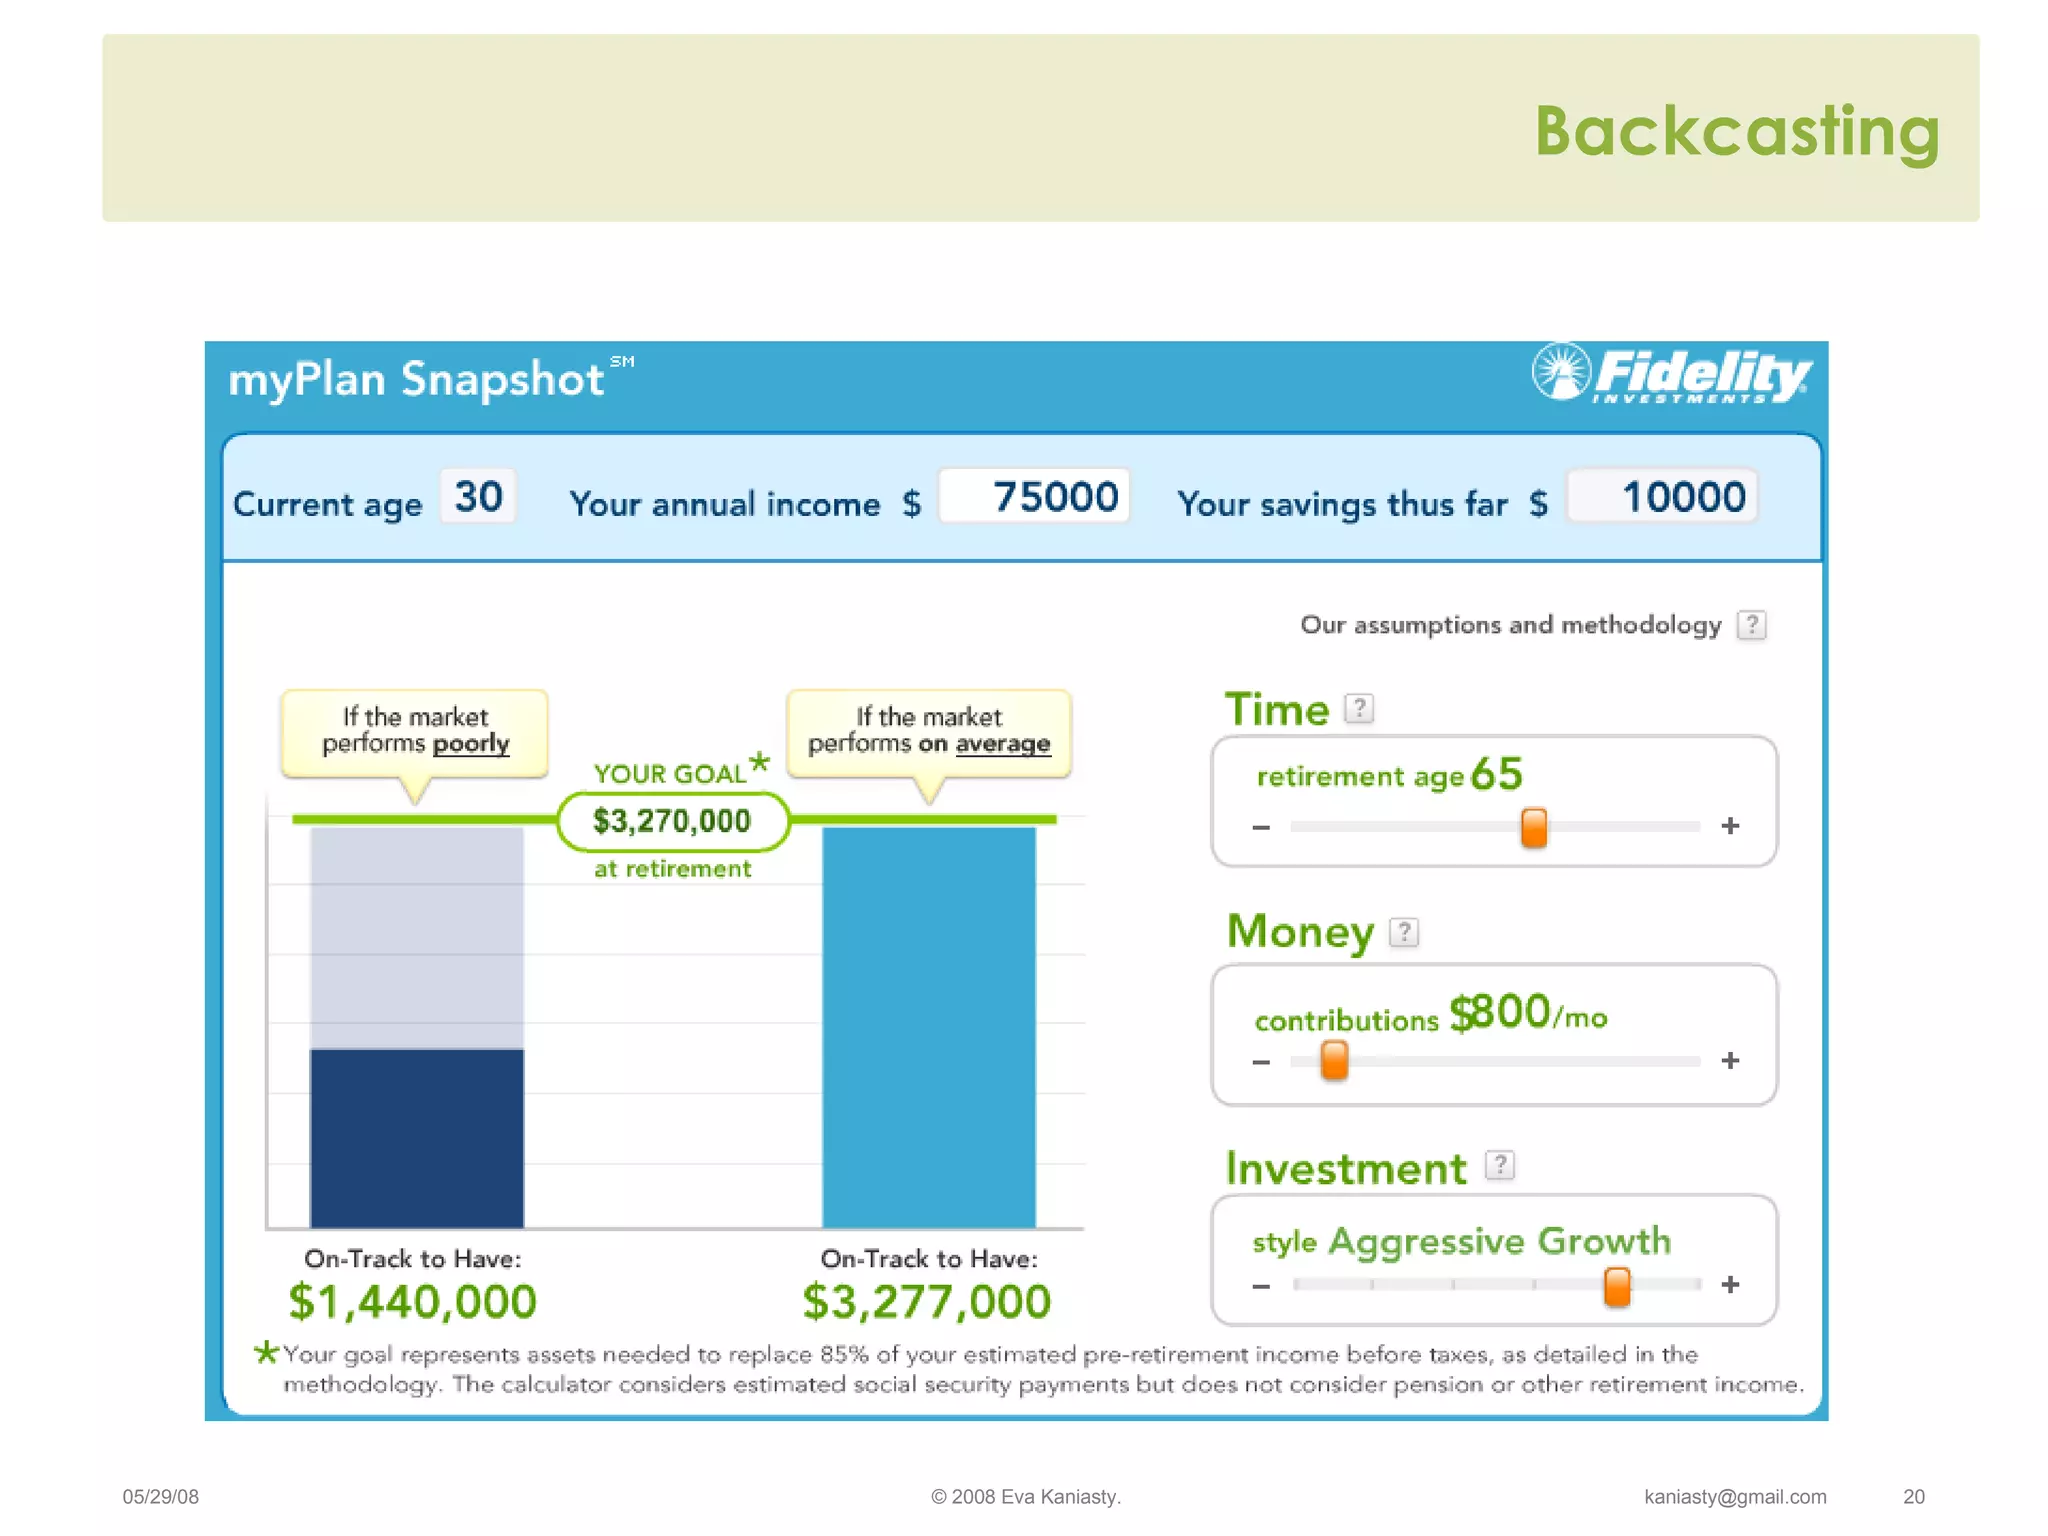
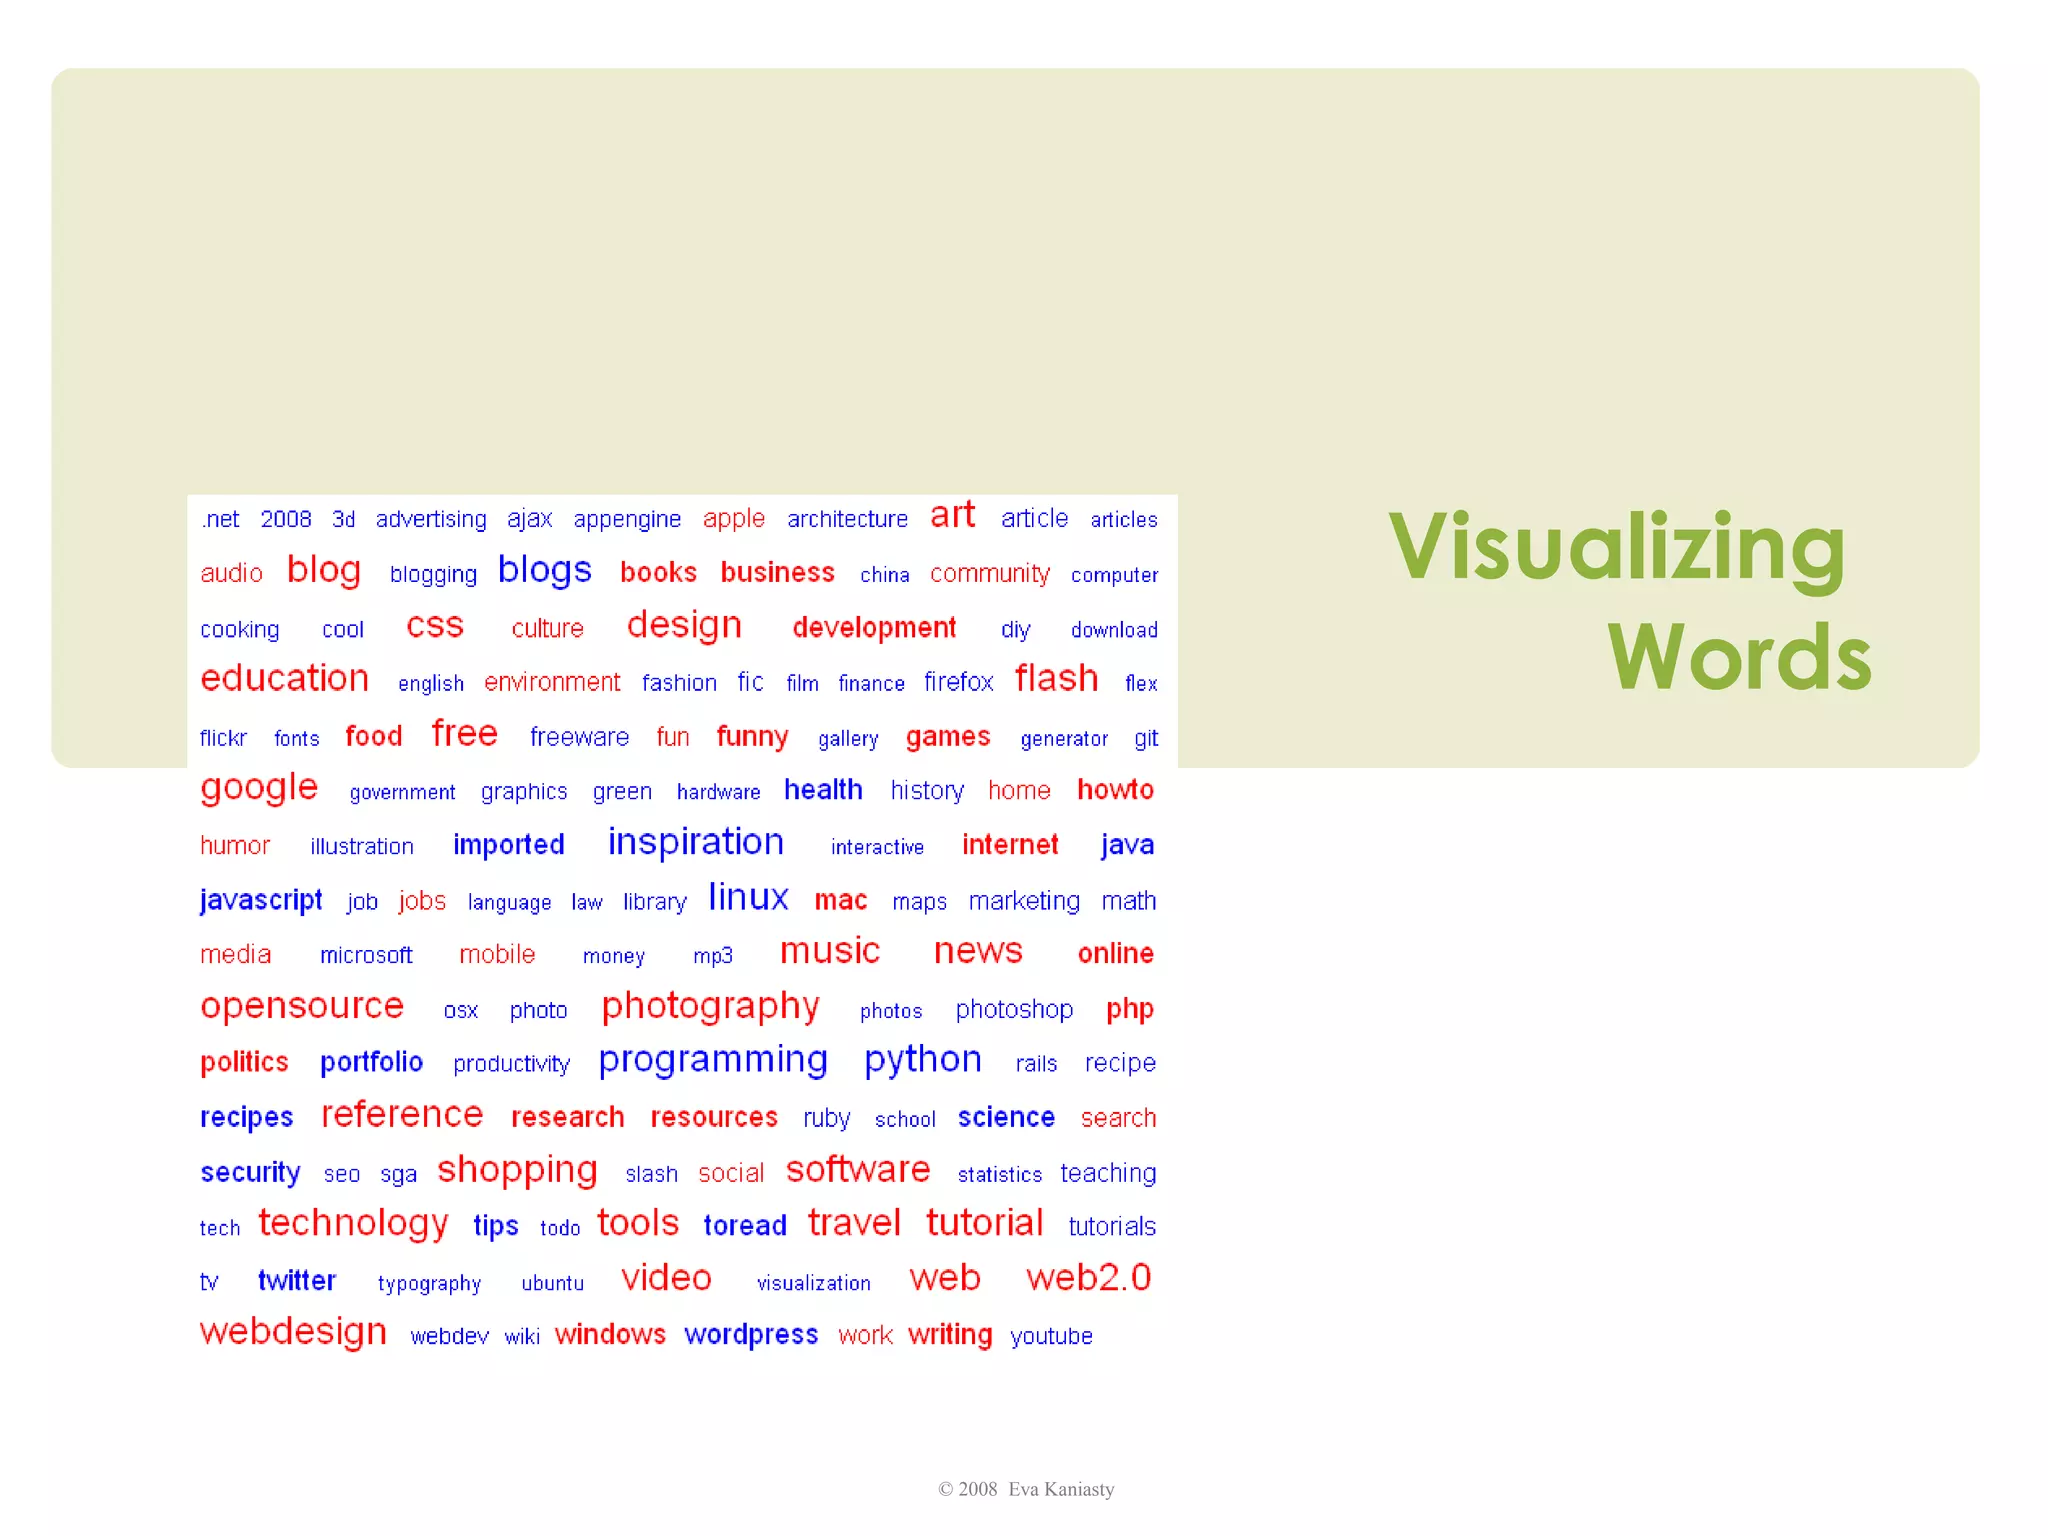
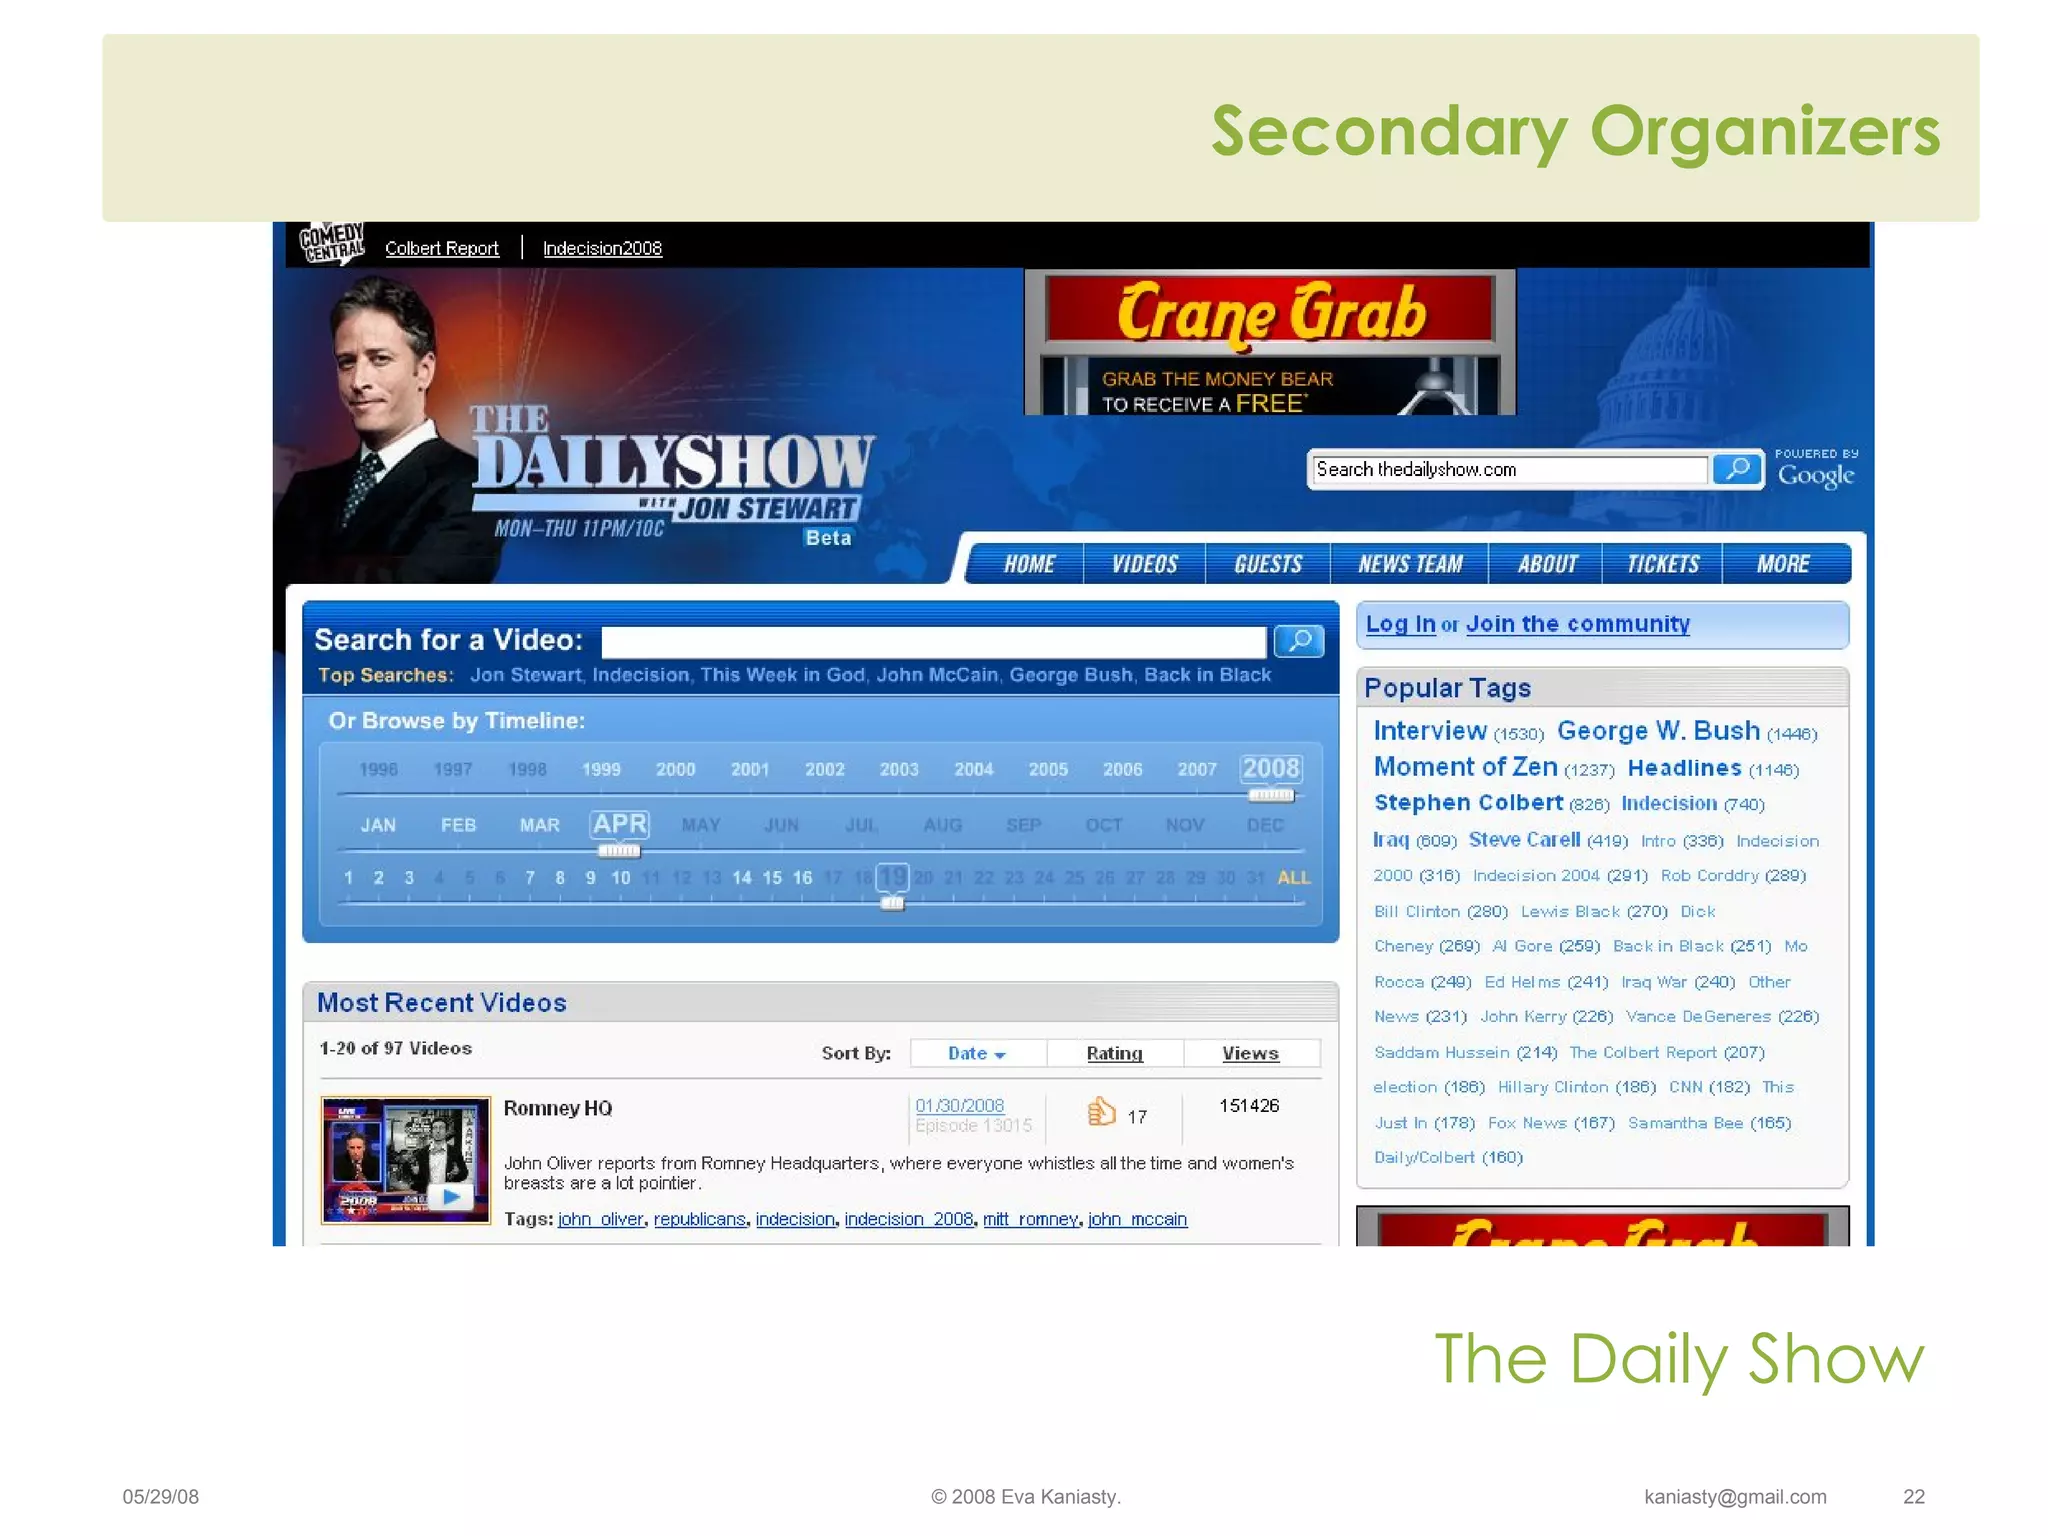
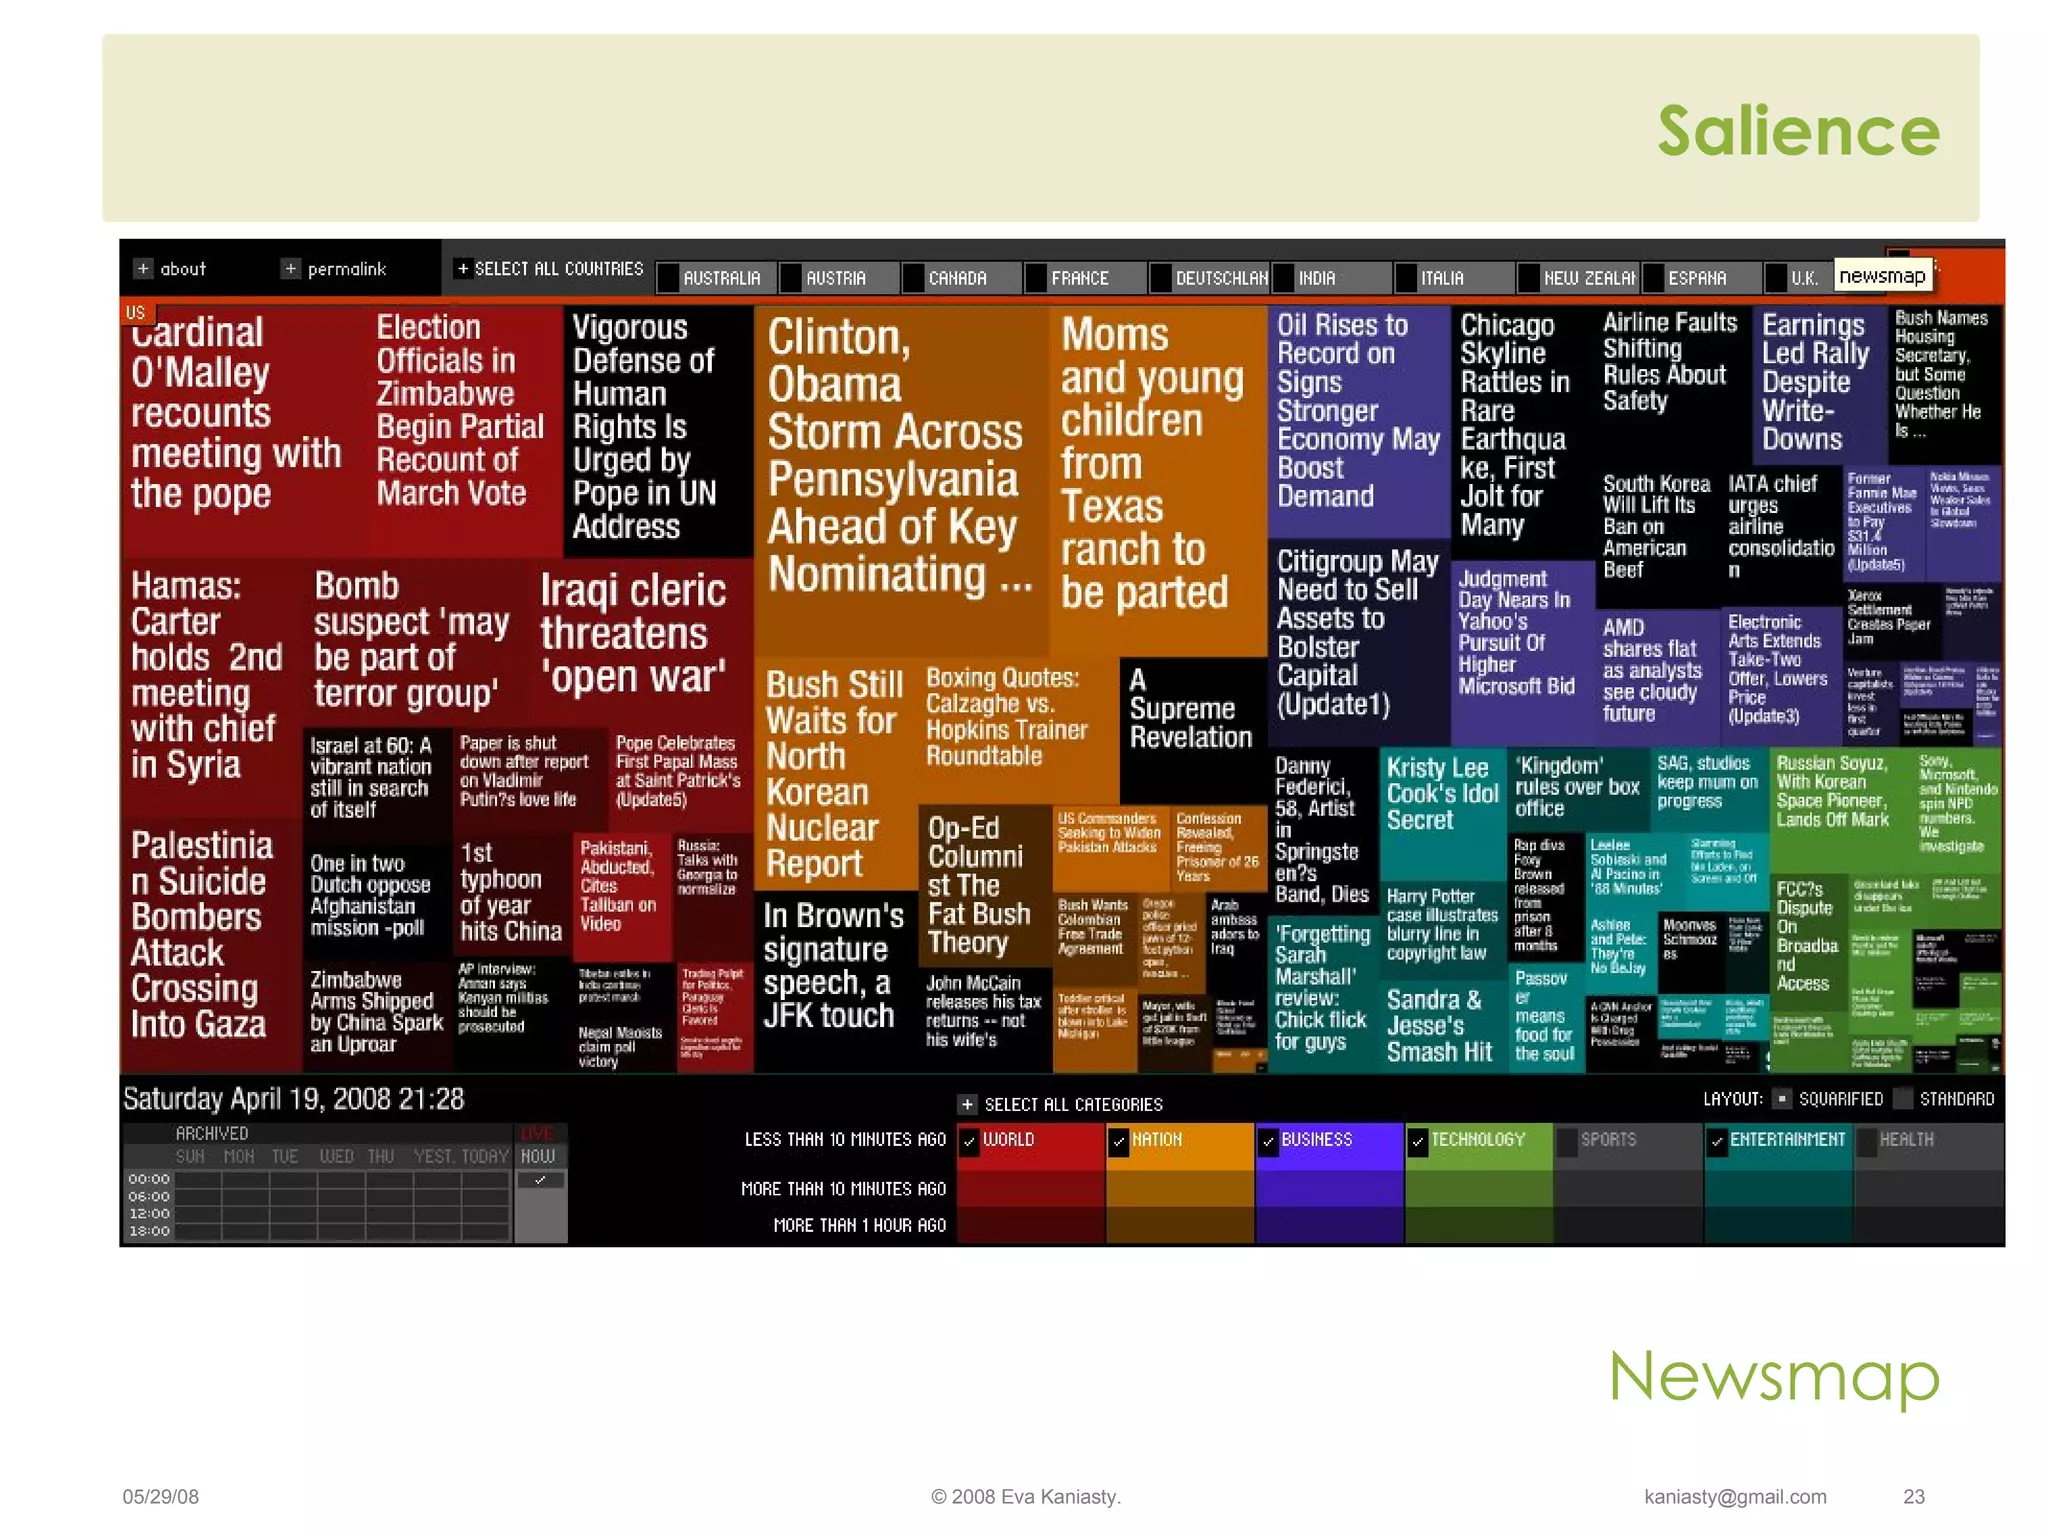
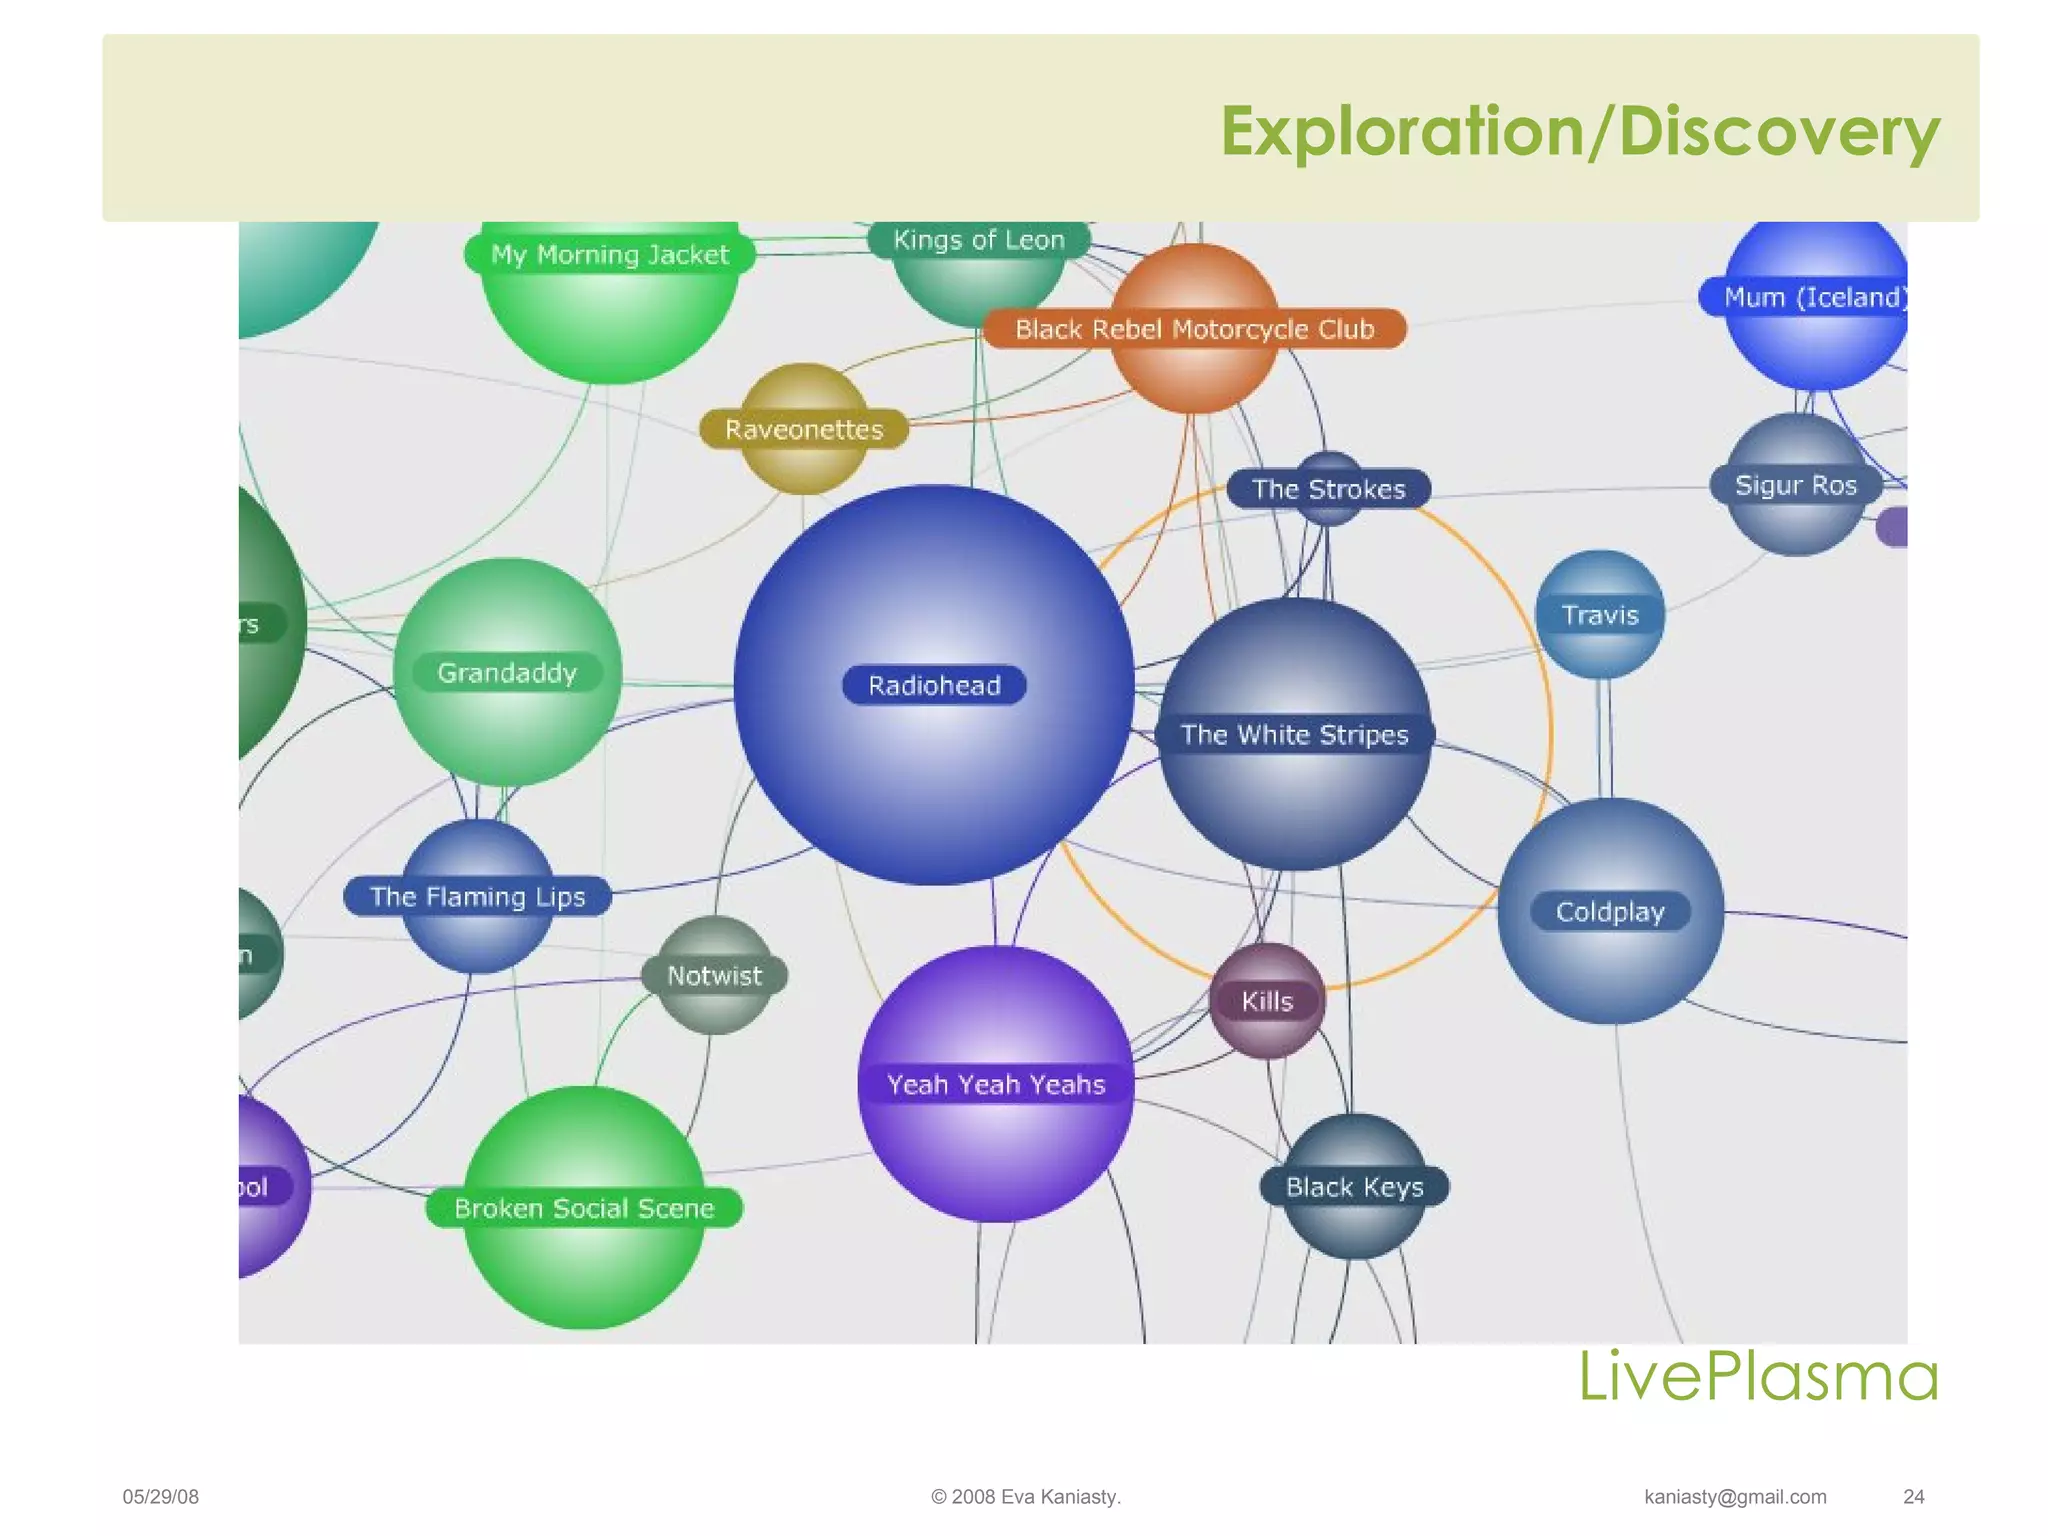
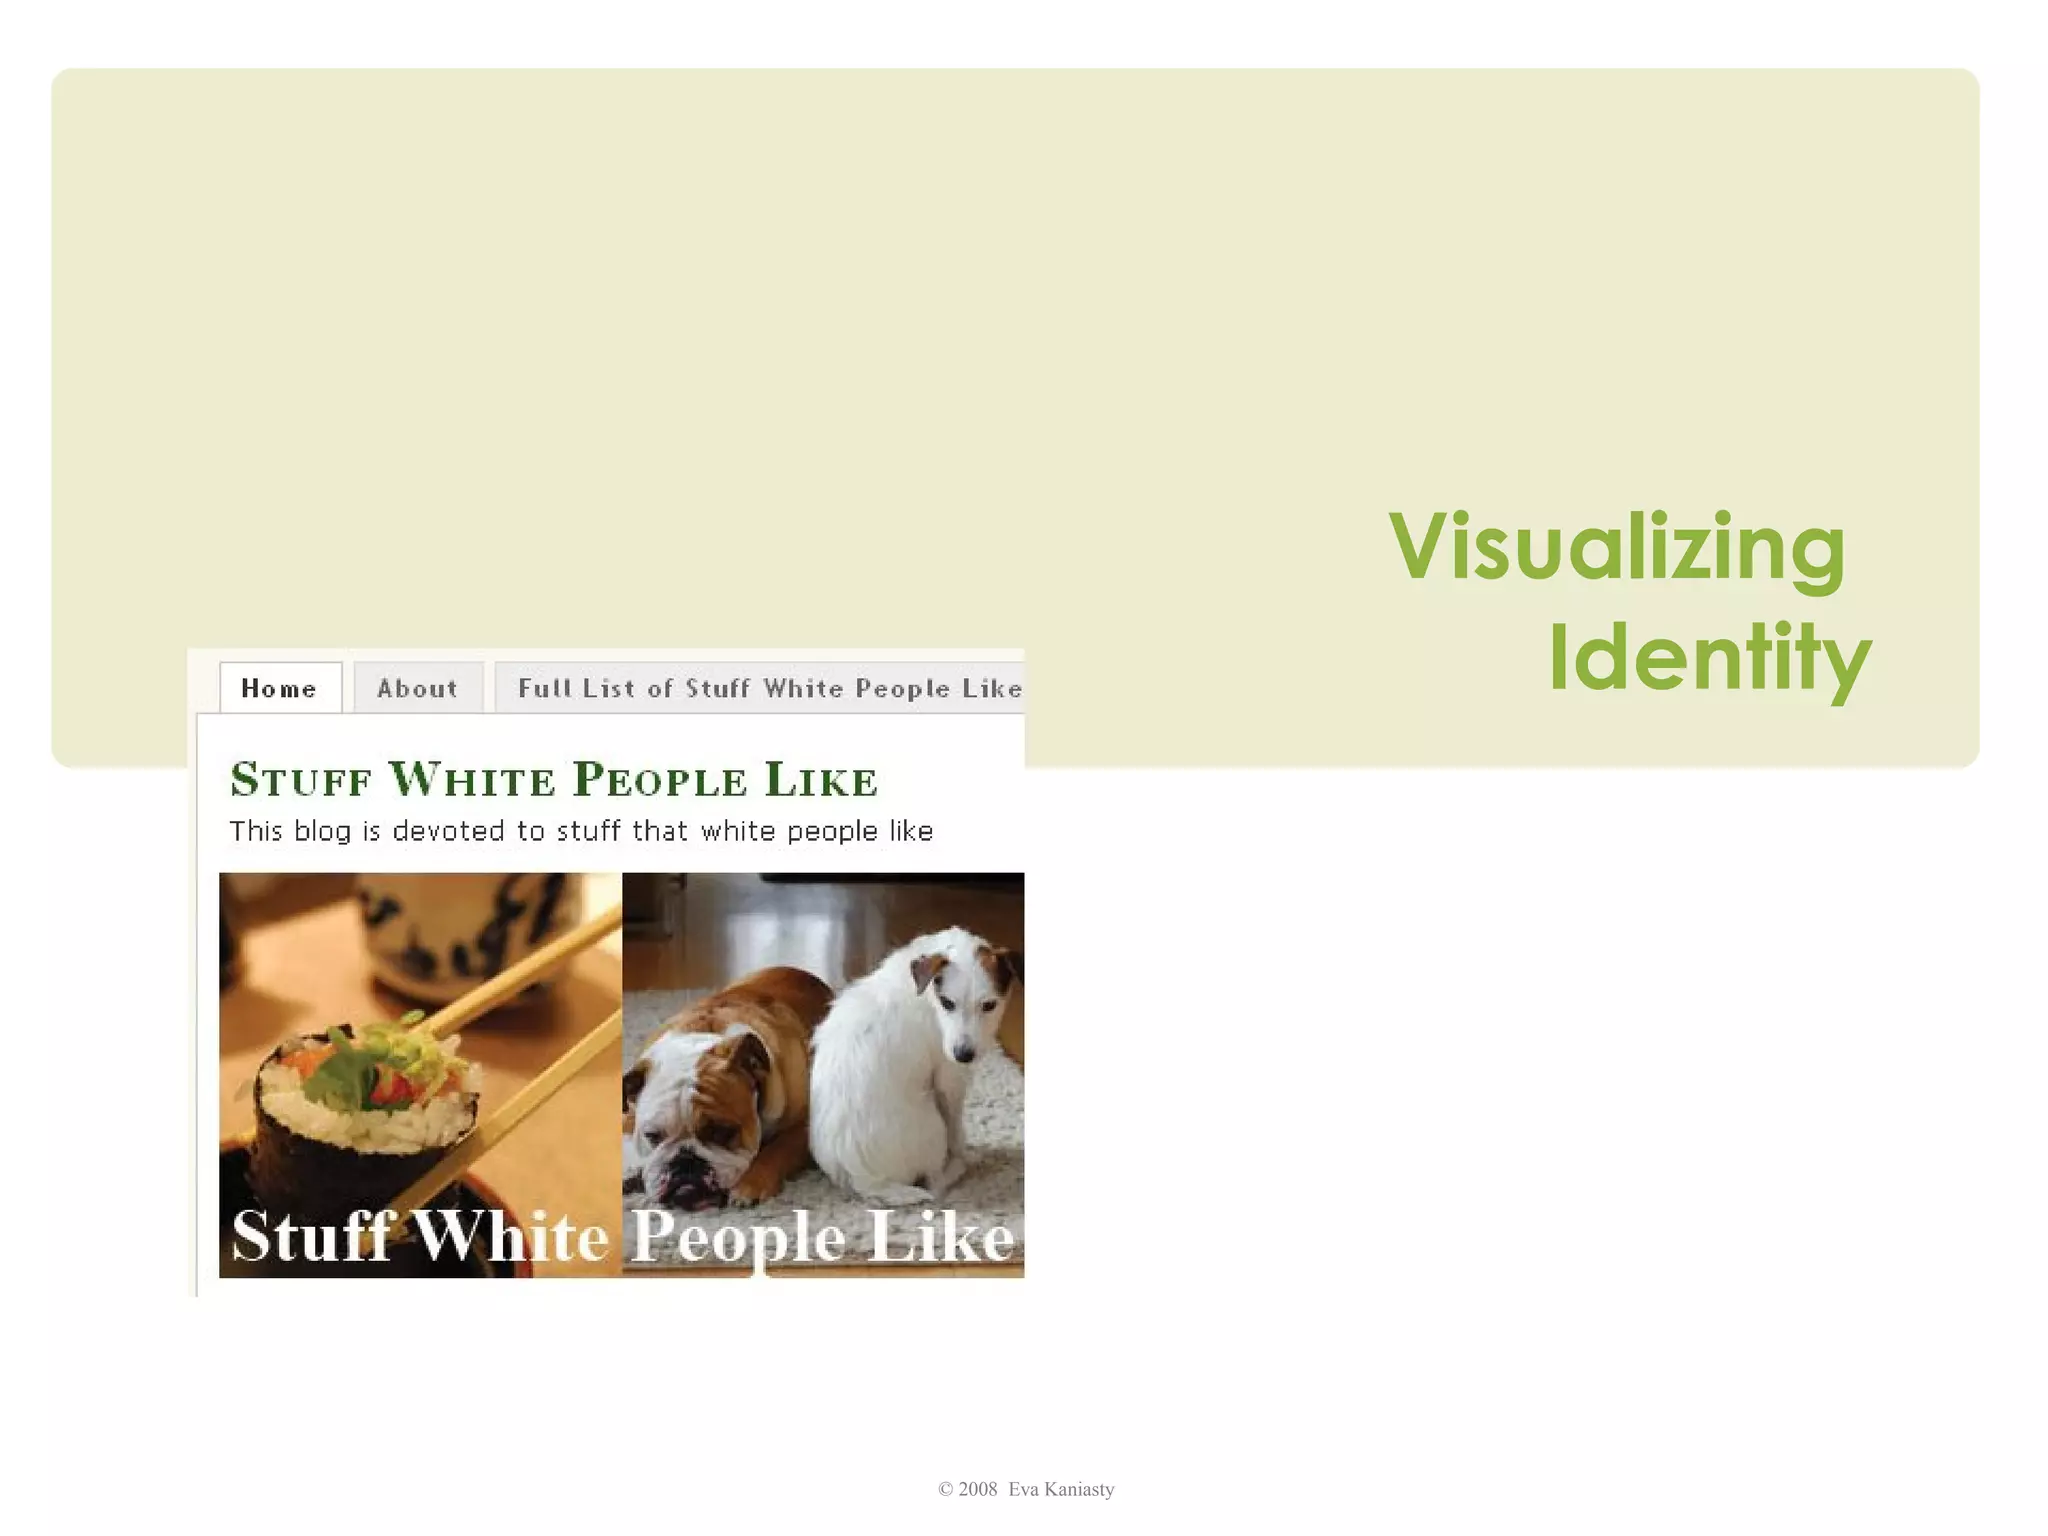
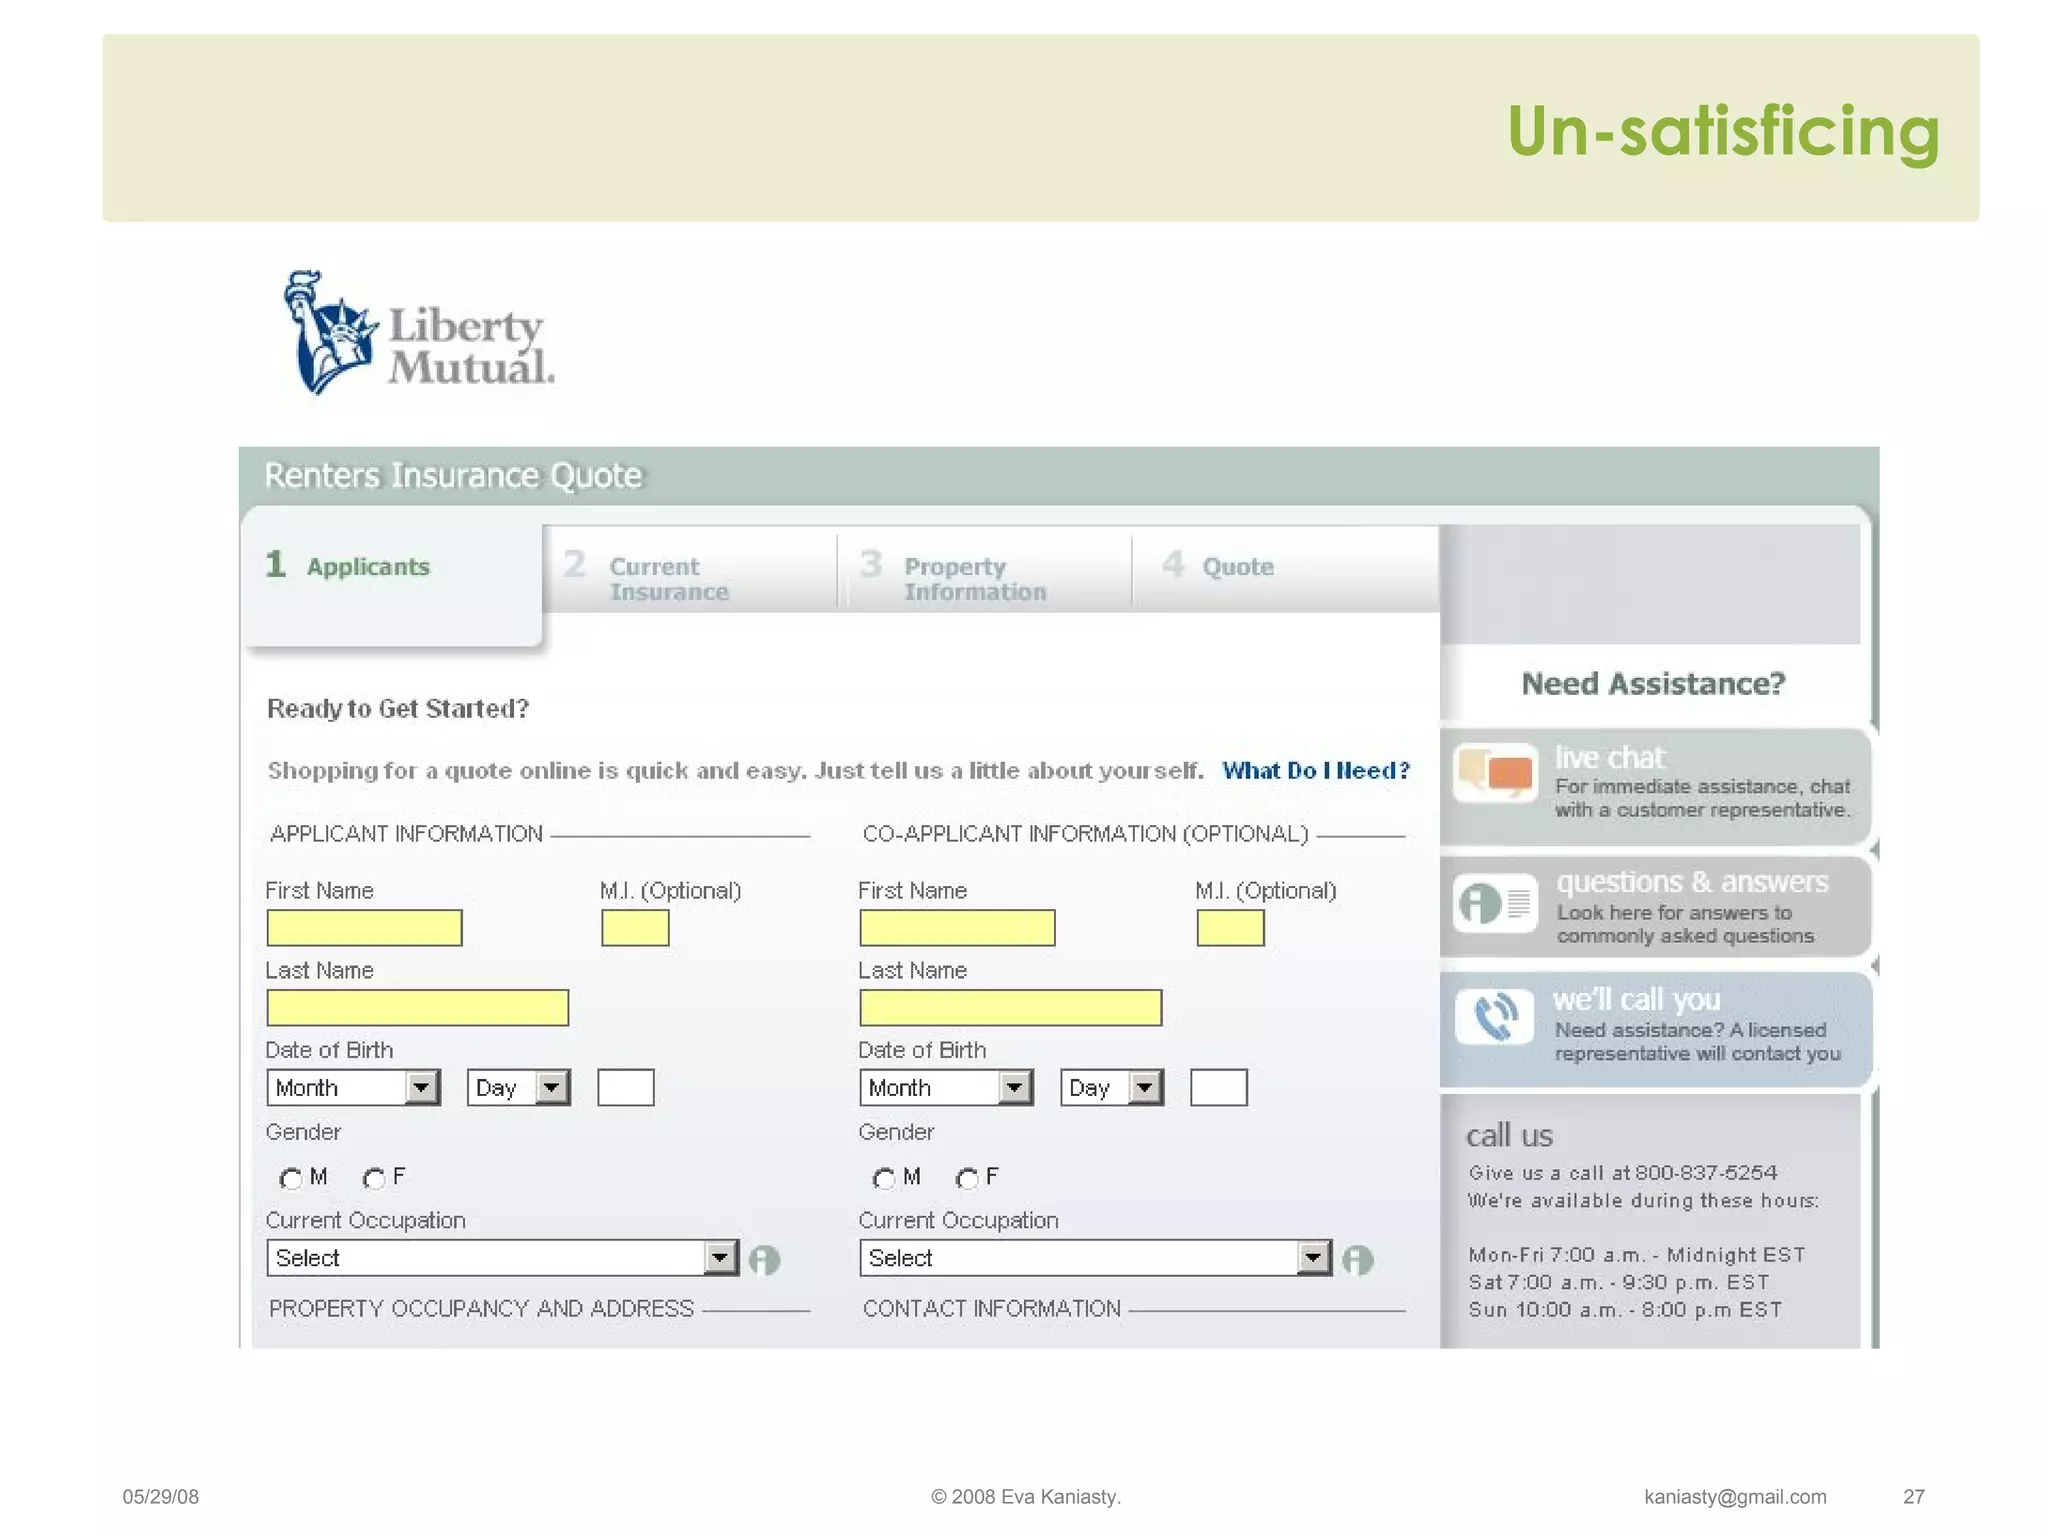
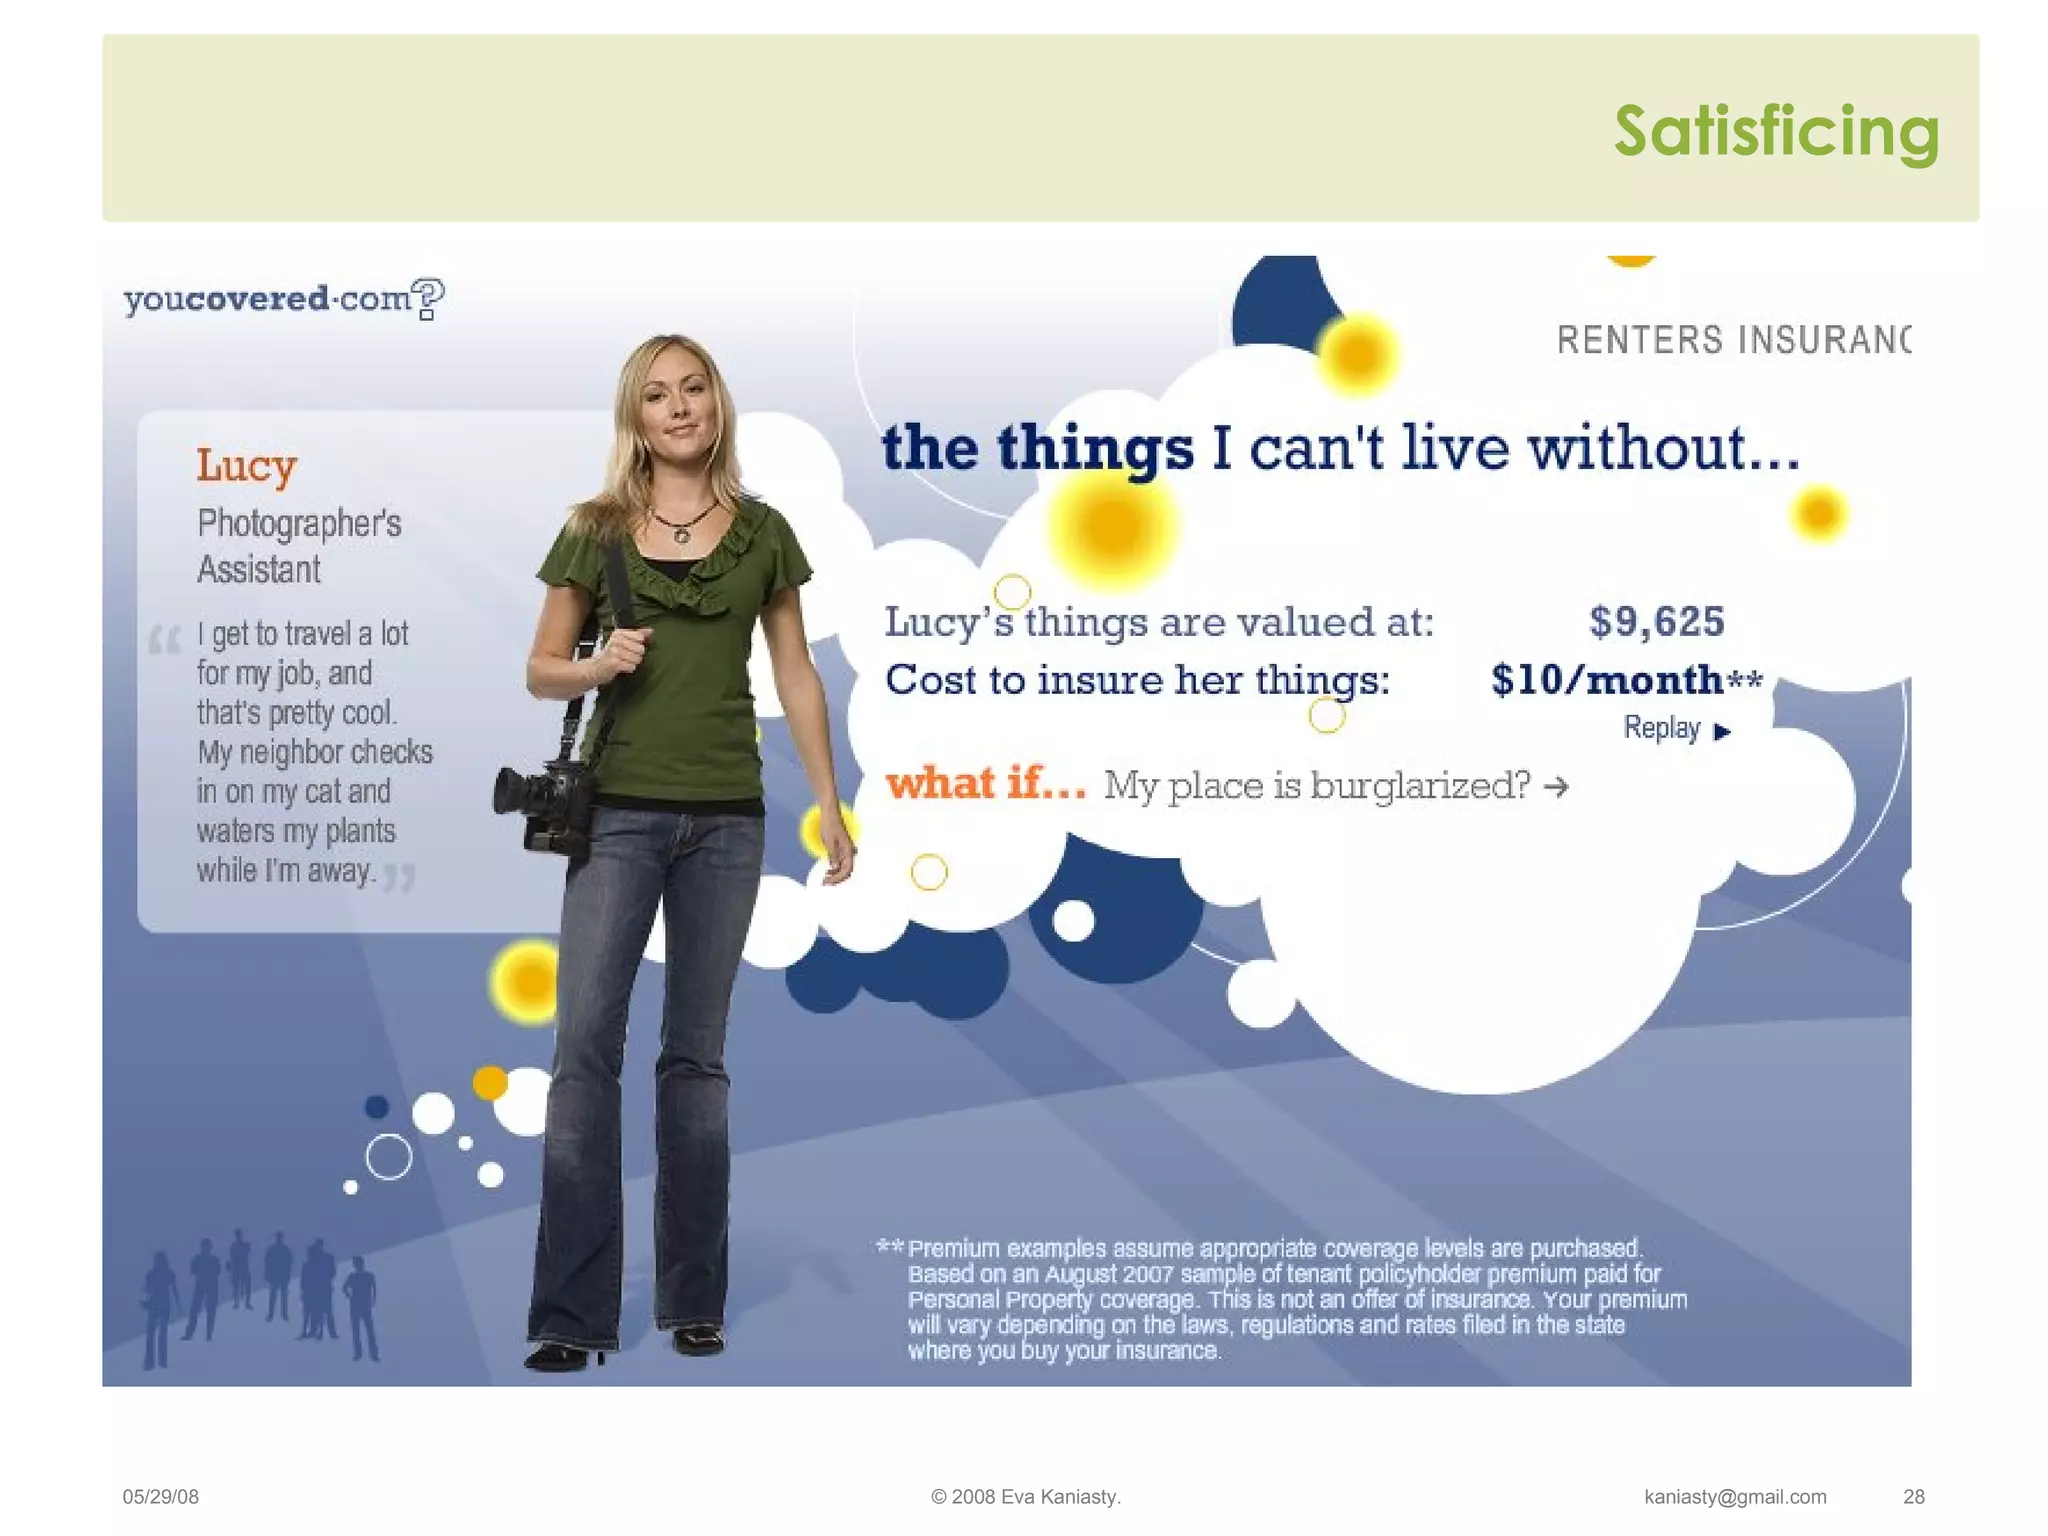
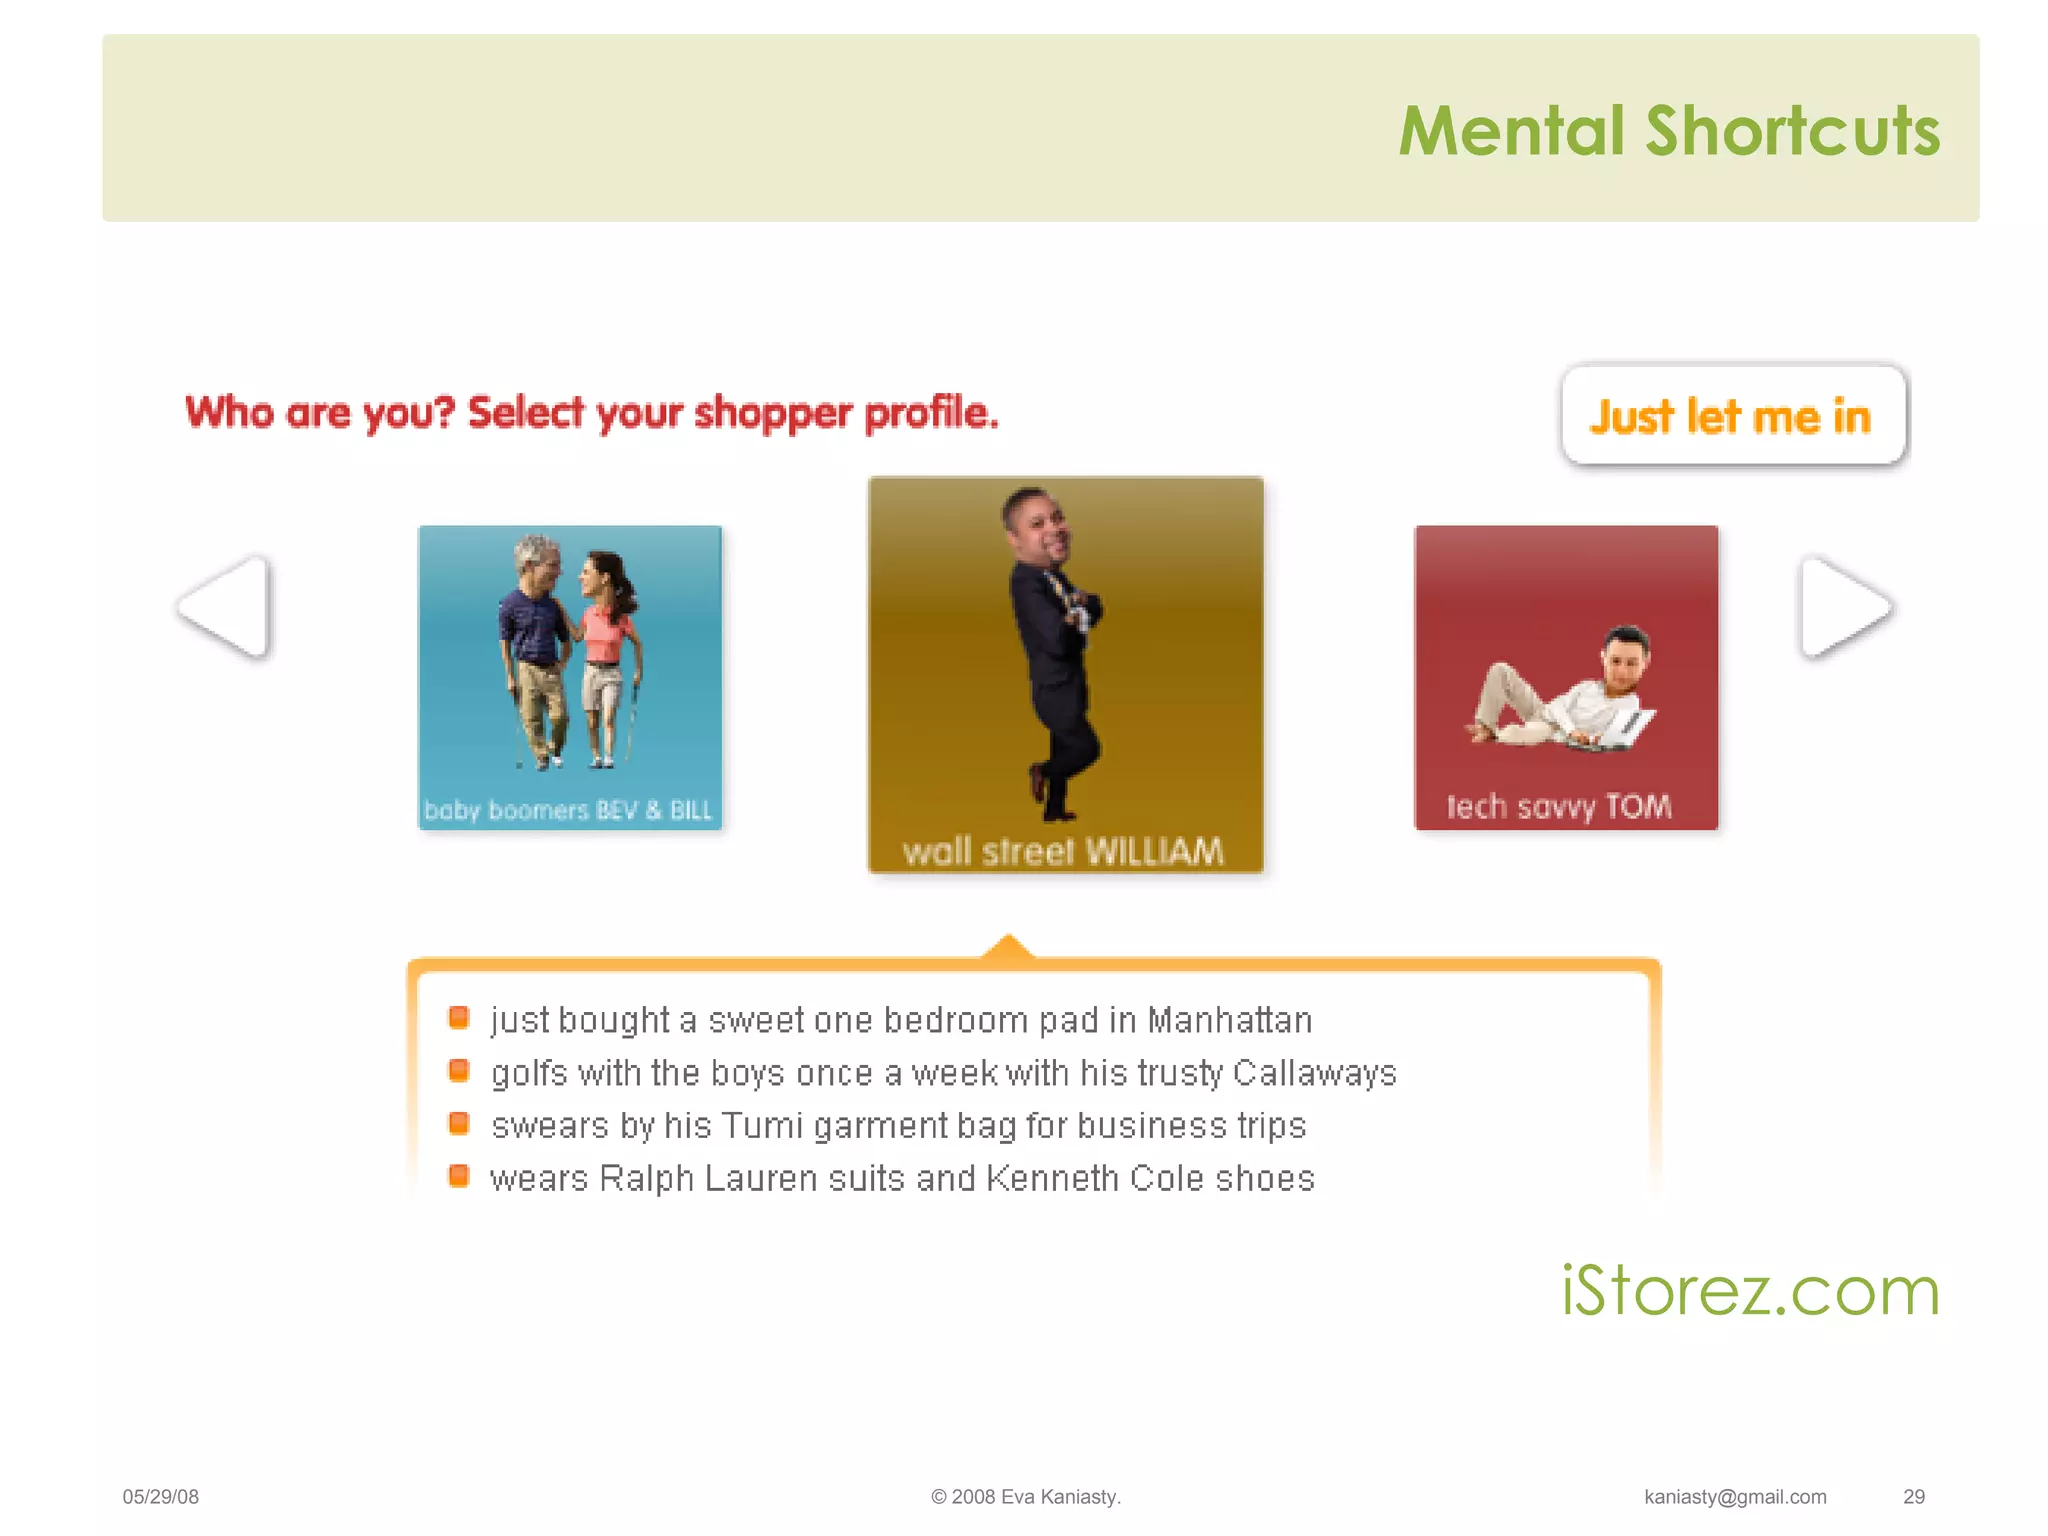
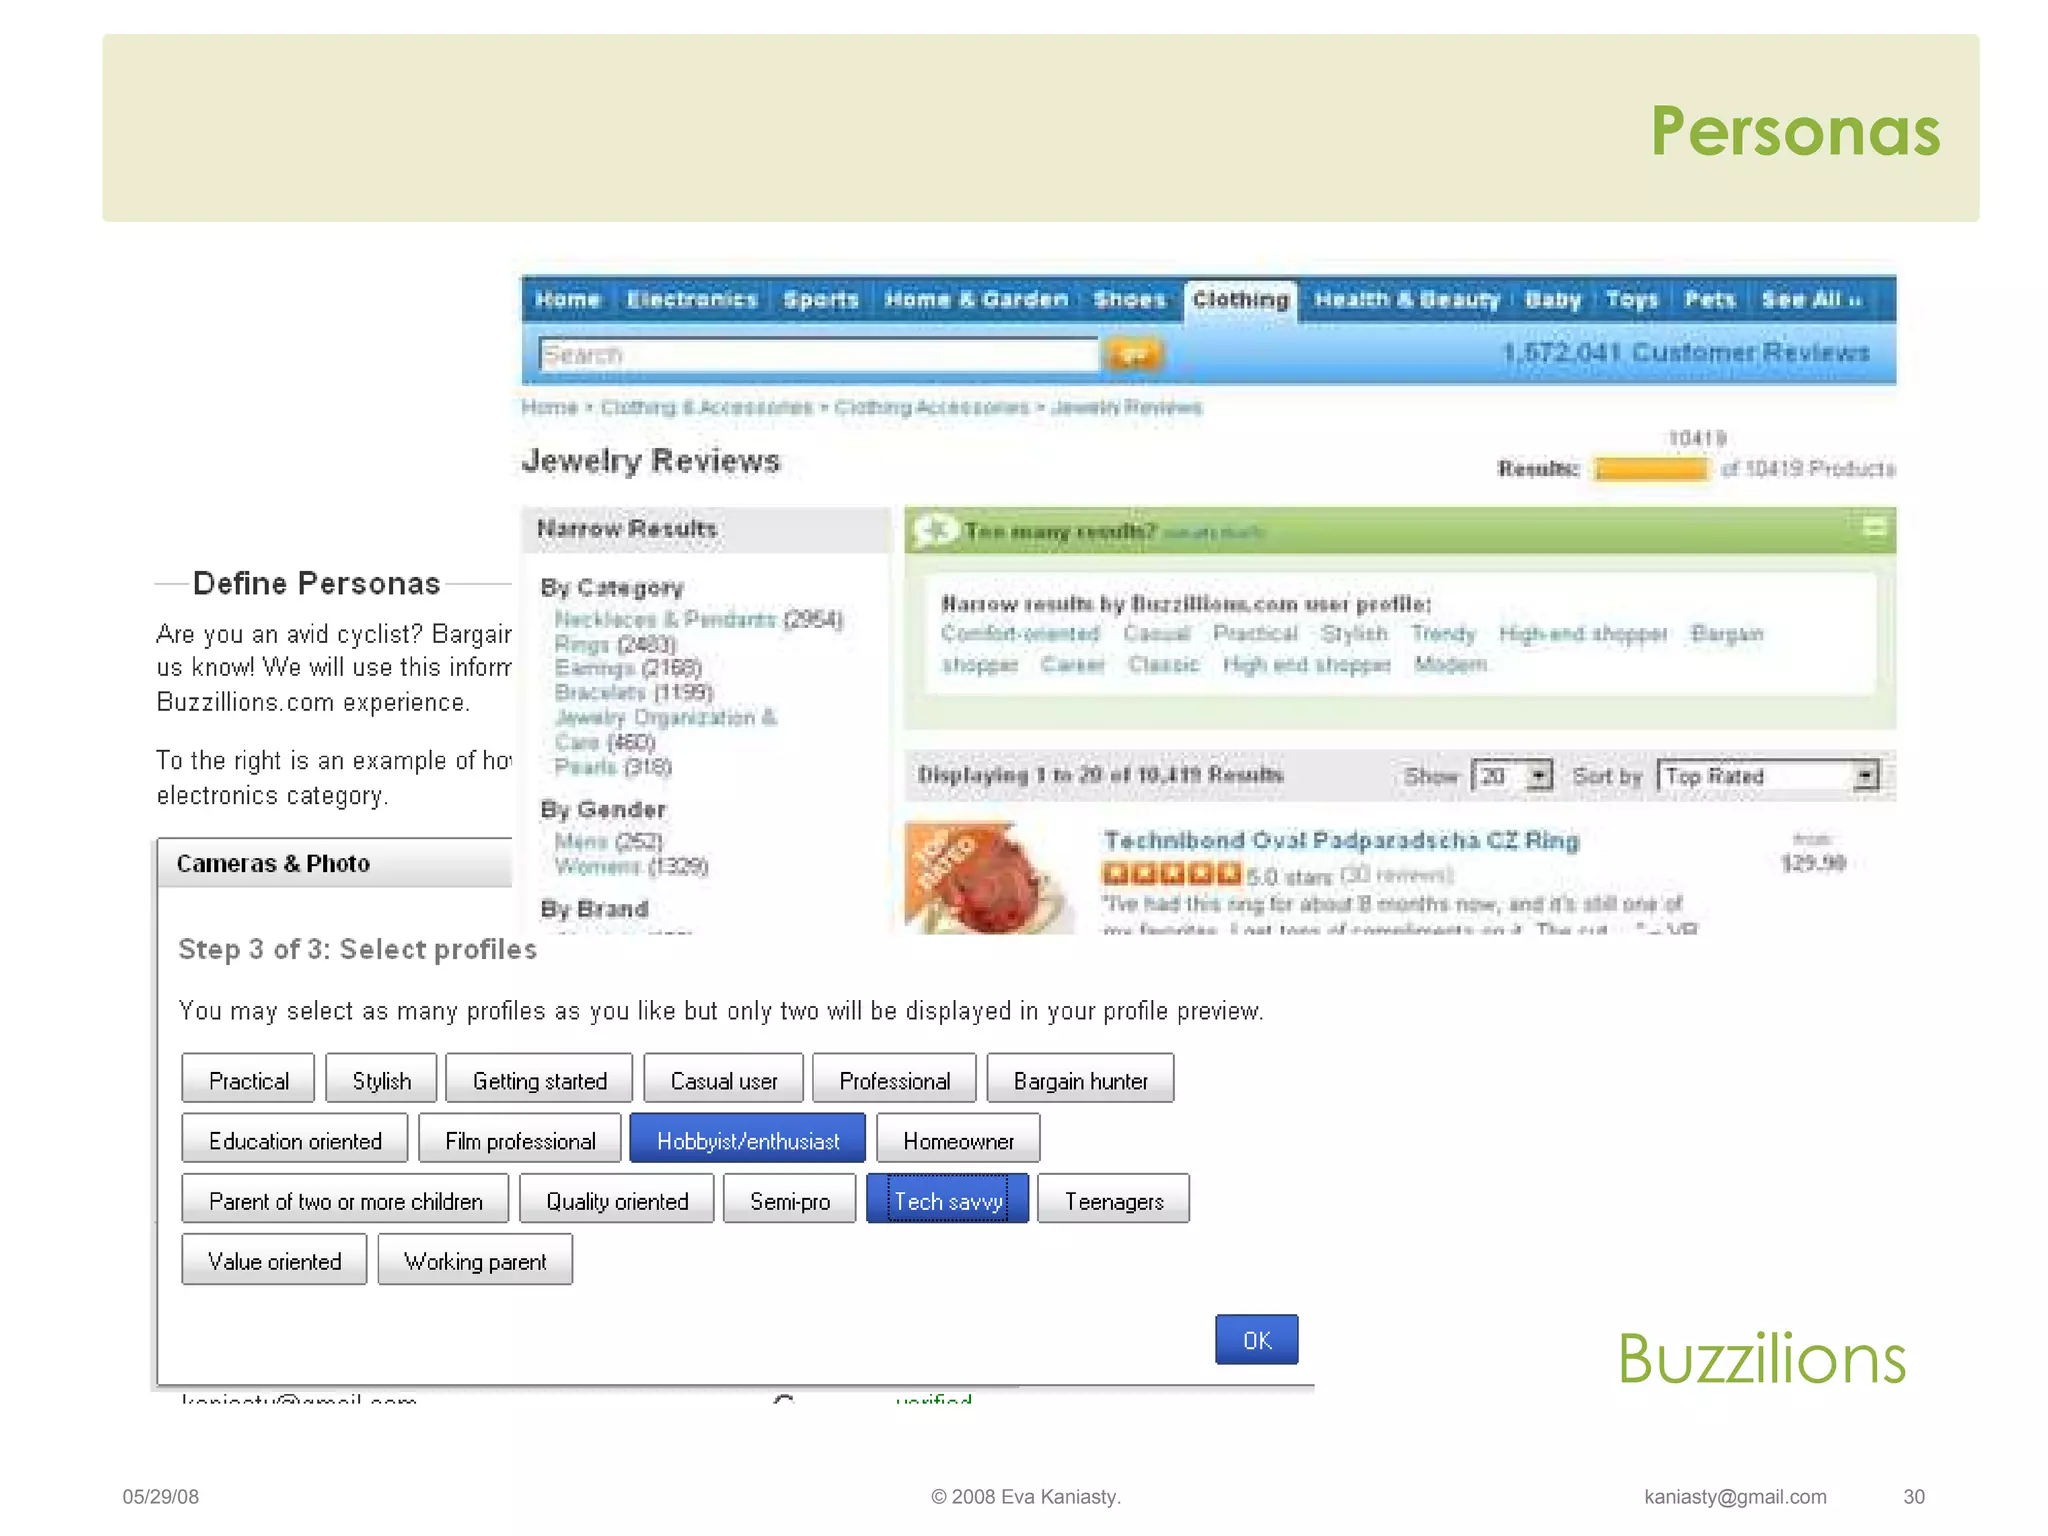
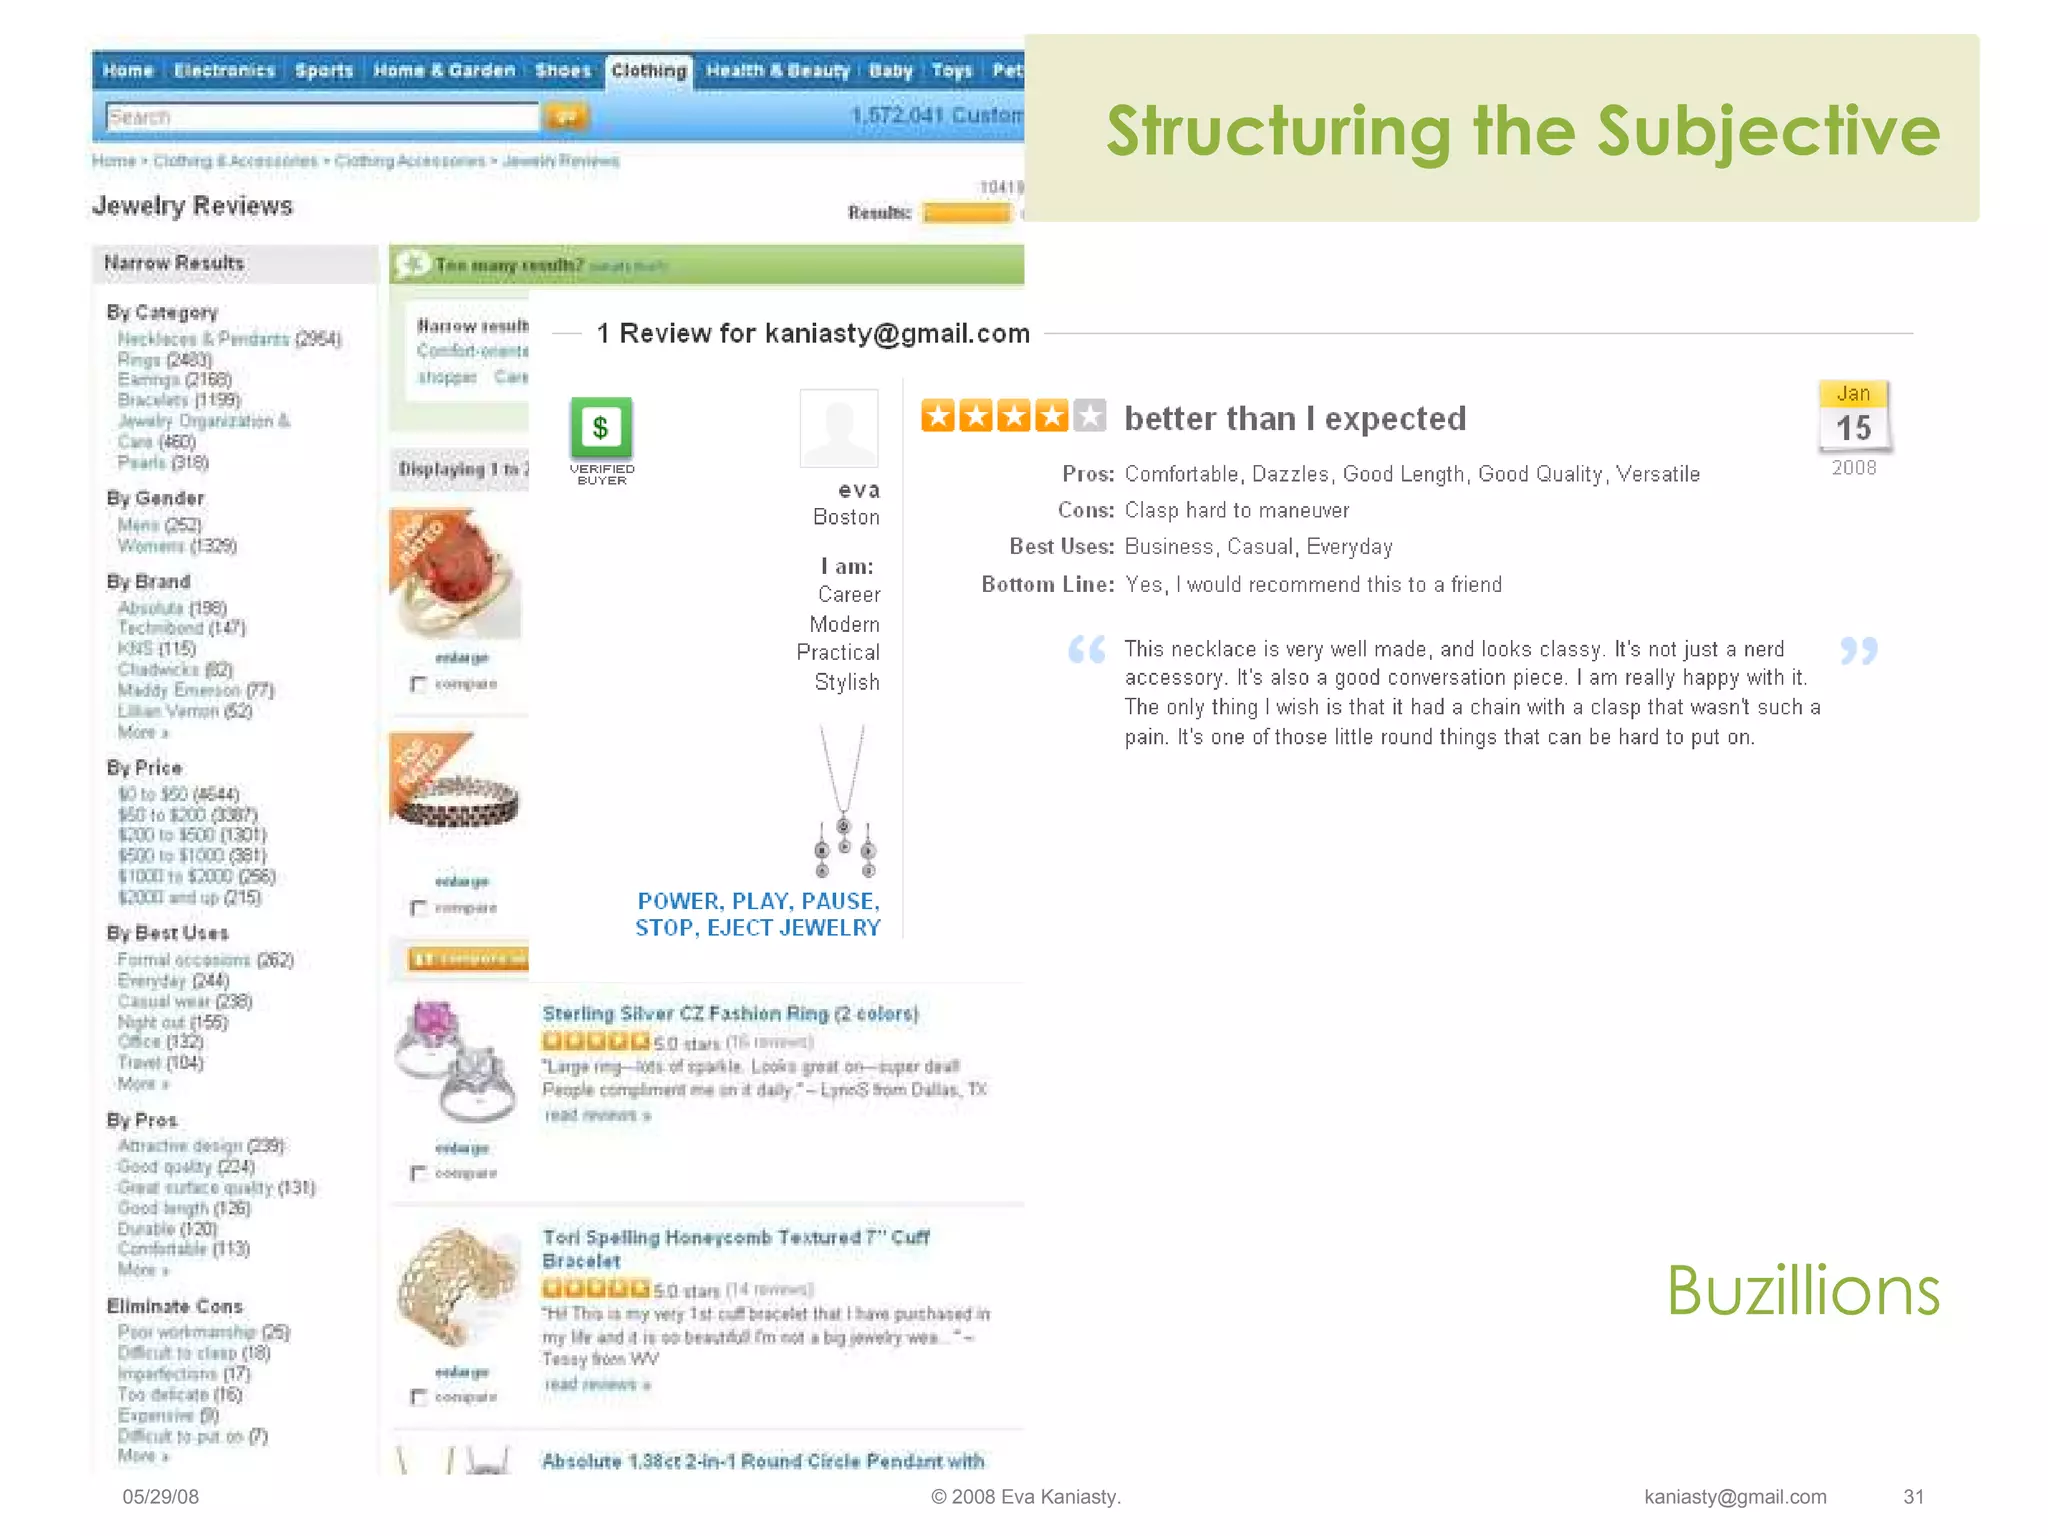
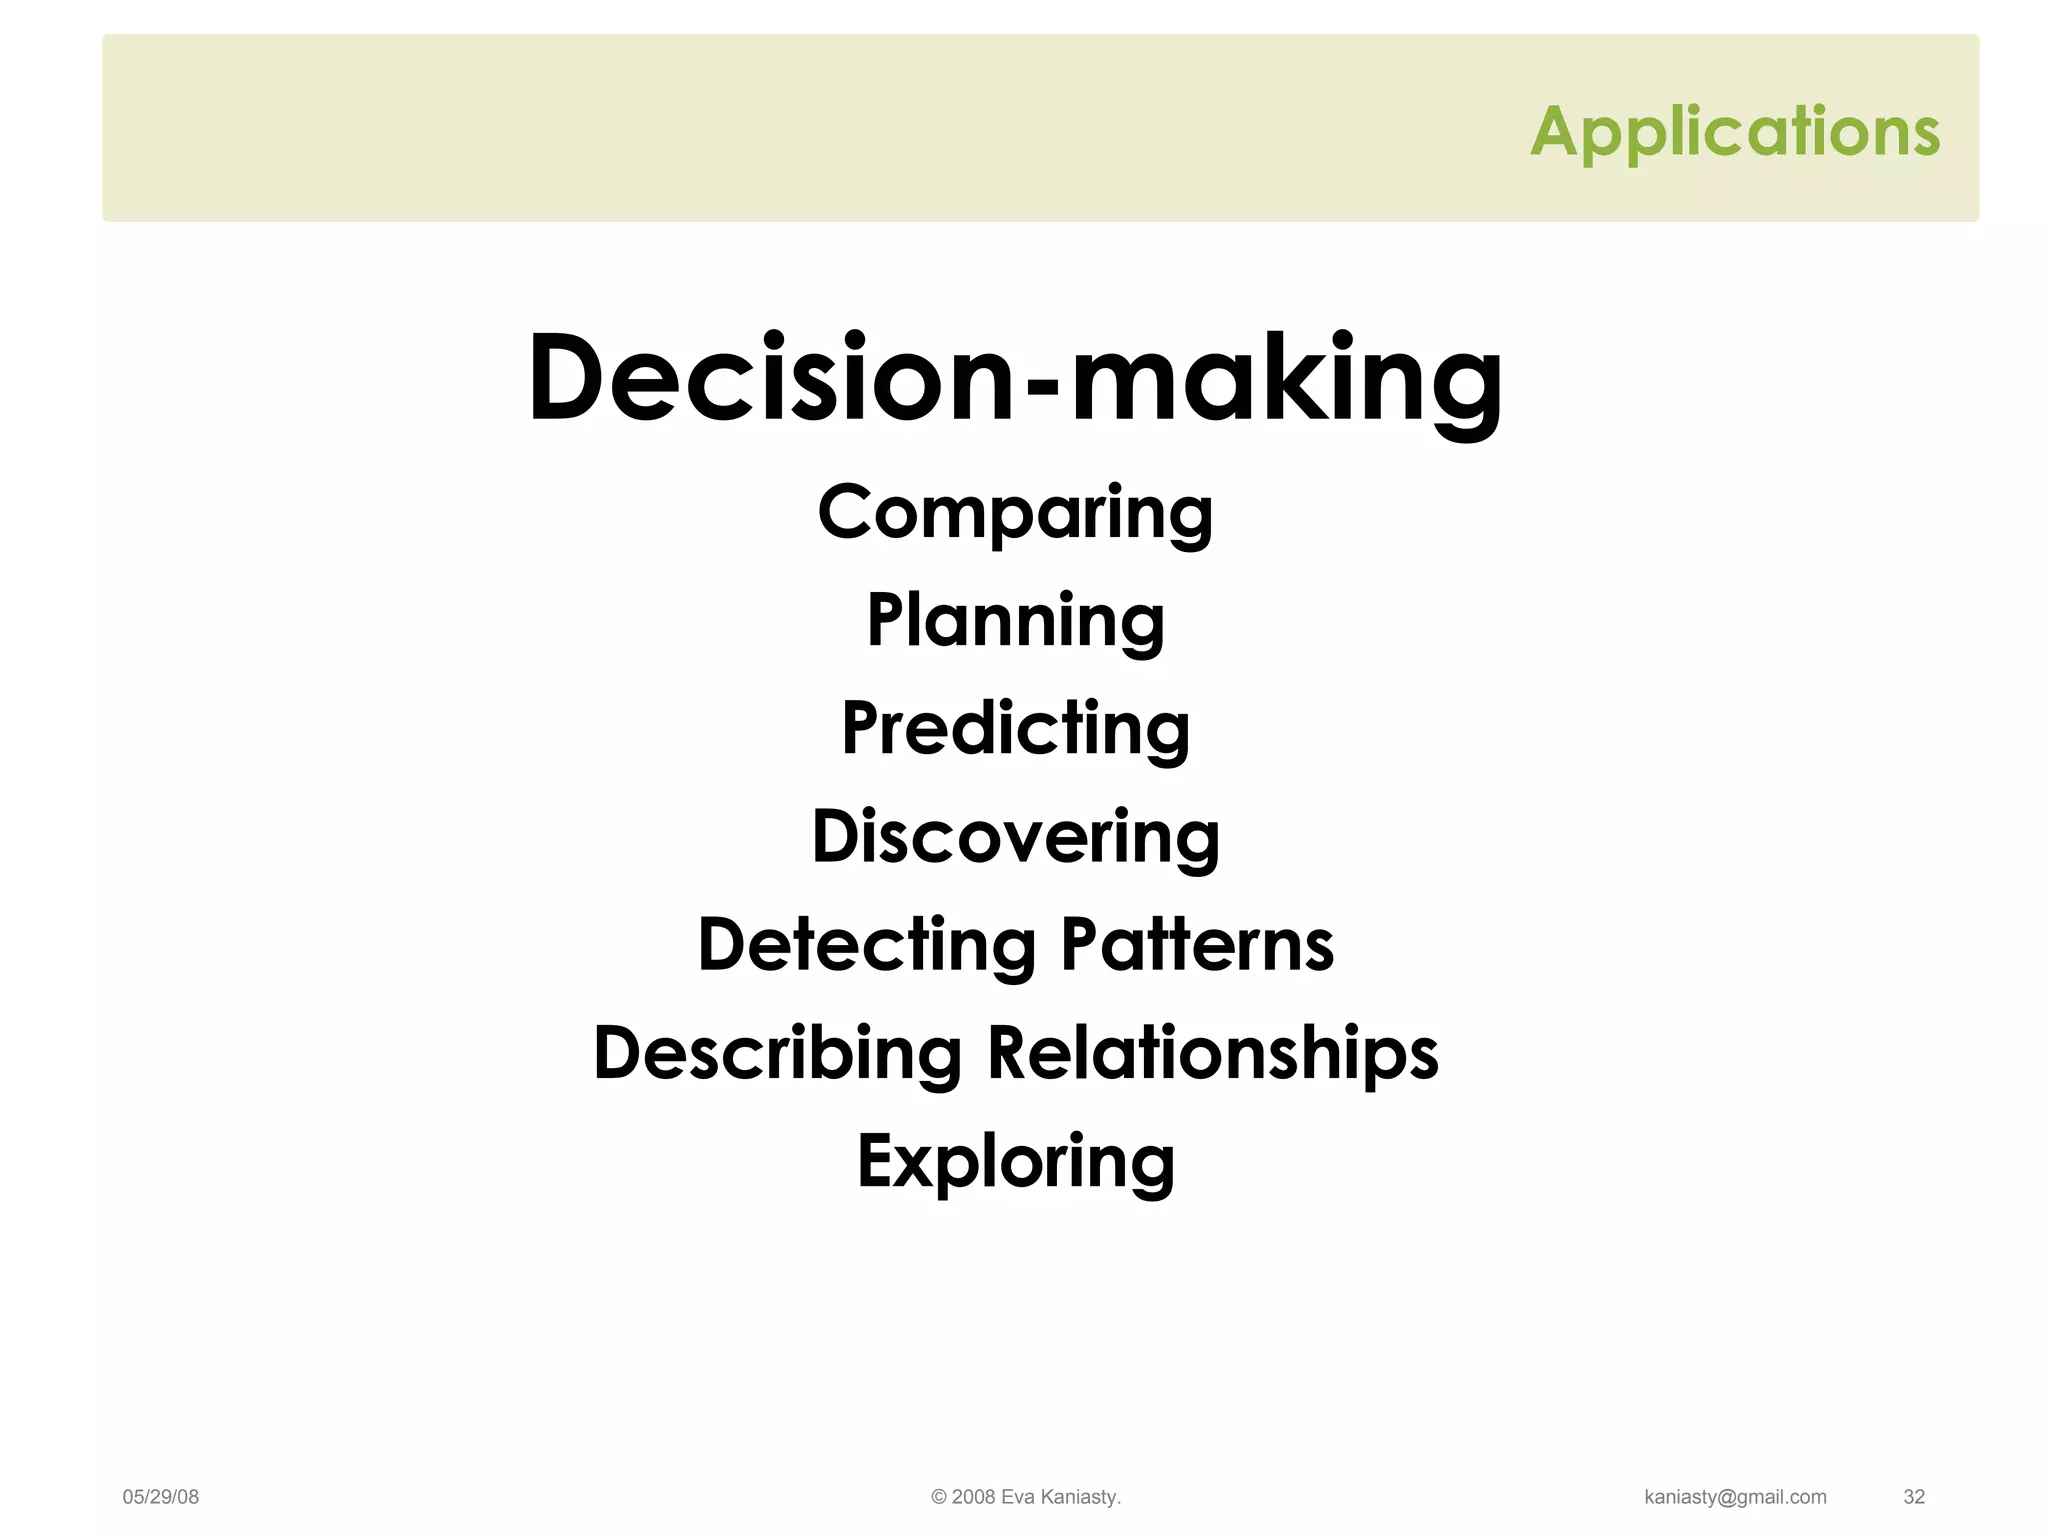

This document discusses the benefits of dynamic data visualization for making sense of large amounts of information. It notes that humans have limited attention, time and domain knowledge, making it difficult to analyze data through serial searching alone. Dynamic visualization allows people to leverage preattentive processing to detect patterns, similarities and anomalies in parallel. The document provides examples of how visualization can be used to gain insight from numbers, words and personal data, aiding in tasks like decision making, planning, discovery and description. It advocates for designing visualizations that are fun and engaging to use.


![Vibe Coding vs. Spec-Driven Development [Free Meetup]](https://cdn.slidesharecdn.com/ss_thumbnails/vibecodingvsspecdrivendevelopment-251209105622-43f455e7-thumbnail.jpg?width=640&height=640&fit=bounds)


