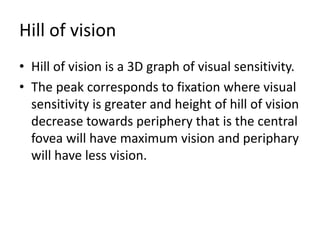
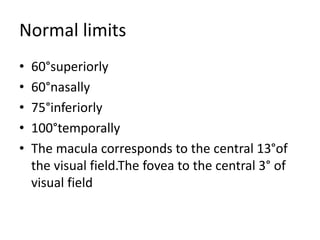
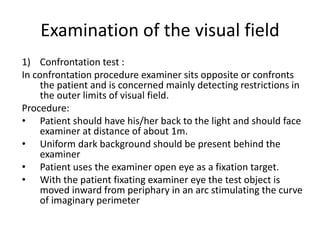
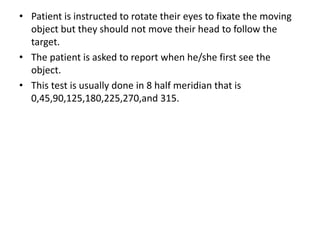
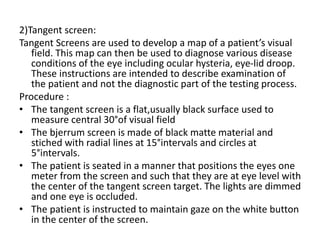
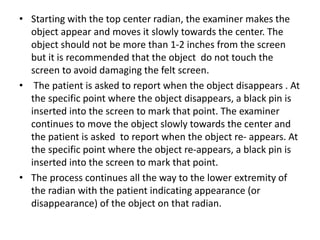
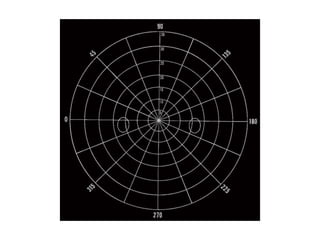
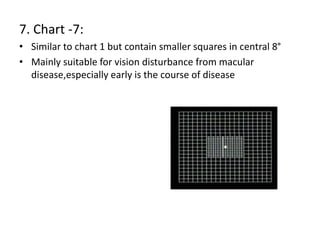
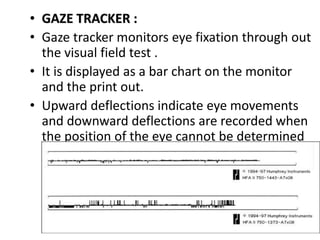
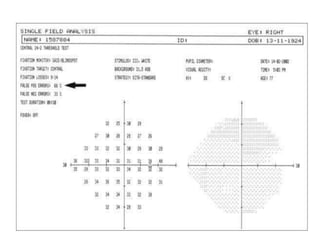
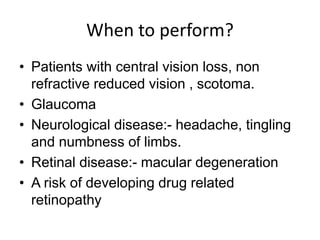
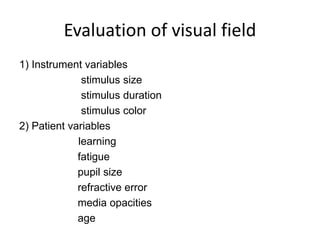
2. Definition
The visual field refers to the total area in which
object can seen in the side vision while you
focus your eyes on a central point
3. Hill of vision
• Hill of vision is a 3D graph of visual sensitivity.
• The peak corresponds to fixation where visual
sensitivity is greater and height of hill of vision
decrease towards periphery that is the central
fovea will have maximum vision and periphary
will have less vision.
4. Normal limits
• 60°superiorly
• 60°nasally
• 75°inferiorly
• 100°temporally
• The macula corresponds to the central 13°of
the visual field.The fovea to the central 3° of
visual field
5. Examination of the visual field
1) Confrontation test :
In confrontation procedure examiner sits opposite or confronts
the patient and is concerned mainly detecting restrictions in
the outer limits of visual field.
Procedure:
• Patient should have his/her back to the light and should face
examiner at distance of about 1m.
• Uniform dark background should be present behind the
examiner
• Patient uses the examiner open eye as a fixation target.
• With the patient fixating examiner eye the test object is
moved inward from periphary in an arc stimulating the curve
of imaginary perimeter
6. • Patient is instructed to rotate their eyes to fixate the moving
object but they should not move their head to follow the
target.
• The patient is asked to report when he/she first see the
object.
• This test is usually done in 8 half meridian that is
0,45,90,125,180,225,270,and 315.
7. 2)Tangent screen:
Tangent Screens are used to develop a map of a patient’s visual
field. This map can then be used to diagnose various disease
conditions of the eye including ocular hysteria, eye-lid droop.
These instructions are intended to describe examination of
the patient and not the diagnostic part of the testing process.
Procedure :
• The tangent screen is a flat,usually black surface used to
measure central 30°of visual field
• The bjerrum screen is made of black matte material and
stiched with radial lines at 15°intervals and circles at
5°intervals.
• The patient is seated in a manner that positions the eyes one
meter from the screen and such that they are at eye level with
the center of the tangent screen target. The lights are dimmed
and one eye is occluded.
• The patient is instructed to maintain gaze on the white button
in the center of the screen.
8. • Starting with the top center radian, the examiner makes the
object appear and moves it slowly towards the center. The
object should not be more than 1-2 inches from the screen
but it is recommended that the object do not touch the
screen to avoid damaging the felt screen.
• The patient is asked to report when the object disappears . At
the specific point where the object disappears, a black pin is
inserted into the screen to mark that point. The examiner
continues to move the object slowly towards the center and
the patient is asked to report when the object re- appears. At
the specific point where the object re-appears, a black pin is
inserted into the screen to mark that point.
• The process continues all the way to the lower extremity of
the radian with the patient indicating appearance (or
disappearance) of the object on that radian.
9.
10. 3)Amsler chart:
• It was designed by marc amsler
• The grid chart evaluates the central 10°visual field
• It is a diagnostic tool that is used mainly in screening
detection and monitoring macular diseases
Procedure :
• Each chart has an overall size of 10cm vertically and
horizontally and each small square measures 5mm in each
direction
• When viewed at a distance of 28-30cm,the entire chart
subtend an angle of 1 degree
There are 7types of amsler chart:
11. 1. Chart-1:
• It is commonly used.It comprises a high
contrast white grid on a black background.
• This is arranged in 20 horizontal and 20
vertical rows making 20 square each
• Used in relative and absolute scotoma
12. 2. Chart 2:
• It is similar to chart 1 but has diagonal lines.
• Used for patient having central scotoma.
• Patient is asked to look where two line would
cross.
13. 3. Chart -3:
• It is a red grid on black background
• Used to investigate scotoma for colour
• This chart can also be used to differentiate patient with
functional vision loss as from malingering with the
conjunction of red- green lenses.
• The red grid may allow detection of artificial monocular field
/vision loss.
14. 4. Chart -4:
• Has white dot on black background
• Designed detect scotomas only
• This chart does not has line to distort instead it consist of
small white dots randomly distributed over a blackground.
15. 5. Chart -5:
• has white parallel lines on the black background
• Lines are oriented horizontally to detect metamorphopsia
resulting from retinal and choroidal disorders
• This design make the chart to rotate the chart to any meridian
to check for irregularities in particular area.
16. 6. Chart – 6:
• Has black parallel lines an white background
• To detect metamorphoria
• Central lines are close together enclosing more detailed
evaluation
17. 7. Chart -7:
• Similar to chart 1 but contain smaller squares in central 8°
• Mainly suitable for vision disturbance from macular
disease,especially early is the course of disease
18. Perimetry :Perimetry is the systematic
measurement of visual field function.
a) Static perimetry:
• Static perimetry tests different locations through
out the field at a time.
• First a dim light is presented at a particular
location
• If the patient does not see the light it is made
gradually brighter until it is seen
• This procedure is then repeated at several other
locations until the entire visual field is tested.
19. b) Kinetic perimetry:
• Kinetic perimetry uses mobile stimulus moved by an
examiner such as in goldmann kinetic perimetry
• Single test light of constant size and brightness is used
• The test light is moved towards the centre of vision
from the periphery until it is first detected by the
patient
• This is repeated by approaching the centre of vision
from different directions
• This procedure is repeated using different test light
that are larger or brighter than the original test light
• It is useful for mapping visual field sensitivity
boundaries.
20. HFA
• The process of measuring the visual field is
known as perimetry, which involves the
mapping of the visual field using a perimeter.
• This is an instrument that enables the
projection of a known visual stimulus at a
fixed distance from the eye within a bowl of
calibrated luminance.
21. • Humphrey field analyser is based on the Swedish
Interactive Threshold Algorithm (SITA).
• The tests 10-2, 24-2, 30-2 can be performed in
either SITA-Fast or SITA-Standard. SITA-Fast is a
quicker method of testing. It produces similar
results compared to SITA-Standard.
• It tests the visual field monocularly with a testing
distance of 30cm.
• The result of the analyser identify the type of
visual field defect.
• It provides information regarding the location of
any disease or lesions in the visual field.
22. RELIABILITY INDICES
There are several reliability indices that are
commonly used to give guidance regarding a
patients performance.
• These include :
1. FIXATION LOSS
2. FALSE POSITIVE
3. FALSE NEGATIVE
23. 1). FIXATION LOSSES (FL) :
• The fixation loss rate provides an estimation of
how steadily an eye fixates during a visual field
test.
• It is recorded when the patient responds to a
stimulus that is projected on to area of there blind
spot.
• If the patient responds positively to the stimulus, it
is assumed that the patient wasn’t fixating
appropriately.
• Fixation losses are flagged frequently when the
blind spot has not been mapped accurately.
• Fixation loss should not exceed more than 30% .
24. • GAZE TRACKER :
• Gaze tracker monitors eye fixation through out
the visual field test .
• It is displayed as a bar chart on the monitor
and the print out.
• Upward deflections indicate eye movements
and downward deflections are recorded when
the position of the eye cannot be determined
or when there was a blink.
25. 2. FALSE POSITIVE:
• It is indicates a “trigger happy” patient who is responding
when no stimulus is presented.
• It is evaluated either by monitoring for responses when
one is not expected or by going through the process of
preventing a target and having the patient respond to the
sound when no target is actually presented.
• Normally false positive should be less than 15% if false
positive is greater than 33% the result should be
discarded and the field test is repeated.
• Other indications include :- high mean sensitivity, white
areas on the grey scale print out and larger defects on
the pattern deviation plot than the total deviation plot.
26. 3. FALSE NEGATIVE :
• False negative errors recorded when the
patient fails to respond to brighter stimulus
(9dB).
• It should be less than 20%
• High false negative scores indicates that the
patient is fatigued, in attentive, malingerer, or
has genuine significant visual field loss and
also in glaucoma patients.
27.
28. SINGLE FIELD ANALYSIS
• The HFA single field analyses is designed to assist in
the interpretations and identification of visual field
defects .
• Along with the patients demographic data and
reliability parameters ,
• It includes:
The sensitivity level for each location in dB.
Grey scale display .
Global indices.
Glaucoma hemifield test.
Total deviation in dB.
Pattern deviation in dB.
29. 1) NUMERICAL DISPLAY:
• It represents raw values of patient’s retinal sensitivities at
specific retinal points in dB.
• Higher numbers equate to higher retinal sensitivities .
• Sensitivity is greater in the central field and decreases
towards the periphery .
• Normal values are approximately 30dB.
2) GREY SCALE:
• A graphical representation of the numerical display allowing
for easy interpretation of the visual field loss .
• Low sensitivities are indicated by the dark area and higher
sensitivities are represented with a lighter tone.
• This scale is used to demonstrate vision changes to the
patient but not used for diagnostic purpose.
30.
31. GLOBAL INDICES
1) MEAN DEVIATION
It is a measure of average sensitivity.
It is useful to monitor the overall change in the visual
field.
It is derived from the total deviation .
A negative value indicates field loss while a positive
value indicates that the field is above average.
p value is given if the global indices is abnormal.
Eg: p<2% , it means less than 2% of the population
has a vision loss worse than measured.
32. 2) PATTERN STANDARD DEVIATION;
• It is derived from pattern deviation.
• It highlights only focal loss.
• It is a measure of the non-uniformity in the
shape of the hill of vision.
3) SHORT TERM FLUCTUATIONS
• It is a measure of the intra test variance.
• It has to be a little clinical value.
• It is not calculated when using SITA.
33. 1) TOTAL DEVIATION :
• It compares the result with an age related normal
population at specific retinal points.
• Negative values indicate lower than normal
sensitivity. Positive values indicate higher sensitivity.
And zero indicate no change.
• The normal range is greatest in the periphery than
centrally.
2) PROBABILITY DISPLAY
• It provides the statistical display that demonstrates
the percentage of normal population who measures
below the patient’s value at specific retinal point.
34. GLAUCOMA HEMIFIELD TEST
• It provides assessment of the visual field
where glaucomatous damage is often seen.
• It compares five corresponding and mirrored
areas in the superior and inferior visual fields.
• The visual field result can be:-
Outside normal limits: significant difference in
superior and inferior fields.
Borderline: suspicious difference.
Within normal limits: no difference.
35.
36.
37. When to perform?
• Patients with central vision loss, non
refractive reduced vision , scotoma.
• Glaucoma
• Neurological disease:- headache, tingling
and numbness of limbs.
• Retinal disease:- macular degeneration
• A risk of developing drug related
retinopathy
38. Evaluation of visual field
1) Instrument variables
stimulus size
stimulus duration
stimulus color
2) Patient variables
learning
fatigue
pupil size
refractive error
media opacities
age