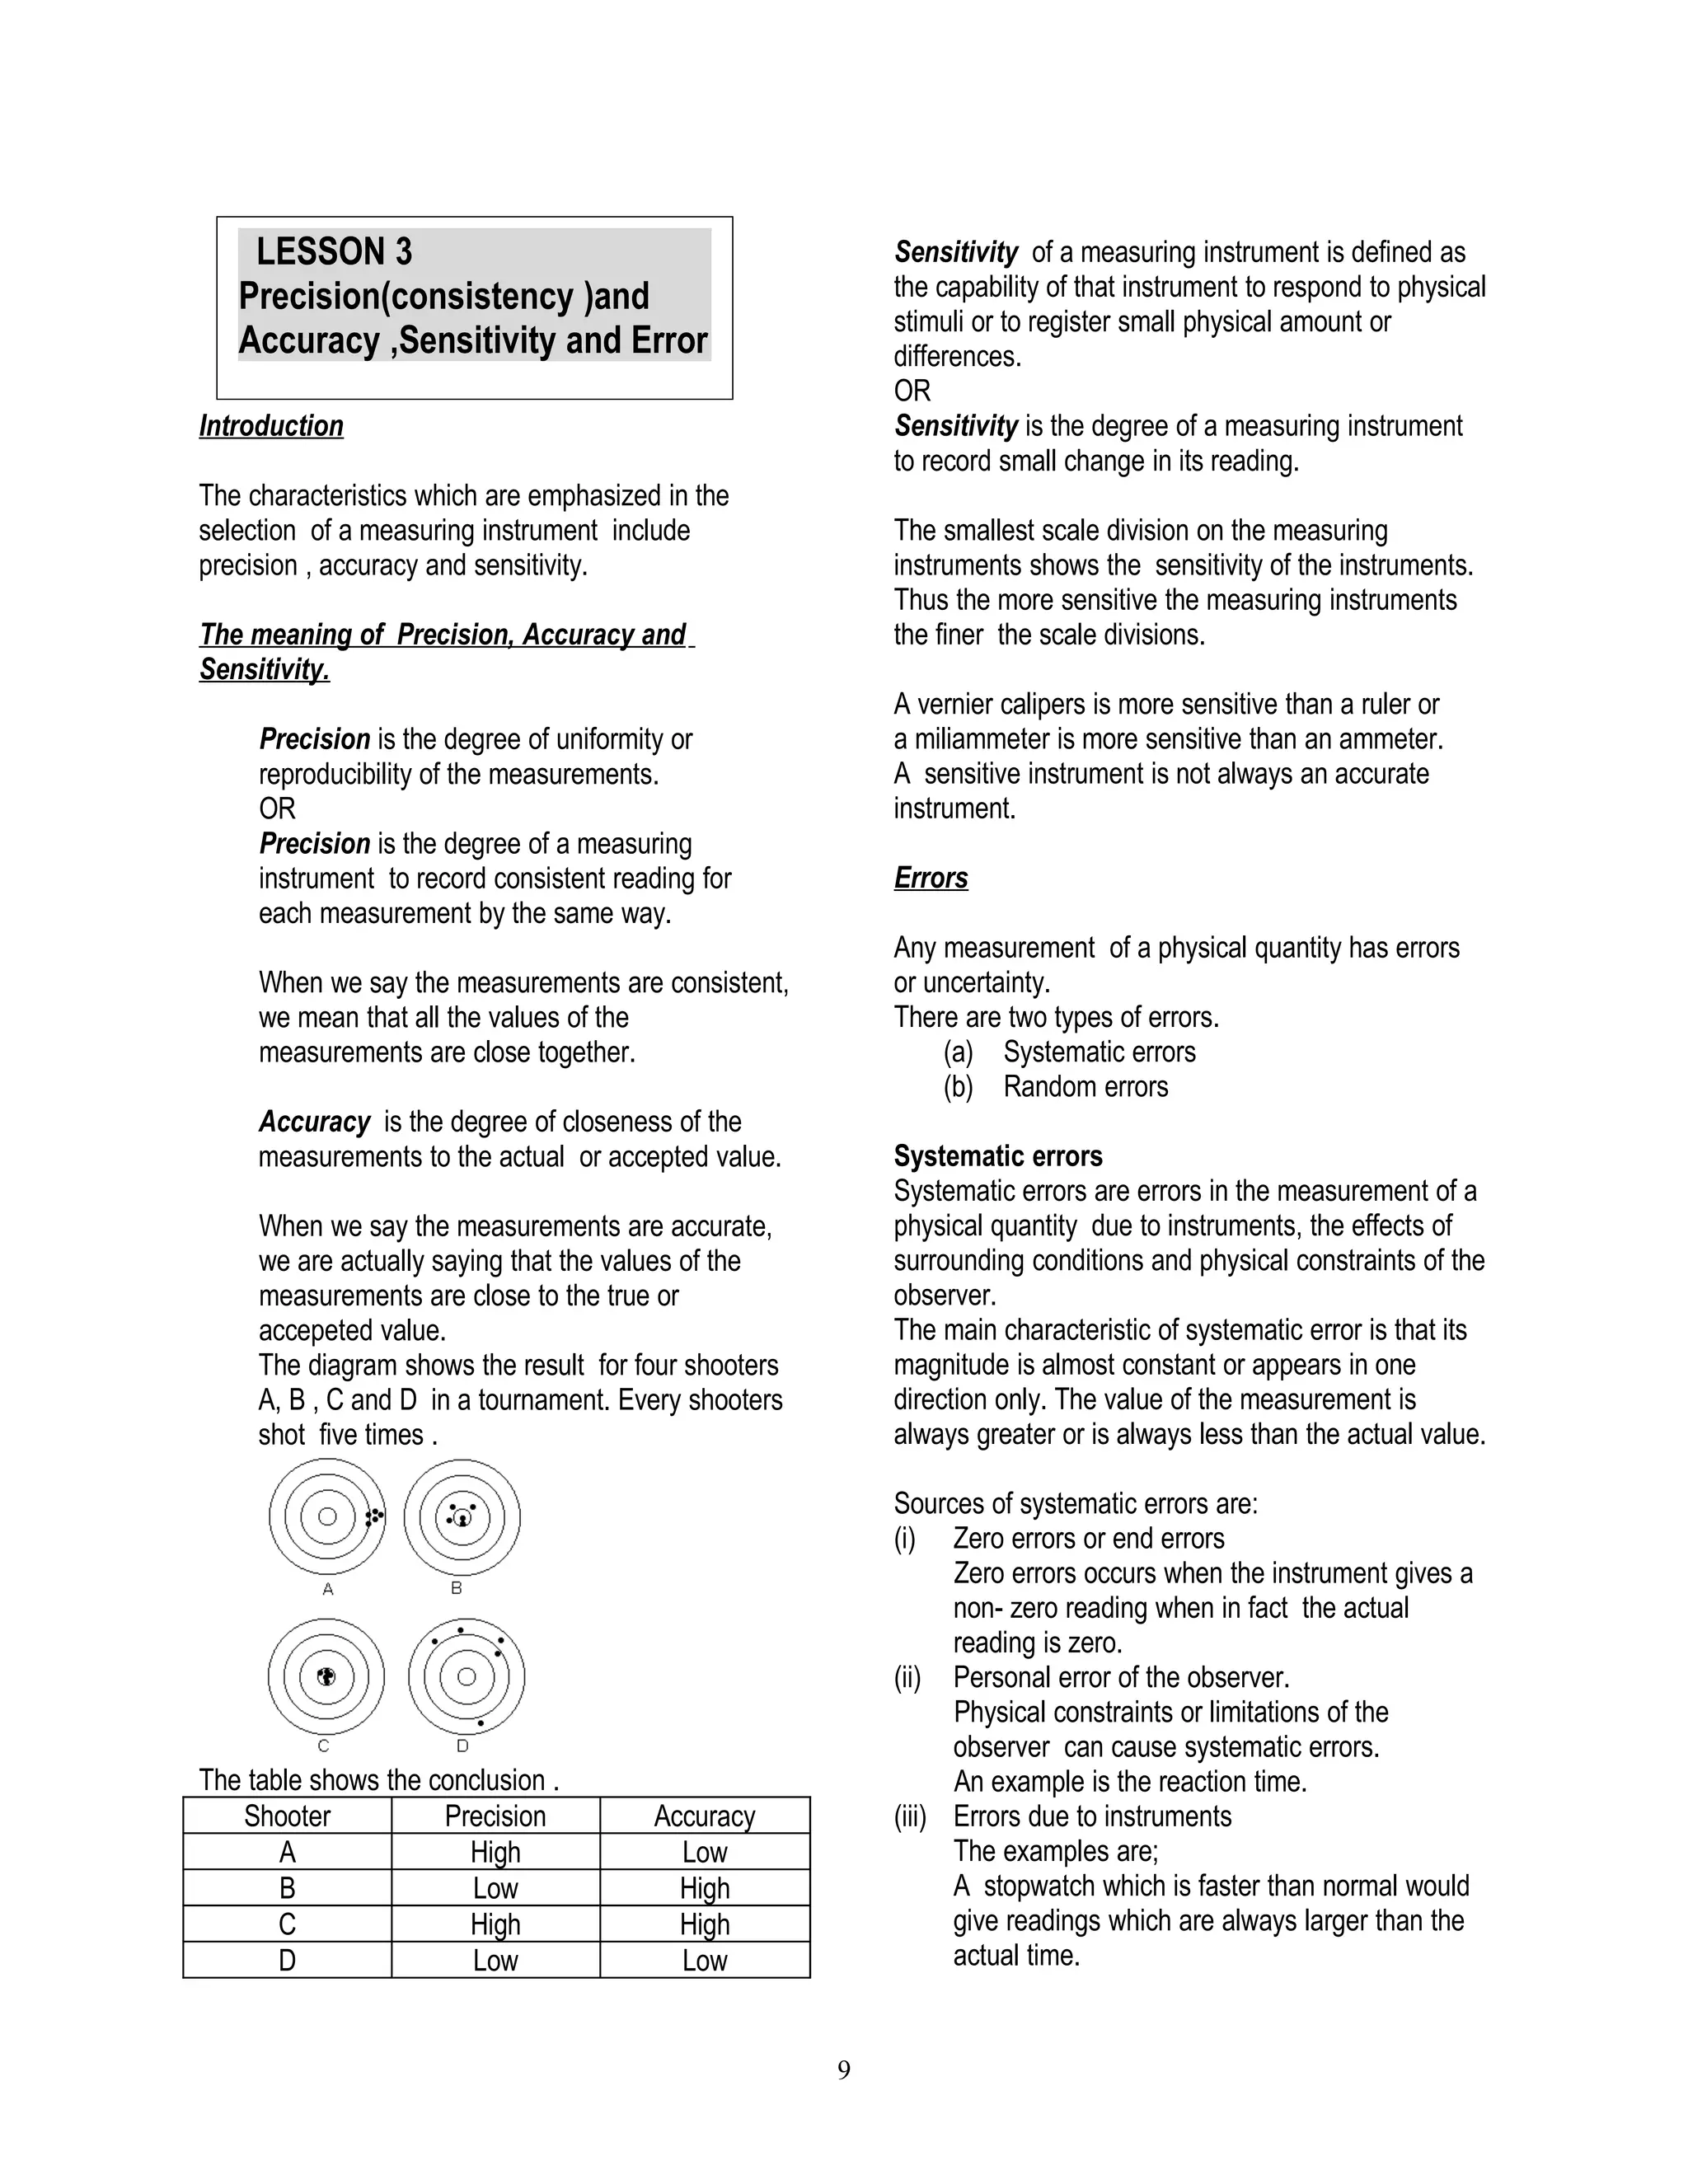
1. The document discusses the characteristics of precision, accuracy, and sensitivity which are important when selecting a measuring instrument.
2. Precision refers to the consistency or reproducibility of measurements, while accuracy refers to how close measurements are to the true or accepted value.
3. Sensitivity is the ability of an instrument to detect small changes in the measured quantity. More sensitive instruments have finer scale divisions and can measure smaller amounts.
The document discusses physical quantities and measurements. It outlines experiments to measure base quantities like length, width, height, diameter, mass and volume of various objects. Derived quantities like density and relative density are then calculated from the base quantities. The experiments aim to obtain derived quantities accurately from base quantities and ensure consistency and accuracy of measurement instruments. Three experiments are described to measure the dimensions and calculate the densities of a wooden block, glass rod, and metal block.
This document discusses sources of error in measurement and the importance of accuracy. It explains that random errors can cause inconsistent readings and averaging repeated measurements can reduce these errors. Common sources of error include instrument errors, non-linear relationships in instruments, errors from reading scales incorrectly, environmental factors, and human errors. Taking the average of multiple readings eliminates random variations between readings and provides a more accurate result.
Absolute and relative error are two types of error that scientists should be familiar with. Absolute error is the physical error in a measurement, while relative error gives an indication of how good a measurement is relative to the size of the thing being measured. Absolute error is calculated as the amount of error, while relative error is calculated as the absolute error divided by the value of the thing measured. This allows comparisons of accuracy between measurements even if the absolute error is the same.
1. The document discusses various concepts related to physical measurements including units, accuracy, precision, errors, and significant figures.
2. It explains different ways to express uncertainty in measurements using either estimated uncertainty with a ± sign or percentage uncertainty. Accuracy refers to how close a measurement is to the true value, while precision refers to the reproducibility of measurements.
3. The document outlines various units used in measurements like meters, kilograms, grams, seconds. It also discusses converting between different units using conversion factors.
This document provides an overview of the DEE1012 measurement course. It outlines the course learning outcomes, which are to apply measurement principles and solve problems using measuring operations and theorems. The document then details several topics that will be covered in the course, including the measurement process, elements of a measurement system, types of errors, measurement terminology, characteristics of measurement, and standards used in measurement. Examples are provided to illustrate key concepts. References are listed at the end.
1) Physics is the study of natural phenomena involving force, matter, and energy. It uses experimental observation and quantitative measurement.
2) There are base quantities like mass, time, and length that cannot be defined by other quantities, and derived quantities like volume and velocity that are calculated from base quantities.
3) Measurements in physics aim for both accuracy, being close to the true value, and consistency, having results that are close together. Instruments have varying levels of sensitivity to allow for small measurements.
This document discusses errors in measurement and different types of errors. It explains that there are five main elements that can cause errors: standards, work pieces, instruments, persons, and environment. There are three types of errors: systematic errors, which occur due to imperfections and are of fixed magnitude; random errors, which occur irregularly; and statistical analysis can be used to analyze random errors through calculations of mean, range, deviation, and standard deviation. Systematic errors include instrumental errors from faulty instruments, environmental errors from external conditions, and observational errors from human factors like parallax.
This document discusses physical measurement and errors in measurement. It defines key terms like measurement, units, observations, and least count. It describes the International System of Units (SI) as the modern metric system. It also discusses different types of errors like absolute error and relative error. Systematic errors can be corrected while random errors are reduced by taking multiple measurements. Accuracy refers to systematic errors while precision describes random errors. The document outlines methods to calculate propagation of errors and statistical treatment of error values.
This document discusses measurement errors and standards. It defines key terms related to measurement accuracy and precision. Accuracy is the closeness of a measurement to the true value, while precision refers to the consistency of repeated measurements. Errors can be absolute or relative. Systematic errors are due to instrument flaws, while random errors have unknown causes. The document also discusses limiting/guarantee errors, which specify the maximum allowed deviation from a component's rated value. Resolution refers to the smallest detectable change in a measurement. Sensitivity is the change in output per unit change in input.
There are three main types of errors in measurement: gross errors due to human mistakes, systematic errors due to issues with instruments or environment, and random errors due to unknown causes. When quantities are calculated from multiple measurements, the total error is determined by combining the individual errors based on the calculation - for addition/subtraction it is the sum of the absolute errors, for multiplication/division it is the sum of the percentage errors, and for powers it is the power multiplied by the percentage error. Proper instrument selection, calibration, and accounting for errors can help reduce systematic and random errors.
Physics is the study of natural phenomena and properties of matter. It involves understanding why hot coffee turns cold over time and how images are formed in mirrors. Key concepts in physics include forces, pressure, waves, electromagnetism, and physical quantities which are measured using instruments with varying levels of sensitivity, accuracy, and consistency. Sources of experimental error include zero errors, incorrect calibration, parallax errors, and inconsistent techniques.
This document discusses measurement errors and uncertainty. It defines measurement as assigning a number and unit to a property using an instrument. Error is the difference between the measured value and true value. There are two main types of error: random error, which varies unpredictably, and systematic error, which remains constant or varies predictably. Sources of error include the measuring instrument and technique used. Uncertainty is the doubt about a measurement and is quantified with an interval and confidence level, such as 20 cm ±1 cm at 95% confidence. Uncertainty is important for tasks like calibration where it must be reported.
The document discusses measurement errors and standards. It defines key terms like instruments, measurements, standards, and different types of errors. It explains absolute and relative errors, accuracy, precision and resolution. It discusses sources of errors like gross errors, systematic errors from instruments and environment, and random errors. Finally, it categorizes measurement standards into international, primary, secondary and working standards based on their accuracy and purpose.
This document provides an introduction to physics, covering several key topics:
- The main areas of physics are mechanics, thermodynamics, vibrations and waves, optics, electromagnetism, relativity, and quantum mechanics.
- Dimensional analysis is used to determine whether equations are valid by checking that quantities with the same dimensions can be combined and that both sides of an equation have the same dimensions.
- Symbols like Δ, Σ, g, x are commonly used in physics equations to represent concepts like change, sum, gravitational acceleration, and displacement.
- Random uncertainties arise from imprecision in measurements and can cause readings to be above or below the true value. They can be reduced by more precise instruments or repeating measurements.
- Systematic uncertainties result in all readings being consistently too high or too low. They may be due to instrumentation errors or experimental technique and can sometimes be addressed through calibration.
- Uncertainty is incorporated into measurements as a range rather than a single value, and it is important to propagate uncertainties through calculations.
This is a lecture note on Error and its propagation. This slide can be very much useful for As level physics students. It is totally different from the presentation. I would like to name it as slides of lecture notes on Error(uncertainty), difference on precision and accuracy, difference on two types of error (systematic and random errors). Believe me it will help you to enhance your knowledge on Uncertainty and its propagarion.
There are two main types of errors in measurement: systematic errors, which always produce results in the same direction, and random errors, which occur unpredictably due to various factors. The accuracy of a measurement indicates how close it is to the accepted value, while the precision refers to the agreement between multiple measurements of the same quantity. Taking the average of repeated measurements reduces the impact of random errors, but the uncertainty in any measurement must be reported using plus-and-minus values to indicate the possible variance.
The document discusses the metric system and its use and conversions. It explains that most countries use the metric system, and it is needed for international scientific communication. It then provides examples of metric length conversions and what units are used to measure mass, volume, and length. Finally, it demonstrates the "staircase method" for converting between metric units by moving the decimal place right or left the appropriate number of steps.
This document discusses different types of errors in experimental measurements and calculations. It describes random errors, which vary unpredictably, and systematic errors, which are consistent biases. Random errors can be reduced by taking more trials, while systematic errors must be accounted for. Mistakes are distinguished from errors. Significant figures rules for measurements and calculations are explained. The concepts of uncertainty, including limits of reading, degrees of uncertainty, absolute and relative uncertainty, and uncertainty propagation through calculations, are introduced.
Measurement errors, Statistical Analysis, UncertaintyDr Naim R Kidwai
The Presentation covers Measurement Errors and types, Gross error, systematic error, absolute error and relative error, accuracy, precision, resolution and significant figures, Measurement error combination, basics of statistical analysis, uncertainty, Gaussian Curve, Meaning of Ranges
The document discusses different types of errors that can occur in measurement. It describes gross errors, systematic errors like instrumental errors and environmental errors, and random errors. It also defines key terms used to analyze errors like limit of reading, greatest possible error, and discusses analyzing measurement data using statistical methods like the mean, standard deviation, variance and histograms. Measurement errors can occur due to issues like parallax, calibration, limits of the measuring device, and are analyzed statistically.
This document discusses uncertainties and errors in physical measurements. It explains that there are two types of errors - random errors which are unpredictable, and systematic errors caused by imperfect measuring equipment. Random errors can be reduced by repeating measurements, while systematic errors are reduced by calibrating equipment. Accuracy refers to how close a measurement is to the true value, while precision refers to how close repeated measurements are. The number of significant figures reported in a result should not exceed the least precise value used. The document also discusses determining and expressing uncertainties in measurements, and how to combine uncertainties when performing calculations or graphing data.
This document discusses how to write uncertainties with measured data. It explains that uncertainties are written with the symbol "±" and provides examples. It outlines the two types of uncertainties - absolute and fractional. Absolute uncertainties are simply added when adding or subtracting quantities, while fractional uncertainties are added when multiplying or dividing quantities. Fractional uncertainties are calculated by dividing the absolute uncertainty by the measured value.
Diploma sem 2 applied science physics-unit 1-chap 2 error sRai University
This document discusses various types of errors that can occur in measurements. It describes instrumental error, observer error, and procedural error as the three main sources of uncertainty. It also defines accuracy as a measure of how close a measurement is to the accepted value, while precision refers to the closeness of repeated measurements. The document provides examples of calculating percentage error, relative error, and discusses significant figures when taking measurements.
1. Physics is the study of matter and energy, including topics like general physics, thermal physics, light and waves, and electricity and magnetism.
2. There are 7 base quantities in physics that all other quantities can be derived from, each with their own base SI units. Instruments are used to measure lengths, diameters, and thicknesses with varying precision.
3. Common instruments for measuring length include meter sticks, tapes, calipers, micrometers, and vernier calipers. Time intervals are measured using clocks, stopwatches, and the period of a pendulum's swing. Care must be taken to avoid errors in measurements.
I split the presentation for the unit into two, as I added so many slides to help with student questions and misconceptions. This one focuses on mathematical aspects of the unit.
1. This document discusses various physics concepts including base and derived quantities, prefixes, scientific notation, scalar and vector quantities, measurements and errors, and scientific investigation.
2. It defines derived quantities as those derived from base quantities through multiplication or division, and provides examples of speed being derived from distance and time. Prefixes are used to represent very small and large SI units.
3. Scientific notation, also called standard index notation, is used to write very small or large numbers as the product of a number between 1 and 10 and a power of 10, making the numbers neat and easy to read.
EXPERT SYSTEMS AND SOLUTIONS
Project Center For Research in Power Electronics and Power Systems
IEEE 2010 , IEEE 2011 BASED PROJECTS FOR FINAL YEAR STUDENTS OF B.E
Email: expertsyssol@gmail.com,
Cell: +919952749533, +918608603634
www.researchprojects.info
OMR, CHENNAI
IEEE based Projects For
Final year students of B.E in
EEE, ECE, EIE,CSE
M.E (Power Systems)
M.E (Applied Electronics)
M.E (Power Electronics)
Ph.D Electrical and Electronics.
Training
Students can assemble their hardware in our Research labs. Experts will be guiding the projects.
EXPERT GUIDANCE IN POWER SYSTEMS POWER ELECTRONICS
We provide guidance and codes for the for the following power systems areas.
1. Deregulated Systems,
2. Wind power Generation and Grid connection
3. Unit commitment
4. Economic Dispatch using AI methods
5. Voltage stability
6. FLC Control
7. Transformer Fault Identifications
8. SCADA - Power system Automation
we provide guidance and codes for the for the following power Electronics areas.
1. Three phase inverter and converters
2. Buck Boost Converter
3. Matrix Converter
4. Inverter and converter topologies
5. Fuzzy based control of Electric Drives.
6. Optimal design of Electrical Machines
7. BLDC and SR motor Drives
1) The document discusses various concepts related to measurement principles including accuracy, precision, resolution, sensitivity and error.
2) It describes different types of errors like gross error, systematic error and random error. Systematic error includes instrumental, environmental and observational errors.
3) Accuracy refers to the closeness of a measurement to the true value. Precision refers to the consistency of repeated measurements. Accuracy and precision are related but distinct measures of measurement quality.
Scalar quantities have magnitude only, such as length, time, temperature. Vector quantities have both magnitude and direction, such as displacement, velocity, force.
There are two main types of errors in measurement - systematic errors and random errors. Systematic errors consistently shift measurements in one direction, such as zero errors or calibration errors. Random errors vary unpredictably between measurements, caused by factors like human error or environmental changes. Precision refers to the consistency of measurements while accuracy refers to how close measurements are to the true value.
This document discusses concepts related to measurement including direct and indirect measurement methods, classification of instruments, errors in measurement, and calibration. It defines key terms such as measurement, accuracy, sensitivity, and calibration. It describes the elements of a measurement system including the primary sensing element, variable conversion element, and data presentation element. It also covers static characteristics such as accuracy, sensitivity, and dynamic response characteristics.
This document discusses concepts related to measurement including direct and indirect measurement methods, types of instruments, characteristics of measurement systems, errors in measurement, and calibration. It defines key terms like measurement, accuracy, sensitivity, static and dynamic errors. Measurement systems have elements like primary sensing, variable conversion and data presentation. Characteristics include accuracy, sensitivity, reproducibility, speed of response and fidelity. Errors can be gross, systematic, random or residual. Calibration checks instruments against a known standard.
This document discusses concepts related to measurement including direct and indirect measurement methods, classification of instruments, errors in measurement, and calibration. It defines key terms like measurement, accuracy, sensitivity, and calibration. Measurement instruments are classified as mechanical, electrical, or electronic. Errors are categorized as gross, systematic, or random. The document also covers topics like mean, standard deviation, and probable error for measurement data analysis.
This document discusses various concepts related to measurement and instrumentation. It covers topics like direct and indirect measurement methods, classification of instruments, errors in measurement, calibration, and standards. The key points are:
1) Measurements involve comparing an unknown quantity to a standard using an instrument. Direct methods compare the measurand directly to the standard, while indirect methods use intermediate steps.
2) Instruments can be classified as mechanical, electrical, or electronic based on their operating principles. Other classifications include absolute or secondary, deflection or null type.
3) Errors in measurement are grouped as gross, systematic, and random. Systematic errors come from issues with the instrument, environment, or observer.
4)
This document discusses types of errors, accuracy, sensitivity, resolution, and linearity in measurements. It defines random error, systematic error including environmental, instrumental and observational errors. Gross errors are discussed. Accuracy is defined as closeness to a true value. Sensitivity is a measure of output change for input change. Resolution is the ability to detect small changes. Linearity refers to how measurement bias is affected by the measurement range. First order response reaches steady state for a step input. Second order response can oscillate to a step input due to overshoot and damping effects.
This document discusses measurement and uncertainties in the SI system of units. It describes the fundamental SI units of length, mass, time, electric current, temperature, and amount of substance. Derived quantities are those involving two or more fundamental units, with derived units having specific names and symbols. Standards for the metre, kilogram and second are defined. Conversion between units is explained. Errors can be random or systematic. Random errors decrease with multiple measurements but systematic errors do not. Accuracy refers to closeness to the accepted value while precision refers to the agreement between measurements. The limit of reading and degree of uncertainty are defined. Methods to reduce random uncertainties include taking multiple readings and calculating the mean and absolute error. Absolute, fractional and percentage uncertainties are
This document discusses and defines the static and dynamic characteristics of measurement systems. Static characteristics include accuracy, precision, sensitivity, linearity, reproducibility, repeatability, resolution, threshold, drift, stability, tolerance, and range. Dynamic characteristics include speed of response, measuring lag, fidelity, and dynamic error. Accuracy describes how close a measurement is to the true value, while precision refers to the reproducibility and consistency of measurements. Sensitivity is the smallest change a system can detect, and resolution is the minimum detectable increment of change.
The document discusses various methods of measurement used in mechanical engineering. It describes 6 main methods: direct, indirect, comparative, coincidence, deflection, and complementary. The direct method involves measuring a quantity directly using instruments like calipers or micrometers. The indirect method measures related quantities using transducers. Other methods compare an unknown quantity to a standard, detect small differences through alignment, indicate values through deflection, or determine a quantity by combination with a known value. The document also defines key terms in measurement like accuracy, precision, sensitivity, and calibration, and discusses sources of error.
This document discusses experimental errors in scientific measurements. It defines experimental error as the difference between a measured value and the true value. Experimental errors can be classified as systematic errors or random errors. Systematic errors affect accuracy and can result from faulty instruments, while random errors affect precision and arise from unpredictable fluctuations. The document also discusses ways to quantify and describe experimental errors, including percent error, percent difference, mean, and significant figures. Understanding experimental errors is important for analyzing measurement uncertainties and improving experimental design.
Static and dynamic_characteristics_of_measurement_systemPrabhaMaheswariM
The document discusses the static and dynamic characteristics of measurement systems. Static characteristics include accuracy, precision, sensitivity, linearity, reproducibility, repeatability, resolution, threshold, drift, stability, tolerance, and range. These define how instruments measure quantities that do not vary much over time. Dynamic characteristics include speed of response, measuring lag, fidelity, and dynamic error, and describe how instruments respond to rapidly changing quantities. Accuracy measures closeness to the true value, while precision refers to reproducibility of measurements. Sensitivity is the smallest detectable change and resolution is the minimum detectable increment.
Basics of Measurements- trtuyErrors.pptxRajverma55722
1. Measurements are crucial for scientific and technological progress as they allow for discovery of new phenomena and relationships. Accurate measurements are important for design, operation, and quality control of equipment and processes.
2. There are two main methods of measurement - direct and indirect. Indirect methods use transducers to convert the measured quantity into an electrical signal and have advantages of higher accuracy, sensitivity, and ability to measure non-physical quantities compared to direct methods.
3. Errors in measurements include static errors which are deviations from the true value, and random errors which vary unpredictably. Taking multiple measurements and calculating the mean can reduce the effects of random errors. Loading effects occur when a measuring instrument distorts the original
1) The document discusses measurement and error in engineering. It covers characteristics of measuring instruments such as accuracy, precision, sensitivity, and error.
2) Accuracy refers to how close a measurement is to the true value, while precision refers to the reproducibility of measurements. Systematic errors can be corrected, while random errors average out over multiple trials.
3) Significant figures indicate the precision of a measurement. The number of significant figures retained in calculations is determined by the least precise measurement.
This document discusses the characteristics of measuring instruments, dividing them into static and dynamic characteristics. Static characteristics describe instruments that measure non-fluctuating quantities, and include scale range, accuracy, precision, error, calibration, resolution, threshold, sensitivity, repeatability, reproducibility, readability, linearity, drift, and hysteresis. Dynamic characteristics apply to instruments that measure fluctuating quantities over time, and consist of speed of response, measuring lag, fidelity, and overshoot.
The document provides guidance on identifying and calculating angles between lines and planes in 3-dimensional space. It outlines four key skills: 1) Identifying the angle between a line and plane, 2) Calculating the angle between a line and plane, 3) Identifying the angle between two planes, and 4) Calculating the angle between two planes. Examples are given to demonstrate how to use trigonometric functions like tangent to determine specific angles within diagrams of 3D objects. Activities are also included for students to practice applying the skills, such as identifying angles within diagrams of cuboids.
This document provides examples of writing quadratic equations in general form. It shows working through solving two equations step-by-step and rewriting them as ax2 + bx + c = 0, with a = 1 for the first equation, and a = 2 for the second.
SMK Kampung Gelam memberikan ringkasan singkat tentang sekolah tersebut. Sekolah ini terletak di Melaka dan memulakan operasinya pada tahun 2009 dengan 195 pelajar dan 15 guru. Sekolah ini mempunyai pelbagai kemudahan pendidikan dan sukan untuk menyokong pembelajaran pelajar.
The document is a 10 question pretest about salts. It asks students to identify examples of salts used in daily life, which salt is used as a fertilizer, and which salt can neutralize excess stomach acid. It also asks students to identify the acid used to make ammonium chloride, the salt formed from sodium hydroxide and hydrochloric acid, chemical equations that represent neutralization, reactions that can produce potassium sulfate, true statements about salts, the type of salts formed from ethanoic acid, and the definition of a salt.
This document contains a pretest for a topic on acids and bases. The pretest has 24 multiple choice questions that assess understanding of key concepts such as: [1] the definition of acids and bases, [2] properties of strong vs. weak acids and bases, and [3] calculations involving molarity, moles, and mass in acid/base solutions. Students are to record their answers in a provided table with spaces for each question number.
The document is a 15 question post-test on electrochemistry. It contains multiple choice questions testing understanding of electrolysis apparatus, electrolytes, half-reactions, and products of electrolysis for various molten salts including sodium chloride, lead(II) bromide, and potassium iodide. Diagrams of electrolysis set-ups are provided with some questions referring to labeled components or substances.
1. The document is a post-test on chemical bonds with 15 multiple choice questions and answers.
2. The questions cover topics like chemical stability of atoms, ion formation, ionic and covalent bonding, Lewis structures, and the periodic table.
3. The final question asks which statement about ionic and covalent bonds is not true - that covalent bonds involve electrostatic force of attraction.
Surat pekeliling ini membincangkan langkah-langkah untuk meningkatkan keselamatan pelajar di sekolah. Ia menyarankan peningkatan kesedaran terhadap keselamatan diri melalui pengajaran dan peraturan. Langkah-langkah seperti sistem kawalan keluar-masuk, tempat berkumpul selamat, dan larangan kawasan tersembunyi diperkenalkan. Semua pihak perlu bekerjasama untuk melaksanakan peraturan keselamatan di sekol
1. A student carried out an experiment to investigate the relationship between the change in length (y) of a spring and the mass (m) of a load placed on the spring.
2. The student measured the change in length of the spring for different masses and recorded the data in a table.
3. A graph of y against m showed that y increased linearly with m, indicating the change in length of the spring is directly proportional to the mass of the load.
This document discusses the importance of measurement in physics and introduces the International System of Units (SI Units) used to measure physical quantities. It provides definitions and examples of base units like the meter, kilogram, second, kelvin, and ampere. Prefixes are also introduced to write very large and small numbers in standard form with powers of ten. Examples are provided to convert between different units of length, mass, time, volume, velocity, pressure, and acceleration.
This document discusses base and derived physical quantities in physics. It defines base quantities as those that cannot be derived from other quantities, and lists the five base SI units as length, mass, time, temperature, and current. Derived quantities are defined as those derived from base quantities through multiplication or division, and examples given are area, velocity, and density. The document also discusses scalar and vector quantities, with scalars having magnitude only and vectors having both magnitude and direction.
This document describes several activities to teach students about experimentation and identifying variables. The activities explore evaporation, solubility, dissolving, acids, alkalis, temperature, pressure, springs, and friction. For each activity, the document identifies the manipulated variable, responding variable, and any constant/controlled variables. It also provides examples of how to operationally define scientific terms based on experimental observations and measurements. The overall purpose is to help students learn about experimental design and identifying the key variables in experiments.
This document provides teaching materials and activities for lessons on water and solutions. It includes:
1. Word lists and definitions for key scientific terms related to the physical characteristics and composition of water, such as melting point, boiling point, and electrolysis.
2. Details on activities to reinforce vocabulary, including word puzzles, jumbles, and crossword puzzles using the terms.
3. Instructions for teachers on distributing materials, having students complete the activities, and going over answers to check understanding.
The goal is to help students learn and understand important scientific vocabulary through engaging classroom exercises on topics like the physical properties and molecular structure of water.
This document discusses common misconceptions that occur during the teaching and learning of science topics. It provides examples of misconceptions related to various concepts in biology and physics. The objectives are to help teachers identify these misconceptions and be aware that they may be unintentionally passing them on to students. Suggestions include activities for teachers to help students distinguish between correct and incorrect understandings. The document aims to improve science education by reducing the spread of misconceptions.
Pantun ini membahas tentang prinsip-prinsip fizik seperti tekanan, tindak balas tekanan, dan sistem hidraulik. Pantun 1 dan 2 membahas tentang tekanan yang dihasilkan oleh beban dan atmosfera. Pantun 3 dan 4 menjelaskan bagaimana tekanan cecair dan atmosfera dapat mempengaruhi pergerakan cecair. Pantun 5 ingin membina sistem hidraulik berdasarkan prinsip Pascal.
The document discusses the key concepts of elements, compounds, atoms, and molecules. It defines elements as pure substances that cannot be broken down further, and compounds as substances made of two or more elements bonded chemically. Atoms are the smallest particles of an element, with a nucleus containing protons and neutrons surrounded by electrons. Molecules are formed when two or more atoms of elements share electrons to achieve a stable electron configuration.
it describes the bony anatomy including the femoral head , acetabulum, labrum . also discusses the capsule , ligaments . muscle that act on the hip joint and the range of motion are outlined. factors affecting hip joint stability and weight transmission through the joint are summarized.
हिंदी वर्णमाला पीपीटी, hindi alphabet PPT presentation, hindi varnamala PPT, Hindi Varnamala pdf, हिंदी स्वर, हिंदी व्यंजन, sikhiye hindi varnmala, dr. mulla adam ali, hindi language and literature, hindi alphabet with drawing, hindi alphabet pdf, hindi varnamala for childrens, hindi language, hindi varnamala practice for kids, https://www.drmullaadamali.com
The simplified electron and muon model, Oscillating Spacetime: The Foundation...RitikBhardwaj56
Discover the Simplified Electron and Muon Model: A New Wave-Based Approach to Understanding Particles delves into a groundbreaking theory that presents electrons and muons as rotating soliton waves within oscillating spacetime. Geared towards students, researchers, and science buffs, this book breaks down complex ideas into simple explanations. It covers topics such as electron waves, temporal dynamics, and the implications of this model on particle physics. With clear illustrations and easy-to-follow explanations, readers will gain a new outlook on the universe's fundamental nature.
A review of the growth of the Israel Genealogy Research Association Database Collection for the last 12 months. Our collection is now passed the 3 million mark and still growing. See which archives have contributed the most. See the different types of records we have, and which years have had records added. You can also see what we have for the future.
This slide is special for master students (MIBS & MIFB) in UUM. Also useful for readers who are interested in the topic of contemporary Islamic banking.
BÀI TẬP BỔ TRỢ TIẾNG ANH 8 CẢ NĂM - GLOBAL SUCCESS - NĂM HỌC 2023-2024 (CÓ FI...
Understanding Measurements
1. LESSON 3 Sensitivity of a measuring instrument is defined as
the capability of that instrument to respond to physical
Precision(consistency )and
stimuli or to register small physical amount or
Accuracy ,Sensitivity and Error differences.
OR
Introduction Sensitivity is the degree of a measuring instrument
to record small change in its reading.
The characteristics which are emphasized in the
selection of a measuring instrument include The smallest scale division on the measuring
precision , accuracy and sensitivity. instruments shows the sensitivity of the instruments.
Thus the more sensitive the measuring instruments
The meaning of Precision, Accuracy and the finer the scale divisions.
Sensitivity.
A vernier calipers is more sensitive than a ruler or
Precision is the degree of uniformity or a miliammeter is more sensitive than an ammeter.
A sensitive instrument is not always an accurate
reproducibility of the measurements.
instrument.
OR
Precision is the degree of a measuring
Errors
instrument to record consistent reading for
each measurement by the same way.
Any measurement of a physical quantity has errors
or uncertainty.
When we say the measurements are consistent,
There are two types of errors.
we mean that all the values of the
(a) Systematic errors
measurements are close together.
(b) Random errors
Accuracy is the degree of closeness of the
Systematic errors
measurements to the actual or accepted value.
Systematic errors are errors in the measurement of a
physical quantity due to instruments, the effects of
When we say the measurements are accurate,
surrounding conditions and physical constraints of the
we are actually saying that the values of the
observer.
measurements are close to the true or
The main characteristic of systematic error is that its
accepeted value.
magnitude is almost constant or appears in one
The diagram shows the result for four shooters
direction only. The value of the measurement is
A, B , C and D in a tournament. Every shooters
always greater or is always less than the actual value.
shot five times .
Sources of systematic errors are:
(i) Zero errors or end errors
Zero errors occurs when the instrument gives a
non- zero reading when in fact the actual
reading is zero.
(ii) Personal error of the observer.
Physical constraints or limitations of the
observer can cause systematic errors.
The table shows the conclusion . An example is the reaction time.
Shooter Precision Accuracy (iii) Errors due to instruments
The examples are;
A High Low
A stopwatch which is faster than normal would
B Low High
give readings which are always larger than the
C High High
actual time.
D Low Low
9
2. A thermometer which is used under different
Measurement Length
conditions from which it was calibrated.
A voltmeter manufactured in Germany had been
calibarated under different temperature and We normally use ruler, measuring tape , vernier
earth’s magnetic field from Malaysia where the calipers or micrometer screw gauge to measure
voltmeter is used. length.
(iv) Errors due to wrong assumption. Measuring Smallest scale division
For example, we assumed that the value of the instrument
acceleration due to gravity g is 9.81 ms-2, but the Ruler 0.1 cm or
actual value may 9.79 ms-2. Hence there is a 1 mm
positive error of 0.02 ms-2. Vernier 0.01cm
calipers
Systematic errors cannot be reduced or eliminated by Mikrometer 0.01 mm
taking repeated readings using the same method, the screw gauge
same instrument or by the same observer.
Systematic erros can be elimated or reduced by Vernier calipers
improving the procedure of taking the
measurements , using a different instrument or
getting somebody else to make the the
measurements.
For example for the zero errors can be eliminated by
subtracting the zero reading from the obtained
readings.
Random errors
The main source of random error is the observer or
has non -constant size of error and is unpredictable.
A pair of vernier calipers can be used to measure
The characteristics of random errors are:
thickness of a wire , internal and external diameter of
(i) it can be positive or negative. The obtained
a beaker, depths of a test tube ,etc.
readings may be greater or less than the
The inside jaws are used to measure internal
actual value.
diameters and the outside jaws are used to measure
(ii) its magnitude is not constant.
external diameters and thickness.
Examples of random errors are:
The tail is used to measure depths.
(i) Parallax errors – occur when the position
The main scale is marked in divisions of 0.1 cm ,
of the eye is not perpendicular to the scale.
while the vernier scale is marked in divisions of 0.01
(ii) Different pressures are applied when
cm.
closing the gap of the micrometer screw
gauge when it is used to measure the
The following steps shows how to read the vernier
diameter of a wire.
calipers.
• Read the main scale marking just before the
(iii) Changes in the temperature during an
zero marking on the vernier scale.
experiment.
• Find the vernier scale marking which joins
(iv) Recording the wrong reading.
the main scale marking.
(v) Mistake in counting
• The reading for a vernier scale is always
recorded in cm with two decimal places
To eliminate or reduce random errors ,
(The accuracy is 0.01 cm)
repeated reading are taken.
10
3. The main scale is marked in divisions of 0.5 mm ,
Example 1 while the vernier scale is marked in divisions of 0.01
mm.
Write down the reading of the following vernier
The jaws tigh the object that is to be measured.
calipers.
The thimble is turned until its jaw touches the object.
The ratchet knob prevents overtightening by making a
click sound when the micrometer is ready to be read.
The following steps shows how to read the
Solution micrometer screw gauge.
Read the main scale marking just before the zero
marking on the vernier scale.
Example 2 • Read the main scale marking just before the
zero marking beforev the thimble.
Based on the following diagrams write down the • Find the vernier scale marking which joins
actual thickness of the objects. the main scale.
• The reading for a micrometer screw gauge
is always recorded in mm with two decimal
places
(The accuracy is 0.01 cm)
Example 3
Write down the reading of the following diagrams.
Solution
Solution
Example 4
Mikrometer screw gauge
Based on the following diagrams write down the
actual diameters of the objects
(a)
The micrometer screw gauge is used to measure
thickness and diameters of very small objects.
11
5. Triple beam balance
Accuracy : ………………………………………….
Measurement Time
Double-scale ammeter
Accuracy of upper scale :……………………..
Mechanical stop watch Acuracy of lower scale : ……………………….
Accuracy : …………………………………….. Reading :………………………………………..
Miliammeter range 0- 50 mA
Electronic stop watch
Accuracy:……………………………………………
Accuracy :……………………………………
Reading :…………………………………………..
Reading :…………………………………….
Accuracy:………………………………………
Measurement Current
Measurement Temperature
Ammeter range 0 – 5A
Accuracy :…………………………………………….
Accuracy:…………………………………………..
13
6. 5 Based on the table below, what are the
measuring instruments J, K and L?
Measuring instruments Measurement
J 2.52 ±0.01 cm
K 15.2±0.1 cm
L 125.4±0.1 g
J K L
A Micrometer Vernier Spring
screw gauge calipers balance
B Micrometer Vernier Triple beam
Screw gauge calipers balance
C Vernier Metre Triple beam
calipers ruler balance
6 Which of the following is true?
TUTORIAL 3
A The parallax error is not effected to the
accuracy
1 The ability of an instrument gives consistent B The accurate instrument is also the
reading , when repeated readings are taken is sensitive instrument
called as C The accuracy increases when the
measurement nearest to actual value.
A B
accuracy precision
C D
sensitivity error 7 Which of the following is true?
2 Which of the following should be the small A A stop watch is more sensitive than an
value ,so that the precision becomes high? electronic
B An ammeter is more sensitive than a
A B
Actual value Mean galvanometer
C D
Relative error Relative C A vernier calipers is more sensitive
deviation than a metre ruler
D A thinner-walled bulb thermometer is more
3 The ability of an instrument to detect a slight sensitive than a thicker –walled bulb
change that occurs in the measured quantity is thermometer
called as
8 Which of the following is most likely to show a
A B
precision accuracy precise shooting?
C D
sensitivity error
4 The accuracy of an instrument increases if
A the number of significant figures increases
B the relative deviation relative increases
C the relative error increases
14
7. D Measuring the thickness of a large number
of pieces of paper to find the thickness of
one piece.
13 The error is caused by the position of eye is not
parallel to the scale of an instrument is called as
A positive zero error
B negative zero error
9 Which of the following is most likely to show an C parallax error
accurate shooting but not so presicely?
14 The following table shows the readings
measured by using different measuring
instruments X, Y dan Z.
Measuring instrument Reading / mm
X 2.38
Y 52
Z 6.5
Which of the following is true?
10 It take 5.01 s for an object to move to a certain X Y Z
distance. When an electronic watch is used the A Ruler Vernier calipers Mikrometer
time is recorded as 4.85 s. What is the screw gauge
percentage of error? B Vernier Mikrometer Measuring
calipers screw gauge tape
A B
0.6 % 2.1 % C Measuring Ruler Vernier
C D
3.2 % 5.2 % Tape calipers
E 7.7 % D Mikrometer Ruler Vernier
11 Which of the following statements about errors Screw gauge Calipers
is correct? 15 Table shows readings of the thickness of a book
measured by four different students. Which of
A Zero error is random error the students recorded the true readings.
B Random errors can be reduced by taking
repeat readings.
C Systematic errors can be due to Student Ruler Vernier Mikrometer
instruments which are not sensitive. / cm calipers screw
D Systematic errors cause the readings / cm gauge
scattered on both sides of the actual /cm
value. A W 2.17 2.2 2.174
B X 2.174 2.2 2.17
12 Which of the following experiment techniques C Y 2.17 2.174 2.2
can reduce systematic error of the quantity Z 2.2 2.17 2.174
D
being measured?
16 Which of the following accuracy of the
A Measuring the diameter of a wire at measuring instruments is true?
different points along the wire.
B Adjusting an ammeter to read zero before Measuring instruments Accuracy
measuring a current.
C Timing a large number of oscillations to A Ruler 1 mm
find the period of a pendulum. B Vernier calipers 0.001 cm
C Mikrometer screw gauge 0.1 mm
15
8. 17 The focal length of a convex lens is 12 cm. If
the focal length is measured by using a ruler,
the reading recorded ought to be
A B
11.9 cm 12.0 cm
C D
12.00 cm 12.1 cm
18 The diagram shows the existence of zero errors
of a vernier calipers.
What is the value of the zero error?
A B
+ 0.04 cm - 0.04 cm
C D
+ 0.06 cm - 0.06 cm
The actual reading of diameter of the metal
sphere is
A B
2.02 cm 2.04 cm
C D
2.06 cm 2.08 cm
21 The thickness of a paper is measured by using a
micrometer screw gauge should be recorded as
19 The following diagram shows a vernier calipers.
A 2 mm B 2.1 mm
C 2.14 mm D 2.142 mm
22 Diagram shows a micrometer screw gauge.
What is the reading of the vernier calipers ?
Based on the diagram, what is the number of
revolution of the thimble.
A B
3.17 cm 3.08 cm
A B 12½
12
C C
2.18 cm 2.07 cm
C D 13¾
13
20 Figure(a) shows the existence of zero error of a
23 Diagram shows a micrometer screw gauge
vernier calipers. Figure(b) shows the reading of
reading when it is closed at its gap.
the vernier calipers for diameter of metal
sphere.
16
9. The subsequent readings must be corrected by
A adding 0.02 mm
B subtracting 0.02 mm
C adding 0.03 mm
D subtracting 0.03 mm
24 The actual reading of diameter of the metal wire
is
A B
8.30 mm 8.32 mm
C D
8.80 mm 8.82 mm
26 A simple pendulum makes 20 complete swings
in 20.35 s. Which of the following is used?
A Stop watch
Based on the diagram above, the thickness of a
B Pendulum clock
sheet of paper is
C Electronic watch
A B
3.25 cm 3.75 cm
27 A mass hanging from one end of a vertical
C D
0.325 cm 0.0375 cm
spring makes ten complete oscillations in 15 s.
If the time of the oscillations is taken by a stop
watch ,it should be recorded as
A B
15 s 15.0 s
C D
15.00 s 15.000 s
28 The figure shows a thermometer.
25 Figure(a) shows the existence of zero error of a
micrometer screw gauge. Figure(b) shows the
reading of the micrometer screw gauge for
diameter of metal wire.
What is the reading shown?
96o C 93.5o C
A B
94.0 o C 94o C
C D
29 Which of the following will increase the
sensitivity of a mercury-in-glass thermometer/
Glass stem Capillary Size of
wall tube bore
A thick wide big
B thin narrow big
17
10. C thick wide small Length of a
pencil
D thin narrow small
Internal
diameter of a
30 The current flows through a metal conductor is
beaker
between 0.01 A to 0.05 A. Which ammeter is
(a) Complete the table above.
most suitable to use?
(b) State one reason why the diameter of the
A copper wire should be measured at a few
Ammeter range 0-1A
different places?
B Ammeter range 0-5A
…………………………………………………
C Ammeter range 0-10 mA
D Ammeter range 0-50 mA
…………………………………………………
31 State one precaution to be taken while
What is the reading shown by the ammeter (c)
above? taking measurements by using the
instrument which measured the internal
A B
2.4 A 2.80 A diameter of a beaker.
C D
0.48 A 0.44 A
…………………………………………………
32 The function of zero adjuster in an ammeter is to
…………………………………………………
A avoid zero error
34
B fasten the pointer
C avoid parallax error
D control the very large current
33
Measurement Measuring Accuracy (cm)
Instrument
Diameter of a
copper wire
18
11. Diagram above shows the reading of a
mikrometer screw gauge for the thickness of 5
sheets of paper.
(a) What is the number of revolution of the N
scale .
(b) Determine the thickness of a sheet of the
paper in cm.
Figure(a) shows the jaws of a vernier calipers (c) Give the name and the function of M
without tigh any object. Figure(b) shows the scale.
jaws of the vernier calipers tigh a test tube.
....................................................................
(a) What is the function of P?
....................................................................
.............................................................................
....................................................................
(b) What is the smallest division on the vernier (d) State a precaution to be taken while taking
scale? measurements by using the micrometer
screw gauge.
.............................................................................
....................................................................
(c) State the diameter of the test tube in
metre. ....................................................................
36
Diagram above shows a thermometer.
(a) Name component
35
(i) P ……………………………...........
19
12. ....................................................................
(ii) Q ……………………………...........
(ii) B
(b) State the accuracy of the thermometer. ……………………………………..................
....................................................................
....................................................................
(b)
(c) What is the reading of the thermometer? State the accuracy of the ammeter
.................................................................... ....................................................................
(d) Why does the glass stem wall of the
....................................................................
thermometer is thin?
(c) State the reading of the ammeter.
....................................................................
(e) How should you do to increase the ....................................................................
accuracy of the thermometer.
....................................................................
(d) State two precautions to be taken while
....................................................................
taking measurements by using the
………………………………………………… ammeter.
(f) Why does the thermometer use mercury? ....................................................................
…………………………………………………
....................................................................
…………………………………………………
....................................................................
(g) Draw a dotted line to show the correct
position of eye in the above diagram while
measuring the temperature of a substance.
37 Diagram shows a miliammeter.
(a) Give the name and the function of
component of
(i) A ...........................................
……..................
20