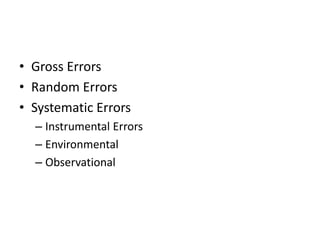
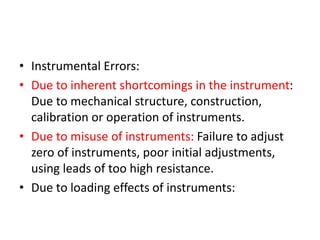
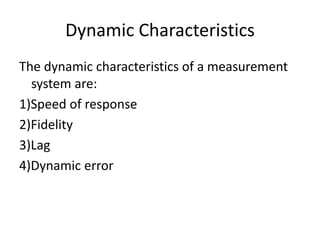
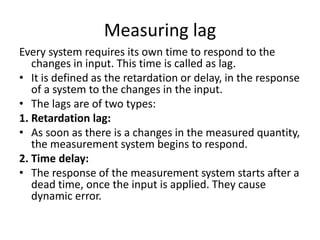
There are three main types of errors in measurement systems:
1) Gross errors are caused by human mistakes when using instruments, calculating measurements, or recording data.
2) Systematic errors occur due to faults in measuring devices and can include zero errors, observational errors from wrong readings, and environmental errors from changes in temperature or humidity.
3) Random errors are caused by sudden changes in experimental conditions from unknown causes and can include noise, resulting in measurements that need to be analyzed statistically.
The document discusses different types of errors that can occur in measurement. It describes gross errors, systematic errors like instrumental errors and environmental errors, and random errors. It also defines key terms used to analyze errors like limit of reading, greatest possible error, and discusses analyzing measurement data using statistical methods like the mean, standard deviation, variance and histograms. Measurement errors can occur due to issues like parallax, calibration, limits of the measuring device, and are analyzed statistically.
This document discusses uncertainties and errors in physical measurements. It explains that there are two types of errors - random errors which are unpredictable, and systematic errors caused by imperfect measuring equipment. Random errors can be reduced by repeating measurements, while systematic errors are reduced by calibrating equipment. Accuracy refers to how close a measurement is to the true value, while precision refers to how close repeated measurements are. The number of significant figures reported in a result should not exceed the least precise value used. The document also discusses determining and expressing uncertainties in measurements, and how to combine uncertainties when performing calculations or graphing data.
This document provides an overview of the DEE1012 measurement course. It outlines the course learning outcomes, which are to apply measurement principles and solve problems using measuring operations and theorems. The document then details several topics that will be covered in the course, including the measurement process, elements of a measurement system, types of errors, measurement terminology, characteristics of measurement, and standards used in measurement. Examples are provided to illustrate key concepts. References are listed at the end.
This document discusses measurement errors and standards. It defines key terms related to measurement accuracy and precision. Accuracy is the closeness of a measurement to the true value, while precision refers to the consistency of repeated measurements. Errors can be absolute or relative. Systematic errors are due to instrument flaws, while random errors have unknown causes. The document also discusses limiting/guarantee errors, which specify the maximum allowed deviation from a component's rated value. Resolution refers to the smallest detectable change in a measurement. Sensitivity is the change in output per unit change in input.
Absolute and relative error are two types of error that scientists should be familiar with. Absolute error is the physical error in a measurement, while relative error gives an indication of how good a measurement is relative to the size of the thing being measured. Absolute error is calculated as the amount of error, while relative error is calculated as the absolute error divided by the value of the thing measured. This allows comparisons of accuracy between measurements even if the absolute error is the same.
This document discusses physical measurement and errors in measurement. It defines key terms like measurement, units, observations, and least count. It describes the International System of Units (SI) as the modern metric system. It also discusses different types of errors like absolute error and relative error. Systematic errors can be corrected while random errors are reduced by taking multiple measurements. Accuracy refers to systematic errors while precision describes random errors. The document outlines methods to calculate propagation of errors and statistical treatment of error values.
This document discusses terminology and concepts related to measurement and error. It defines true value, accuracy, and precision. There are two types of errors - determinate (systematic) errors which have a known cause, and indeterminate (random) errors which cannot be determined. Accuracy refers to closeness to the true value while precision refers to reproducibility. The standard deviation allows for more variation in a sample compared to the population. When combining uncertainties from multiple measurements, relative uncertainties should be summed for multiplication and division, while absolute uncertainties are summed for addition and subtraction. Significant figures refer to the reliable digits in a measurement and rules govern how many are retained in calculations.
This document discusses experimental errors in scientific measurements. It defines experimental error as the difference between a measured value and the true value. Experimental errors can be classified as systematic errors or random errors. Systematic errors affect accuracy and can result from faulty instruments, while random errors affect precision and arise from unpredictable fluctuations. The document also discusses ways to quantify and describe experimental errors, including percent error, percent difference, mean, and significant figures. Understanding experimental errors is important for analyzing measurement uncertainties and improving experimental design.
The document discusses measurement errors and standards. It defines key terms like instruments, measurements, standards, and different types of errors. It explains absolute and relative errors, accuracy, precision and resolution. It discusses sources of errors like gross errors, systematic errors from instruments and environment, and random errors. Finally, it categorizes measurement standards into international, primary, secondary and working standards based on their accuracy and purpose.
This document discusses errors and uncertainty in measurement. It defines error as the difference between an individual measurement and the true value. Errors can be random or systematic. Sources of error include the measuring instrument, the item being measured, the measurement process, and environmental factors. There are two types of uncertainty - type A which is evaluated statistically from repeated measurements, and type B which is evaluated from other sources like specifications or published data. Calculating uncertainty involves identifying sources of uncertainty, estimating individual uncertainties, and combining them to obtain an overall measurement uncertainty.
Diploma sem 2 applied science physics-unit 1-chap 2 error sRai University
This document discusses various types of errors that can occur in measurements. It describes instrumental error, observer error, and procedural error as the three main sources of uncertainty. It also defines accuracy as a measure of how close a measurement is to the accepted value, while precision refers to the closeness of repeated measurements. The document provides examples of calculating percentage error, relative error, and discusses significant figures when taking measurements.
There are three main types of errors in measurement: gross errors due to human mistakes, systematic errors due to issues with instruments or environment, and random errors due to unknown causes. When quantities are calculated from multiple measurements, the total error is determined by combining the individual errors based on the calculation - for addition/subtraction it is the sum of the absolute errors, for multiplication/division it is the sum of the percentage errors, and for powers it is the power multiplied by the percentage error. Proper instrument selection, calibration, and accounting for errors can help reduce systematic and random errors.
This document discusses measurement and data processing. It describes random uncertainties and systematic errors, and distinguishes between precision and accuracy. It explains that random uncertainties can be reduced by taking multiple measurements, while systematic errors must be corrected before an investigation. Precision refers to the closeness of repeated measurements, while accuracy refers to how close measurements are to the true value. The document also covers uncertainty ranges, significant figures, absolute and percentage uncertainties, and how uncertainties are treated in calculations. It provides examples of plotting graphs and determining the line of best fit.
This is a lecture note on Error and its propagation. This slide can be very much useful for As level physics students. It is totally different from the presentation. I would like to name it as slides of lecture notes on Error(uncertainty), difference on precision and accuracy, difference on two types of error (systematic and random errors). Believe me it will help you to enhance your knowledge on Uncertainty and its propagarion.
This document discusses different types of errors in experimental measurements and calculations. It describes random errors, which vary unpredictably, and systematic errors, which are consistent biases. Random errors can be reduced by taking more trials, while systematic errors must be accounted for. Mistakes are distinguished from errors. Significant figures rules for measurements and calculations are explained. The concepts of uncertainty, including limits of reading, degrees of uncertainty, absolute and relative uncertainty, and uncertainty propagation through calculations, are introduced.
I split the presentation for the unit into two, as I added so many slides to help with student questions and misconceptions. This one focuses on mathematical aspects of the unit.
This document discusses measurement errors and uncertainty. It defines measurement as assigning a number and unit to a property using an instrument. Error is the difference between the measured value and true value. There are two main types of error: random error, which varies unpredictably, and systematic error, which remains constant or varies predictably. Sources of error include the measuring instrument and technique used. Uncertainty is the doubt about a measurement and is quantified with an interval and confidence level, such as 20 cm ±1 cm at 95% confidence. Uncertainty is important for tasks like calibration where it must be reported.
Accuracy refers to how close a measurement is to the true value, while precision refers to the reproducibility of measurements. Accuracy is determined by calculating percentage error compared to the accepted value. Precision depends on the number of significant figures in a measurement as determined by the measuring tool. Random and systematic errors can affect accuracy, while random errors affect precision. The uncertainty of a measurement combines its precision and accuracy errors and is reported with the mean value and at a given confidence level, typically 95%. Propagation of error calculations allow determining the total uncertainty when a value depends on multiple measurements.
All physical measurements have an associated uncertainty that reflects errors involved. There are two types of errors - random errors which are out of the measurer's control and can be reduced through repeat readings, and systematic errors from instruments which can be reduced through calibration. The uncertainty is the smallest division on the instrument for systematic errors, and for random errors it can be determined from the range of repeat readings.
Measurement errors, Statistical Analysis, UncertaintyDr Naim R Kidwai
The Presentation covers Measurement Errors and types, Gross error, systematic error, absolute error and relative error, accuracy, precision, resolution and significant figures, Measurement error combination, basics of statistical analysis, uncertainty, Gaussian Curve, Meaning of Ranges
2.2 measurements, estimations and errors(part 2)Raechel Lim
Measurements and estimations involve uncertainty that arises from imprecision, random errors, and systematic errors. Numbers can be categorized as exact or approximate, with approximations involving uncertainty. Uncertainty must be expressed either implicitly by careful rounding or explicitly using ranges. Significant digits indicate the precision of measurements and estimations, and implied uncertainty ranges can be determined from them. When combining approximate values, answers must be rounded or expressed as ranges consistent with the least precise input to properly account for accumulated uncertainties.
This document provides an introduction to uncertainty measurements. It explains that there is always uncertainty involved when taking measurements as values can vary depending on factors like how, when and where something is measured. It describes the two main sources of uncertainty as random errors which are unpredictable, and systematic errors which are constant. The document then outlines the process for calculating uncertainty which involves taking multiple readings to determine standard deviation and uncertainty (Type A), and combining various uncertainty components from calibration certificates and manufacturers alongside sensitivity coefficients to determine combined and expanded uncertainty using a normal distribution with 95% confidence (Type B). It emphasizes that the process is the same for measurements in decibels or real numbers but the calculations are different.
This document discusses errors in measurement and different types of errors. It explains that there are five main elements that can cause errors: standards, work pieces, instruments, persons, and environment. There are three types of errors: systematic errors, which occur due to imperfections and are of fixed magnitude; random errors, which occur irregularly; and statistical analysis can be used to analyze random errors through calculations of mean, range, deviation, and standard deviation. Systematic errors include instrumental errors from faulty instruments, environmental errors from external conditions, and observational errors from human factors like parallax.
There are two main types of errors in measurement: systematic errors, which always produce results in the same direction, and random errors, which occur unpredictably due to various factors. The accuracy of a measurement indicates how close it is to the accepted value, while the precision refers to the agreement between multiple measurements of the same quantity. Taking the average of repeated measurements reduces the impact of random errors, but the uncertainty in any measurement must be reported using plus-and-minus values to indicate the possible variance.
The document discusses various concepts related to measurement and error including:
- Defining accuracy as closeness to the true value and precision as reproducibility of measurements.
- Types of errors such as determinate/systematic errors which can be corrected and indeterminate/random errors which average out with multiple trials.
- Assessing total error by treating a reference standard as a sample and calculating differences from the reference value.
- Expressing accuracy and precision using terms like mean, percent error, range, standard deviation, and percent coefficient of variation.
Every measurement has uncertainty that arises from limitations in measuring devices, techniques, and the inherent variability in what is being measured. There are several types of uncertainty: absolute uncertainty is the value given directly by the measurement; fractional and percent uncertainties relate the absolute uncertainty to the measured value. The proper method for determining the combined uncertainty when calculations are performed on measurements depends on whether values are added, subtracted, multiplied, divided, or raised to a power. Accounting accurately for uncertainty is crucial for scientific validity.
The document discusses secondary instruments used for measurement. It defines secondary instruments as those that must be calibrated by comparison with an absolute instrument or another calibrated secondary instrument. Secondary instruments are further classified as indicating, integrating, and recording instruments. Indicating instruments show the magnitude of a quantity, integrating instruments measure total quantity or energy over time, and recording instruments provide a continuous record of a quantity's variation over a period of time through pen tracings. The document also discusses concepts such as precision, accuracy, resolution uncertainty, types of errors including gross, systematic, and random, and the loading effect.
This document discusses the functional elements, static and dynamic characteristics, and errors in measurement instruments. It describes the key components of instruments including sensing elements, variable conversion/manipulation elements, and data presentation/transmission elements. Static characteristics like accuracy, sensitivity, linearity, and resolution do not vary with time, while dynamic characteristics like speed of response and measuring lag do vary with time. Errors can be gross, systematic including due to instruments and environment, or random. Statistical analysis is used to evaluate random errors in measurement data. Calibration against standards is important to ensure instrument accuracy.
This document provides an introduction to measurement and metrology. It discusses the basics of measurement including defining standards of units such as length, time, current and temperature. There are four categories of standards based on accuracy from primary to working standards. Measurement involves comparing an unknown quantity to a standard. There are direct and indirect methods of measurement. Metrology includes theoretical and practical problems related to measurement and establishes measurement standards. The three types of metrology are scientific, industrial, and legal.
This document provides an overview of a course on measurements and instrumentation. The course will cover topics such as measurement systems, calibration, accuracy, precision, and instruments for measuring length, force, torque, strain, pressure, flow, and temperature. The objectives are to understand instrumentation principles and learn basic measurement methods. The primary textbook will be Theory and Design for Mechanical Measurements by Figliola and Beasley, along with class notes.
Errors in measurement come from three main sources: gross errors from human mistakes, systematic errors from instrument defects or environmental factors, and random errors from unknown causes. Systematic errors include instrumental errors from worn parts or friction and environmental errors from conditions like temperature or magnetic fields. Random errors occur even when systematic errors are addressed and can only be reduced by taking more readings and using statistical analysis.
This document discusses condition monitoring techniques used to assess the health of equipment. It defines condition monitoring as assessing equipment using measurements and monitoring of parameters. The key steps in condition monitoring are identifying critical systems, selecting monitoring techniques, setting baseline readings, collecting and assessing data, diagnosing faults, and reviewing the system. Common monitoring techniques discussed include vibration analysis, temperature monitoring, lubricant analysis, and visual inspection using tools like borescopes. Specific methods like ferrography, spectroscopy, and infrared thermography are also summarized.
Metrology is the science of measurement and its application by national metrology institutes to ensure measurements are fit for their intended purpose. It has three key activities: defining standard units of measurement, establishing reference measurements, and linking actual measurements to references. Metrology includes scientific, technical, and legal domains. It is important for manufacturing quality control and legal traceability. Advances in nanotechnology have led to the development of nano metrology. The objectives of metrology are to determine measurement needs, evaluate new instruments, standardize methods, and solve measurement problems. Measurement and inspection are necessary for product specifications, process monitoring, and interchangeability. Various measurement standards and instrument types exist for different applications.
There are three main types of errors in measurement instruments:
1. Gross errors are due to human mistakes like misreading or incorrectly recording data. They can be large errors and are avoided by taking multiple readings carefully.
2. Systematic errors are predictable and include instrumental errors from defects, environmental errors from external conditions, and observational errors from parallax or incorrect conversions.
3. Random errors are unpredictable and caused by unknown external factors affecting the measurement. They are also called residual errors.
The document discusses sources of errors in measurement. It identifies several potential sources including faulty instrument design, insufficient knowledge of the quantity being measured, lack of instrument maintenance, irregularities in the measured quantity, unskilled instrument operation, design limitations, and environmental factors like temperature changes. The types of errors are also categorized as gross errors from carelessness, systematic errors from instrument shortcomings and characteristics, and random errors. Methods to reduce errors include taking multiple readings, instrument calibration, recognizing systematic error causes, and controlling environmental conditions.
This document discusses different types of errors that can occur when measuring instruments are used. There are three main types of errors: gross errors, which are usually due to human mistakes; systematic errors, which include instrumental errors from device limitations, environmental errors from external conditions, and observational errors from parallax or incorrect readings; and random errors, which are due to unknown factors affecting the measurement. Specific examples of errors in permanent magnet moving-coil meters and moving-iron instruments are also described, such as temperature effects changing resistance or hysteresis causing inaccurate readings. Methods to minimize various errors, such as using materials with stable properties or shielding instruments, are also mentioned.
general measuring systems , basic concept of measurement ,importance of measurement ,errors in measurement ,calibration of instrument,biomedical medical sensors and measurementation,instrumentation and measurementation ,static and dynamic characteristics of measurement,block diagram of general measuring system.how to avoid errors in measurement.
1. An instrument's performance is characterized by static and dynamic characteristics. Static characteristics like accuracy, sensitivity and linearity do not vary with time, while dynamic characteristics like response speed and lag vary over time.
2. Measurement errors can be gross, systematic or random. Gross errors are due to human mistakes, systematic errors arise from instrument flaws or environment, and random errors occur due to unpredictable changes.
3. Statistical analysis of multiple measurements helps determine the arithmetic mean and uncertainty. Instruments are calibrated against standards to ensure accuracy over their operating lifetime.
This document provides an overview of control systems. It defines a control system as an arrangement of components designed to achieve a specific objective. The document discusses open loop and closed loop systems. Open loop systems do not provide feedback, while closed loop systems constantly monitor and adjust the output based on feedback. Examples are given of each type of system. The key requirements, terms, types of systems, their comparison and design process are outlined over the course of the document.
1. Basics of Measuring Instrumentation System (2).pptxMelkamuGebeyehu1
This document provides an overview of biomedical instrumentation systems and measurement fundamentals. It discusses the history and purposes of measurement, standards of measurement systems, types of measurement errors, and metrology. It also describes the key components of biomedical instrumentation systems including sensors, transducers, signal conditioners, displays, and data storage. Additionally, it covers general design concerns like accuracy, range, sensitivity, linearity and frequency response. Finally, it differentiates between active and passive instruments as well as analog and digital instruments.
The document discusses different types of errors that can occur when making measurements. It describes three main categories of errors: gross errors due to human mistakes, systematic errors due to issues with instruments, and random errors from unknown external factors. It provides examples of errors from instrument construction and calibration, environmental conditions, observer techniques, and more. The document emphasizes the importance of understanding error sources in order to reduce errors and improve measurement accuracy.
The document summarizes key concepts from the Mechanical Measurements and Metrology course. It defines a generalized measurement system as having three stages: a primary detector-transducer stage that senses the input signal, an intermediate modifying stage that conditions the signal, and an output or terminating stage that presents the measured value. It describes common static characteristics like accuracy, precision, and hysteresis. Dynamic characteristics discussed include system response, time delay, and types of errors in measurements. The document also summarizes electrical and mechanical transducers, intermediate modifying devices, and terminating devices used to present measurement outputs.
EMI unit 1 notes introduction to measurementsGopalakrishnaU
This document discusses performance characteristics and errors in measurement for instruments. It defines key terms like accuracy, precision, resolution, sensitivity, and error. It also describes static characteristics like accuracy and dynamic characteristics like speed of response. The document outlines different types of errors like gross, systematic, and random errors. It provides examples and guidelines for selecting instruments and minimizing errors in measurements.
DEEP LEARNING FOR SMART GRID INTRUSION DETECTION: A HYBRID CNN-LSTM-BASED MODELgerogepatton
As digital technology becomes more deeply embedded in power systems, protecting the communication
networks of Smart Grids (SG) has emerged as a critical concern. Distributed Network Protocol 3 (DNP3)
represents a multi-tiered application layer protocol extensively utilized in Supervisory Control and Data
Acquisition (SCADA)-based smart grids to facilitate real-time data gathering and control functionalities.
Robust Intrusion Detection Systems (IDS) are necessary for early threat detection and mitigation because
of the interconnection of these networks, which makes them vulnerable to a variety of cyberattacks. To
solve this issue, this paper develops a hybrid Deep Learning (DL) model specifically designed for intrusion
detection in smart grids. The proposed approach is a combination of the Convolutional Neural Network
(CNN) and the Long-Short-Term Memory algorithms (LSTM). We employed a recent intrusion detection
dataset (DNP3), which focuses on unauthorized commands and Denial of Service (DoS) cyberattacks, to
train and test our model. The results of our experiments show that our CNN-LSTM method is much better
at finding smart grid intrusions than other deep learning algorithms used for classification. In addition,
our proposed approach improves accuracy, precision, recall, and F1 score, achieving a high detection
accuracy rate of 99.50%.
KuberTENes Birthday Bash Guadalajara - K8sGPT first impressionsVictor Morales
K8sGPT is a tool that analyzes and diagnoses Kubernetes clusters. This presentation was used to share the requirements and dependencies to deploy K8sGPT in a local environment.
Embedded machine learning-based road conditions and driving behavior monitoringIJECEIAES
Car accident rates have increased in recent years, resulting in losses in human lives, properties, and other financial costs. An embedded machine learning-based system is developed to address this critical issue. The system can monitor road conditions, detect driving patterns, and identify aggressive driving behaviors. The system is based on neural networks trained on a comprehensive dataset of driving events, driving styles, and road conditions. The system effectively detects potential risks and helps mitigate the frequency and impact of accidents. The primary goal is to ensure the safety of drivers and vehicles. Collecting data involved gathering information on three key road events: normal street and normal drive, speed bumps, circular yellow speed bumps, and three aggressive driving actions: sudden start, sudden stop, and sudden entry. The gathered data is processed and analyzed using a machine learning system designed for limited power and memory devices. The developed system resulted in 91.9% accuracy, 93.6% precision, and 92% recall. The achieved inference time on an Arduino Nano 33 BLE Sense with a 32-bit CPU running at 64 MHz is 34 ms and requires 2.6 kB peak RAM and 139.9 kB program flash memory, making it suitable for resource-constrained embedded systems.
UNLOCKING HEALTHCARE 4.0: NAVIGATING CRITICAL SUCCESS FACTORS FOR EFFECTIVE I...amsjournal
The Fourth Industrial Revolution is transforming industries, including healthcare, by integrating digital,
physical, and biological technologies. This study examines the integration of 4.0 technologies into
healthcare, identifying success factors and challenges through interviews with 70 stakeholders from 33
countries. Healthcare is evolving significantly, with varied objectives across nations aiming to improve
population health. The study explores stakeholders' perceptions on critical success factors, identifying
challenges such as insufficiently trained personnel, organizational silos, and structural barriers to data
exchange. Facilitators for integration include cost reduction initiatives and interoperability policies.
Technologies like IoT, Big Data, AI, Machine Learning, and robotics enhance diagnostics, treatment
precision, and real-time monitoring, reducing errors and optimizing resource utilization. Automation
improves employee satisfaction and patient care, while Blockchain and telemedicine drive cost reductions.
Successful integration requires skilled professionals and supportive policies, promising efficient resource
use, lower error rates, and accelerated processes, leading to optimized global healthcare outcomes.
Redefining brain tumor segmentation: a cutting-edge convolutional neural netw...IJECEIAES
Medical image analysis has witnessed significant advancements with deep learning techniques. In the domain of brain tumor segmentation, the ability to
precisely delineate tumor boundaries from magnetic resonance imaging (MRI)
scans holds profound implications for diagnosis. This study presents an ensemble convolutional neural network (CNN) with transfer learning, integrating
the state-of-the-art Deeplabv3+ architecture with the ResNet18 backbone. The
model is rigorously trained and evaluated, exhibiting remarkable performance
metrics, including an impressive global accuracy of 99.286%, a high-class accuracy of 82.191%, a mean intersection over union (IoU) of 79.900%, a weighted
IoU of 98.620%, and a Boundary F1 (BF) score of 83.303%. Notably, a detailed comparative analysis with existing methods showcases the superiority of
our proposed model. These findings underscore the model’s competence in precise brain tumor localization, underscoring its potential to revolutionize medical
image analysis and enhance healthcare outcomes. This research paves the way
for future exploration and optimization of advanced CNN models in medical
imaging, emphasizing addressing false positives and resource efficiency.
Optimizing Gradle Builds - Gradle DPE Tour Berlin 2024Sinan KOZAK
Sinan from the Delivery Hero mobile infrastructure engineering team shares a deep dive into performance acceleration with Gradle build cache optimizations. Sinan shares their journey into solving complex build-cache problems that affect Gradle builds. By understanding the challenges and solutions found in our journey, we aim to demonstrate the possibilities for faster builds. The case study reveals how overlapping outputs and cache misconfigurations led to significant increases in build times, especially as the project scaled up with numerous modules using Paparazzi tests. The journey from diagnosing to defeating cache issues offers invaluable lessons on maintaining cache integrity without sacrificing functionality.
Introduction- e - waste – definition - sources of e-waste– hazardous substances in e-waste - effects of e-waste on environment and human health- need for e-waste management– e-waste handling rules - waste minimization techniques for managing e-waste – recycling of e-waste - disposal treatment methods of e- waste – mechanism of extraction of precious metal from leaching solution-global Scenario of E-waste – E-waste in India- case studies.
Batteries -Introduction – Types of Batteries – discharging and charging of battery - characteristics of battery –battery rating- various tests on battery- – Primary battery: silver button cell- Secondary battery :Ni-Cd battery-modern battery: lithium ion battery-maintenance of batteries-choices of batteries for electric vehicle applications.
Fuel Cells: Introduction- importance and classification of fuel cells - description, principle, components, applications of fuel cells: H2-O2 fuel cell, alkaline fuel cell, molten carbonate fuel cell and direct methanol fuel cells.
3. • Instrumental Errors:
• Due to inherent shortcomings in the instrument:
Due to mechanical structure, construction,
calibration or operation of instruments.
• Due to misuse of instruments: Failure to adjust
zero of instruments, poor initial adjustments,
using leads of too high resistance.
• Due to loading effects of instruments:
4. Environmental Errors:
• Errors due to temperature effect, humidity, dust,
external magnetic or electrostatic field.
Corrective measures:
• Try to keep the conditions constant.
• Use material which is immune to these effects.
• Using techniques which eliminates these effects.
• use air conditioner
• sealing certain component in the instruments
• use magnetic shields
5. Observational error
- introduce by the observer
- most common : parallax error and estimation
error (while reading the scale)
• Eg: an observer who tend to hold his head
too far to the left, while reading the position
of the needle on the scale.
6. Random Errors
• Random errors in experimental measurements
are caused by unknown and unpredictable
changes in the experiment.
• These changes may occur in the measuring
instruments or in the environmental conditions.
Examples of causes of random errors are:
• electronic noise in the circuit of an electrical
instrument,
• irregular changes in the heat loss rate from a
solar collector due to changes in the wind.
11. Speed of response
It is defined as the rapidity with which an
instrument, responds to the changes in the
measured quantity.
• It shows how active and fast the system is.
• Speed measuring instruments:-
12. Fidelity
It is defined as the degree to which a
measurement system is capable of faithfully
reproducing the changes in input, without any
dynamic error.
13. Measuring lag
Every system requires its own time to respond to the
changes in input. This time is called as lag.
• It is defined as the retardation or delay, in the response
of a system to the changes in the input.
• The lags are of two types:
1. Retardation lag:
• As soon as there is a changes in the measured quantity,
the measurement system begins to respond.
2. Time delay:
• The response of the measurement system starts after a
dead time, once the input is applied. They cause
dynamic error.
14. Dynamic error
• It is the difference between the true value of
the quantity that is to be measured, changing
with time and the measured value, if no static
error is assumed.