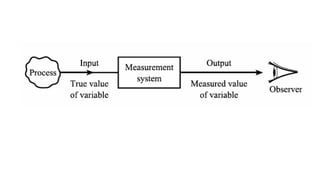
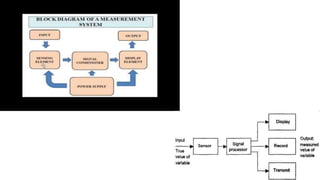
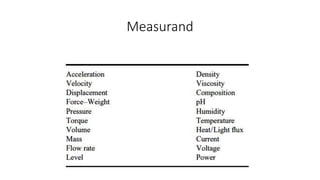
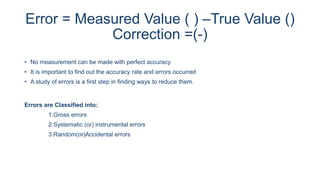
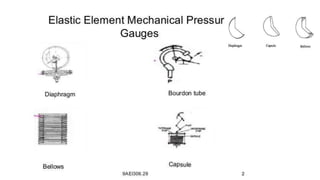
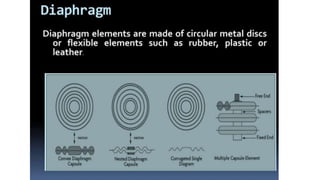
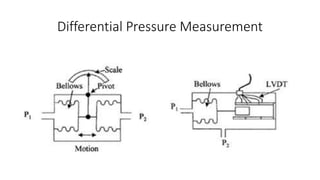
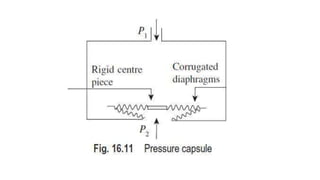
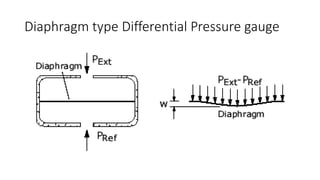
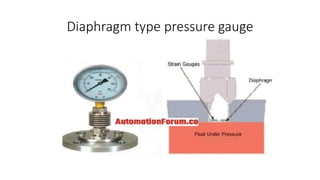
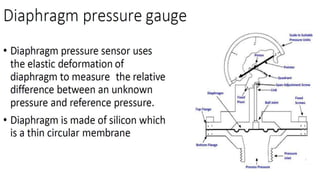
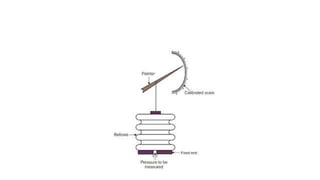
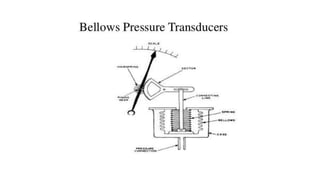
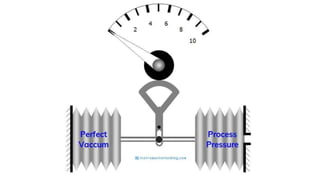
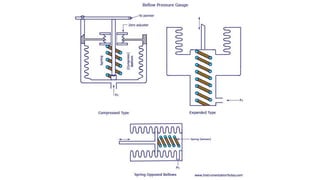
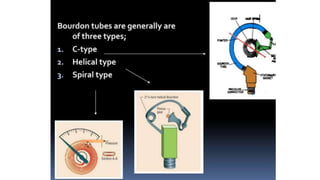
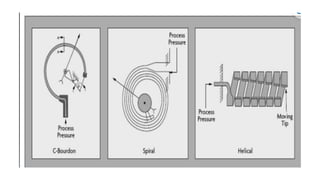
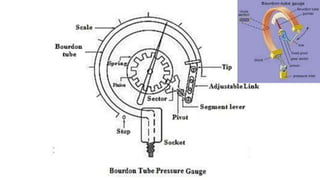
Instrumentation and Control Engineering
Unit 1:
• Fundamentals of Measurement Systems,
• Instrument Types
• Performance Characteristics,
• sources of error,
• classification and elimination of error,
• uncertainty analysis,
• statistical analysis of experimental data.
Measurand
Classification of Measuring Instruments
• Absolute and Secondary
• Analog and Digital
• Automatic and Manual
• Mechanical, Electrical and Electronics
• Self operated or Power operated (Passive and Active Instruments)
• Null or Deflection type
Absolute and Secondary
• Absolute instruments gives the value of the measurand with respect
to the constants of the instrument.
Example : Proving Ring for force measurement.
• Secondary Instruments will give instantaneous values of the
quantity to be measured.
example : voltmeter, a glass thermometer, and a pressure gauge
Passive and Active Measuring instruments
Static Characteristics
• Span
• Range
• Accuracy
• Precision
• Static Error
• Calibration
• Uncertainty
• Repeatability
• Reproducibility
• Stability
• Resolution
• Sensitivity
• Linearity
• Drift
• Threshold
• Dead Zone / Band
• Hysteresis
Range and Span
• Range : is defined as the measure of the instrument between
minimum value and the maximum value the instrument can measure.
• Span : is defined as the difference between the maximum and the
minimum value that the instrument can measure.
Accuracy
• It is defined as the closeness of the measured value to the true value of the
measurand.
• It indicates the maximum likely deviation of the measured value and the true value
of the quantity being measured.
• Accuracy of an instrument is specified as the uncertainty in the measured value.
• Accuracy as percentage span of the instrument. (Full scale deflection)
• Accuracy as percentage of True value. (measured Value)
• Point accuracy.
Volt meter with range of 0-20 V . One of the measured value is specified as 10±0.2V.
Express the measurement with accuracy as % of true value and % of span.
Precision
• Precision is defined as the degree of refinement with which a
measured value is stated.
Static Error
The static error of a measuring instrument is the numerical difference between the true value of a quantity and its value
as obtained by measurement, i.e. repeated measurement of the same quantity gives different indications. Types of Static
Errors are categorized as gross errors or human errors, systematic errors, and random errors
Calibration of the measuring instrument is the process in which the readings obtained from the instrument are compared
with the sub-standards in the laboratory at several points along the scale of the instrument. As per the results obtained
from the readings obtained of the instrument and the sub-standards, the curve is plotted. If the instrument is accurate
there will be matching of the scales of the instrument and the sub-standard. If there is deviation of the measured value
from the instrument against the standard value, the instrument is calibrated to give the correct values
Calibration
Repeatability
• Repeatability is defined as the variation in observations/
measurements obtained with one measuring equipment/gage
when used several times by one inspector/assessor while
measuring the same characteristics on the same/identical part.
Reproducibility
• Reproducibility is defined as the variation in the average of
observations/measurements made by different
inspectors/assessors using the same measuring
equipment/gage when measuring the same characteristic
on the same/identical part.
Stability
• Stability deals with the degree to which sensor characteristics remain
constant over time. Changes in stability, also known as drift, can be due to
components aging, decrease in sensitivity of components, and/or a change in
the signal to noise ratio, etc.
Resolution
• Resolution is the ability of the measurement system to detect and faithfully
indicate small changes in the characteristic of the measurement result
Sensitivity
Linearity
Linearity is an indicator of the consistency of measurements over the entire range of measurements.
In general, it is a good indicator of performance quality of a sensor. In simple terms, linearity tells us
how well the instrument measurement corresponds to reality.
Platinum have
been limited to
a temperature
range of –200°C
to 420°C
Copper is
limited to a
measurement
range of -200…
+260°C.
Nickel normally
can measure
the
temperature
from -60 to
180°C
Drift
Dead Zone , Hysteresis error and Threshold
Dynamics Characteristics
• Speed of Response.
• Measuring Lag
• Fidelity
• Dynamic Error
• Speed of Response
Fidelity
Error = Measured Value ( ) –True Value ()
Correction =(-)
• No measurement can be made with perfect accuracy
• It is important to find out the accuracy rate and errors occurred
• A study of errors is a first step in finding ways to reduce them.
Errors are Classified into:
1.Gross errors
2.Systematic (or) instrumental errors
3.Random(or)Accidental errors
Gross Errors
• Human mistakes in reading & recording instruments and calculating measurement result.
Ex: The temperature is 31.50C,but it is mistakenly written as 21.50c
• This can be avoided by adopting two means
• Great care should be taken in reading and recording the data.
• Two, three (or) even more readings should be taken for quantity under measurement
Systematic Errors
• These type of errors are divided into three categories.
• Instrumental errors
• Due to inherent short comings of the instrument
• Due to misuse of instruments
• Due to loading effects of instruments
• Environmental errors
• These errors are caused due to changes in the environmental conditions
in the area surrounding the instrument
• Observational errors
• These errors are caused by the habits of individual observers, which is
known as Parallax error
Instrumental errors
• The procedure of measurement must be carefully planned.
Substitution methods or calibration against standards may be used
for the purpose.
• Correction factors should be applied after determining the
instrumental errors.
• The instrument may be re-calibrated carefully.
Experimental Errors
Observational errors
• Modern electrical instruments have digital display of output which
completely eliminates the errors on account of human observational
or sensing powers as the output is in the form of digits.
Random Errors
• The causes of such errors is unknown (or) not determinable in the ordinary process making
measurements.
• Certain human errors
• Errors caused due to the disturbances to the equipment’s
• Errors caused by fluctuating experimental conditions.
Statistical Treatment of Data
• Multi sample Test : In this test, repeated measurement of a given
quantity are done using different test conditions (different
instruments, different ways different observers).
• Single sample Test : A single measurement done under identical
conditions excepting for time is known as single sample test.
Histogram
Arithmetic Mean
Measure of dispersion about the mean
Dispersion : the property which denotes the extent to which the values are dispersed about the mean central
value
• Range : Measure of dispersion
• Deviation : Deviation is departure of the observed reading from the
mean of the group of readings.
• Average Deviation: The average deviation is an indication of the
precision of the instruments used. Highly precise instruments yield a
low average deviation.
• Standard Deviation : root mean square deviation.
• Variance : The variance is the mean square deviation
Problem
Pressure Gauge
Differential Pressure Measurement
Diaphragm type Differential Pressure gauge
Diaphragm type pressure gauge
Spiral Bourdon Tube
Helical Type Bourdon Tube
MEASUREMENT OF LIQUID LEVEL
• Liquid level refers to the position or height of a liquid surface above a
datum line.
• Level measurements are made to a certain quantity of the liquid held
within a container.
• Level offers both the pressure and rate of flow in and out of the
container and as such its measurement and control is an important
function in a variety of processes.
• The task of liquid level measurement may be accomplished by direct
methods and indirect methods.
• Direct method
• Indirect Method
Direct Methods
• This is the simplest method of measuring liquid level. In this method, the level of liquid is measured
directly by means of the following level indicators:
• Hook-type Level Indicator
• Sight Glass
• Float-type
• Float and shaft liquid level gauge
TURBINE FLOW METER
Amplifiers
Mechanical Amplifiers
Hydraulic Amplifiers
Pneumatic Amplifier
Optical Amplifying Element

Instrumentation and Control Engineering ppt 1.pptx

  • 1.
    Instrumentation and ControlEngineering Unit 1: • Fundamentals of Measurement Systems, • Instrument Types • Performance Characteristics, • sources of error, • classification and elimination of error, • uncertainty analysis, • statistical analysis of experimental data.
  • 4.
  • 5.
    Classification of MeasuringInstruments • Absolute and Secondary • Analog and Digital • Automatic and Manual • Mechanical, Electrical and Electronics • Self operated or Power operated (Passive and Active Instruments) • Null or Deflection type
  • 6.
    Absolute and Secondary •Absolute instruments gives the value of the measurand with respect to the constants of the instrument. Example : Proving Ring for force measurement. • Secondary Instruments will give instantaneous values of the quantity to be measured. example : voltmeter, a glass thermometer, and a pressure gauge
  • 8.
    Passive and ActiveMeasuring instruments
  • 9.
    Static Characteristics • Span •Range • Accuracy • Precision • Static Error • Calibration • Uncertainty • Repeatability • Reproducibility • Stability • Resolution • Sensitivity • Linearity • Drift • Threshold • Dead Zone / Band • Hysteresis
  • 10.
    Range and Span •Range : is defined as the measure of the instrument between minimum value and the maximum value the instrument can measure. • Span : is defined as the difference between the maximum and the minimum value that the instrument can measure.
  • 11.
    Accuracy • It isdefined as the closeness of the measured value to the true value of the measurand. • It indicates the maximum likely deviation of the measured value and the true value of the quantity being measured. • Accuracy of an instrument is specified as the uncertainty in the measured value. • Accuracy as percentage span of the instrument. (Full scale deflection) • Accuracy as percentage of True value. (measured Value) • Point accuracy. Volt meter with range of 0-20 V . One of the measured value is specified as 10±0.2V. Express the measurement with accuracy as % of true value and % of span.
  • 12.
    Precision • Precision isdefined as the degree of refinement with which a measured value is stated.
  • 13.
    Static Error The staticerror of a measuring instrument is the numerical difference between the true value of a quantity and its value as obtained by measurement, i.e. repeated measurement of the same quantity gives different indications. Types of Static Errors are categorized as gross errors or human errors, systematic errors, and random errors Calibration of the measuring instrument is the process in which the readings obtained from the instrument are compared with the sub-standards in the laboratory at several points along the scale of the instrument. As per the results obtained from the readings obtained of the instrument and the sub-standards, the curve is plotted. If the instrument is accurate there will be matching of the scales of the instrument and the sub-standard. If there is deviation of the measured value from the instrument against the standard value, the instrument is calibrated to give the correct values Calibration
  • 14.
    Repeatability • Repeatability isdefined as the variation in observations/ measurements obtained with one measuring equipment/gage when used several times by one inspector/assessor while measuring the same characteristics on the same/identical part. Reproducibility • Reproducibility is defined as the variation in the average of observations/measurements made by different inspectors/assessors using the same measuring equipment/gage when measuring the same characteristic on the same/identical part.
  • 15.
    Stability • Stability dealswith the degree to which sensor characteristics remain constant over time. Changes in stability, also known as drift, can be due to components aging, decrease in sensitivity of components, and/or a change in the signal to noise ratio, etc.
  • 16.
    Resolution • Resolution isthe ability of the measurement system to detect and faithfully indicate small changes in the characteristic of the measurement result
  • 17.
  • 18.
    Linearity Linearity is anindicator of the consistency of measurements over the entire range of measurements. In general, it is a good indicator of performance quality of a sensor. In simple terms, linearity tells us how well the instrument measurement corresponds to reality. Platinum have been limited to a temperature range of –200°C to 420°C Copper is limited to a measurement range of -200… +260°C. Nickel normally can measure the temperature from -60 to 180°C
  • 19.
  • 20.
    Dead Zone ,Hysteresis error and Threshold
  • 21.
    Dynamics Characteristics • Speedof Response. • Measuring Lag • Fidelity • Dynamic Error
  • 22.
    • Speed ofResponse
  • 23.
  • 25.
    Error = MeasuredValue ( ) –True Value () Correction =(-) • No measurement can be made with perfect accuracy • It is important to find out the accuracy rate and errors occurred • A study of errors is a first step in finding ways to reduce them. Errors are Classified into: 1.Gross errors 2.Systematic (or) instrumental errors 3.Random(or)Accidental errors
  • 26.
    Gross Errors • Humanmistakes in reading & recording instruments and calculating measurement result. Ex: The temperature is 31.50C,but it is mistakenly written as 21.50c • This can be avoided by adopting two means • Great care should be taken in reading and recording the data. • Two, three (or) even more readings should be taken for quantity under measurement
  • 27.
    Systematic Errors • Thesetype of errors are divided into three categories. • Instrumental errors • Due to inherent short comings of the instrument • Due to misuse of instruments • Due to loading effects of instruments • Environmental errors • These errors are caused due to changes in the environmental conditions in the area surrounding the instrument • Observational errors • These errors are caused by the habits of individual observers, which is known as Parallax error
  • 28.
    Instrumental errors • Theprocedure of measurement must be carefully planned. Substitution methods or calibration against standards may be used for the purpose. • Correction factors should be applied after determining the instrumental errors. • The instrument may be re-calibrated carefully.
  • 29.
  • 30.
    Observational errors • Modernelectrical instruments have digital display of output which completely eliminates the errors on account of human observational or sensing powers as the output is in the form of digits.
  • 31.
    Random Errors • Thecauses of such errors is unknown (or) not determinable in the ordinary process making measurements. • Certain human errors • Errors caused due to the disturbances to the equipment’s • Errors caused by fluctuating experimental conditions.
  • 32.
    Statistical Treatment ofData • Multi sample Test : In this test, repeated measurement of a given quantity are done using different test conditions (different instruments, different ways different observers). • Single sample Test : A single measurement done under identical conditions excepting for time is known as single sample test.
  • 33.
  • 34.
    Arithmetic Mean Measure ofdispersion about the mean Dispersion : the property which denotes the extent to which the values are dispersed about the mean central value
  • 35.
    • Range :Measure of dispersion • Deviation : Deviation is departure of the observed reading from the mean of the group of readings. • Average Deviation: The average deviation is an indication of the precision of the instruments used. Highly precise instruments yield a low average deviation. • Standard Deviation : root mean square deviation.
  • 36.
    • Variance :The variance is the mean square deviation
  • 37.
  • 38.
  • 41.
  • 43.
  • 44.
  • 53.
  • 54.
  • 56.
    MEASUREMENT OF LIQUIDLEVEL • Liquid level refers to the position or height of a liquid surface above a datum line. • Level measurements are made to a certain quantity of the liquid held within a container. • Level offers both the pressure and rate of flow in and out of the container and as such its measurement and control is an important function in a variety of processes. • The task of liquid level measurement may be accomplished by direct methods and indirect methods. • Direct method • Indirect Method
  • 57.
    Direct Methods • Thisis the simplest method of measuring liquid level. In this method, the level of liquid is measured directly by means of the following level indicators: • Hook-type Level Indicator • Sight Glass • Float-type • Float and shaft liquid level gauge
  • 67.
  • 70.
  • 71.
  • 72.
  • 73.