WHAT IS QC?
• QC is a technique that is used to detect &
correct errors before they result in a defective
product or service.
• It refers to the measures that must be
included during each assay run to verify that
the test is working properly.
• QC must be practical, achievable & affordable.
3.
TERMINOLOGY
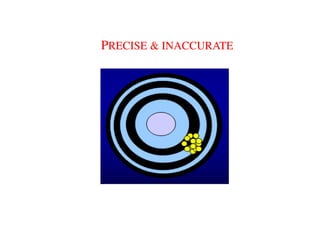
• PRECISION: Thisindicates how close test
measurements to each other when the same
test is run on the same sample repeatedly.
• Precision does not imply accuracy.
• Precision does not imply accuracy.
• ACCURACY: How close to the true value a
measurement is.
• The closer to the actual value, the more
accurate.
4.
• STANDARD: Thisis a substance of constant
composition of sufficient purity to be used for
comparison purpose.
• CONTROL: This is a sample i.e. chemically &
physically similar to the unknown specimen.
physically similar to the unknown specimen.
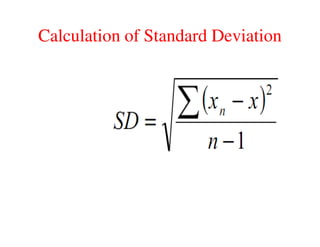
• STANDARD DEVIATION: This is a statistical
expression of scatter or dispersion of values
around a central average value.
Coefficient of Variation
Coefficientof Variation
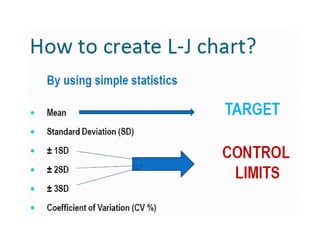
• The Coefficient of Variation (CV) is the
standard Deviation (SD) expressed as a
percentage of the mean
-Also known as Relative Standard
deviation (RSD)
• CV % = SD x 100
Mean
7.
CALCULATION OF MEAN
Dataset
(30.0, 32.0, 31.5, 33.5, 32.0, 33.0, 29.0,29.5, 31.0,
32.5, 34.5, 33.5, 31.5, 30.5, 30.0, 34.0,32.0, 32.0,
32.5, 34.5, 33.5, 31.5, 30.5, 30.0, 34.0,32.0, 32.0,
35.0, 32.5.) mg/dL
The sum of the values (X1 + X2 + X3 … X20)
divided by the number (n) of observations
The mean of these 20 observations is (639.5 ÷ 20)
= 32.0 mg/dL
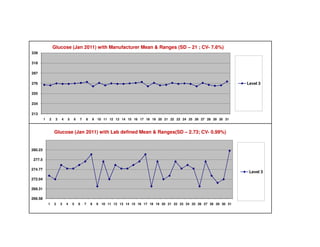
L. J. CHART
•L-J chart is a graph that quality control data is
plotted on to give a visual indication whether
a laboratory test is working well.
• It is named after S.LEVEY & E.R.JENNINGS in
1950.
Normal Distribution
Normal Distribution
•All values are symmetrically distributed around the mean
• Characteristic “bell-shaped” curve
• Assumed for all quality control statistics
17.
INTERNAL QUALITY CONTROL
•Use of standard glassware , reagent
, equipment
• Well trained staff
• Selection of accurate & precise
method.
18.
• At leastone primary std. is included
with each batch of unknown specimen
analysis.
• Occasionally a different primary std . of
higher concentration is included to
check the reliability of routine primary
higher concentration is included to
check the reliability of routine primary
std.
• The batch result are accepted if the
values of control sera are within first SD.
19.
Types of Errors
•Intrinsic : due to an imprecise &
inaccurate method.
• Systemic : all high values , all low
values.
• Random : technical errors.
20.
• Intrinsic errorscan be eliminated by
A) selecting precise & accurate method.
B) by using fresh batches of reagents.
• systemic errors can be eliminated by using diff.
concentration of primary std. & analyzing
concentration of primary std. & analyzing
control serum.
• Technical with a proper analytical application
can be correct random errors.
21.
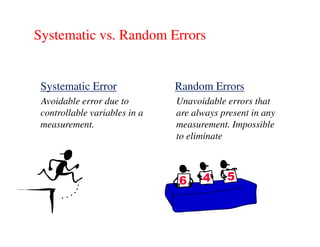
Systematic vs. RandomErrors
Systematic vs. Random Errors
Systematic Error
Avoidable error due to
controllable variables in a
measurement.
Random Errors
Unavoidable errors that
are always present in any
measurement. Impossible
measurement. measurement. Impossible
to eliminate
22.
PREVENTIVE PHASE
• Collectionof specimen
• Separation of serum
• Specimen analysis
• Calculation of test values etc..
OPTIMUM CONDITION VARIANCE
•Refers to the results obtained under
optimum conditions i.e. by using
i)freshly prepared reagents
ii)by using standardized glassware
25.
ROUTINE CONDITIONS VARIANCE
•Refers to the results obtained by using routine
requirements i.e. by using routinely stored
reagents and glassware in regular use.
• Multi controlQC rules (WESTGARD RULES)
given by Dr. James Westgard of the University of
Wisconsin in an article in 1981 on laboratory
quality control that set the basis for evaluating
analytical run quality for medical laboratories.
• The Westgard system -based on the principles of
statistical process control used in manufacturing
statistical process control used in manufacturing
nationwide since the 1950s
• Six basic rules in the Westgard scheme: 1-3s, 2-
2s, R-4s, 1-2s, 4-1s, and 10x. These rules are used
individually or in combination (multi-rule) to
evaluate the quality of analytical runs.
• Detect random or systematic errors
28.
• Warning 12SDor 1-2s:
It is violated if the single IQC
value exceeds the mean by ± 2SD.
29.
• Rejection 22SDor 2-2s:
• This rule detects systematic error and is applied within and across
runs.
• It is violated within the run when two consecutive control values
exceed the "same" (mean + 2s or mean - 2s) limit.
• The rule is violated across runs when the previous value for a
particular control level exceeds the "same"
(mean + 2s or mean - 2s) limit.
(mean + 2s or mean - 2s) limit.
Within run violation Across run violation
30.
• Rejection 13SDor 1-3s:
• It is violated when the single IQC
value exceeds the mean by ±3SD.
• This rule is applied within control
material only.
• The 1-3s rule identifies unacceptable
random error or possibly the
beginning of a large systematic error.
• Rejection 41SD or 4-1s:
It is violated if four consecutive IQC
values exceed the same mean plus 1s
or the same mean minus 1s control limit.
31.
• Rejection 10x:
•This rule detects systematic bias and is applied both within and
across control materials.
• It is violated across control materials if the last 10 consecutive
values, regardless of control level, are on the same side of the
mean.
• The rule is violated within the control materials if the last 10
values for the same control level are on the same side of the
mean.
EXTERNAL QUALITY CONTROL
•All the participating laboratories daily
analyze the same lot of control material.
• The results are tabulated monthly & sent
the sponsoring groups for the data
the sponsoring groups for the data
analysis.
• Summary reports are prepared by the
program sponsor & are distributed to all
participating laboratories .
34.
• The meanof values of all reference
laboratories is taken as the “ true “ or
correct value & is used for comparison
with the individual laboratory reported
values.
values.
• If the difference between the reported
value & the true value is statistically
significant then the reporting lab is
alerted.