QUALITY IS……..
A measureof excellence, or
State of being free from defects,
deficiencies, and significant
variations
Invisible when GOOD
Impossible to ignore when
BAD
3.
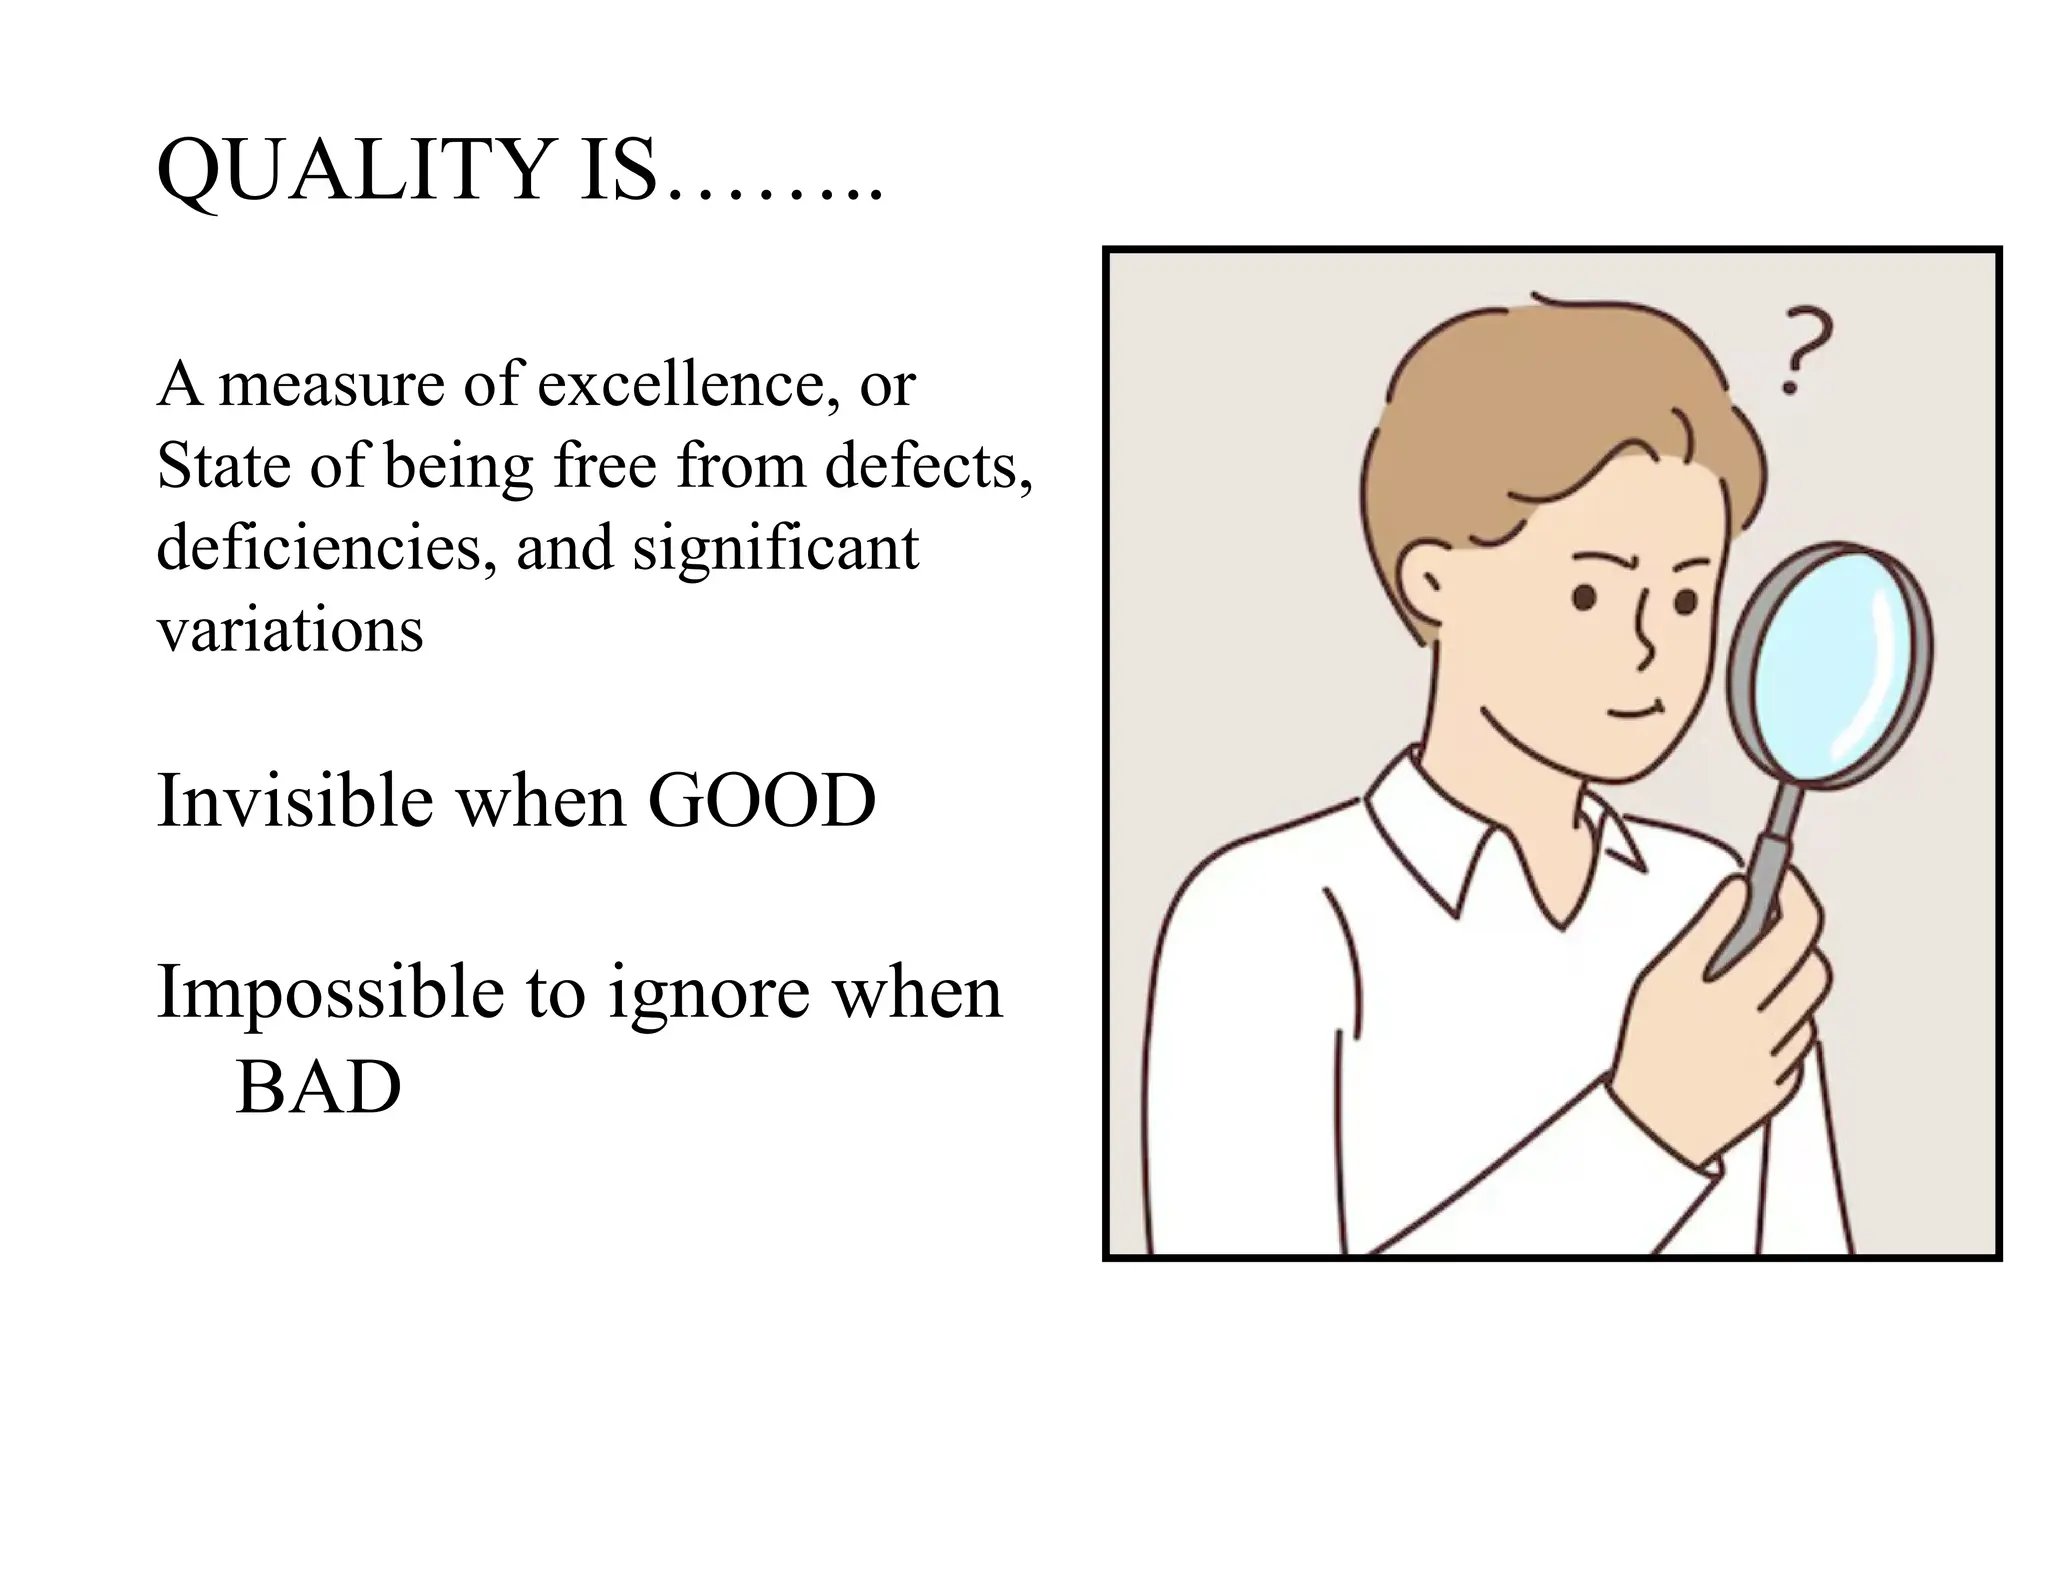
• Quality Assurance
An
overallmanagement
plan to
guarantee the
integrity of data
(THE SYSTEM)
• Quality Control
A series of
analytical
measurements used
to assess the quality
of the analytical
data (THE TOOLS)
5.
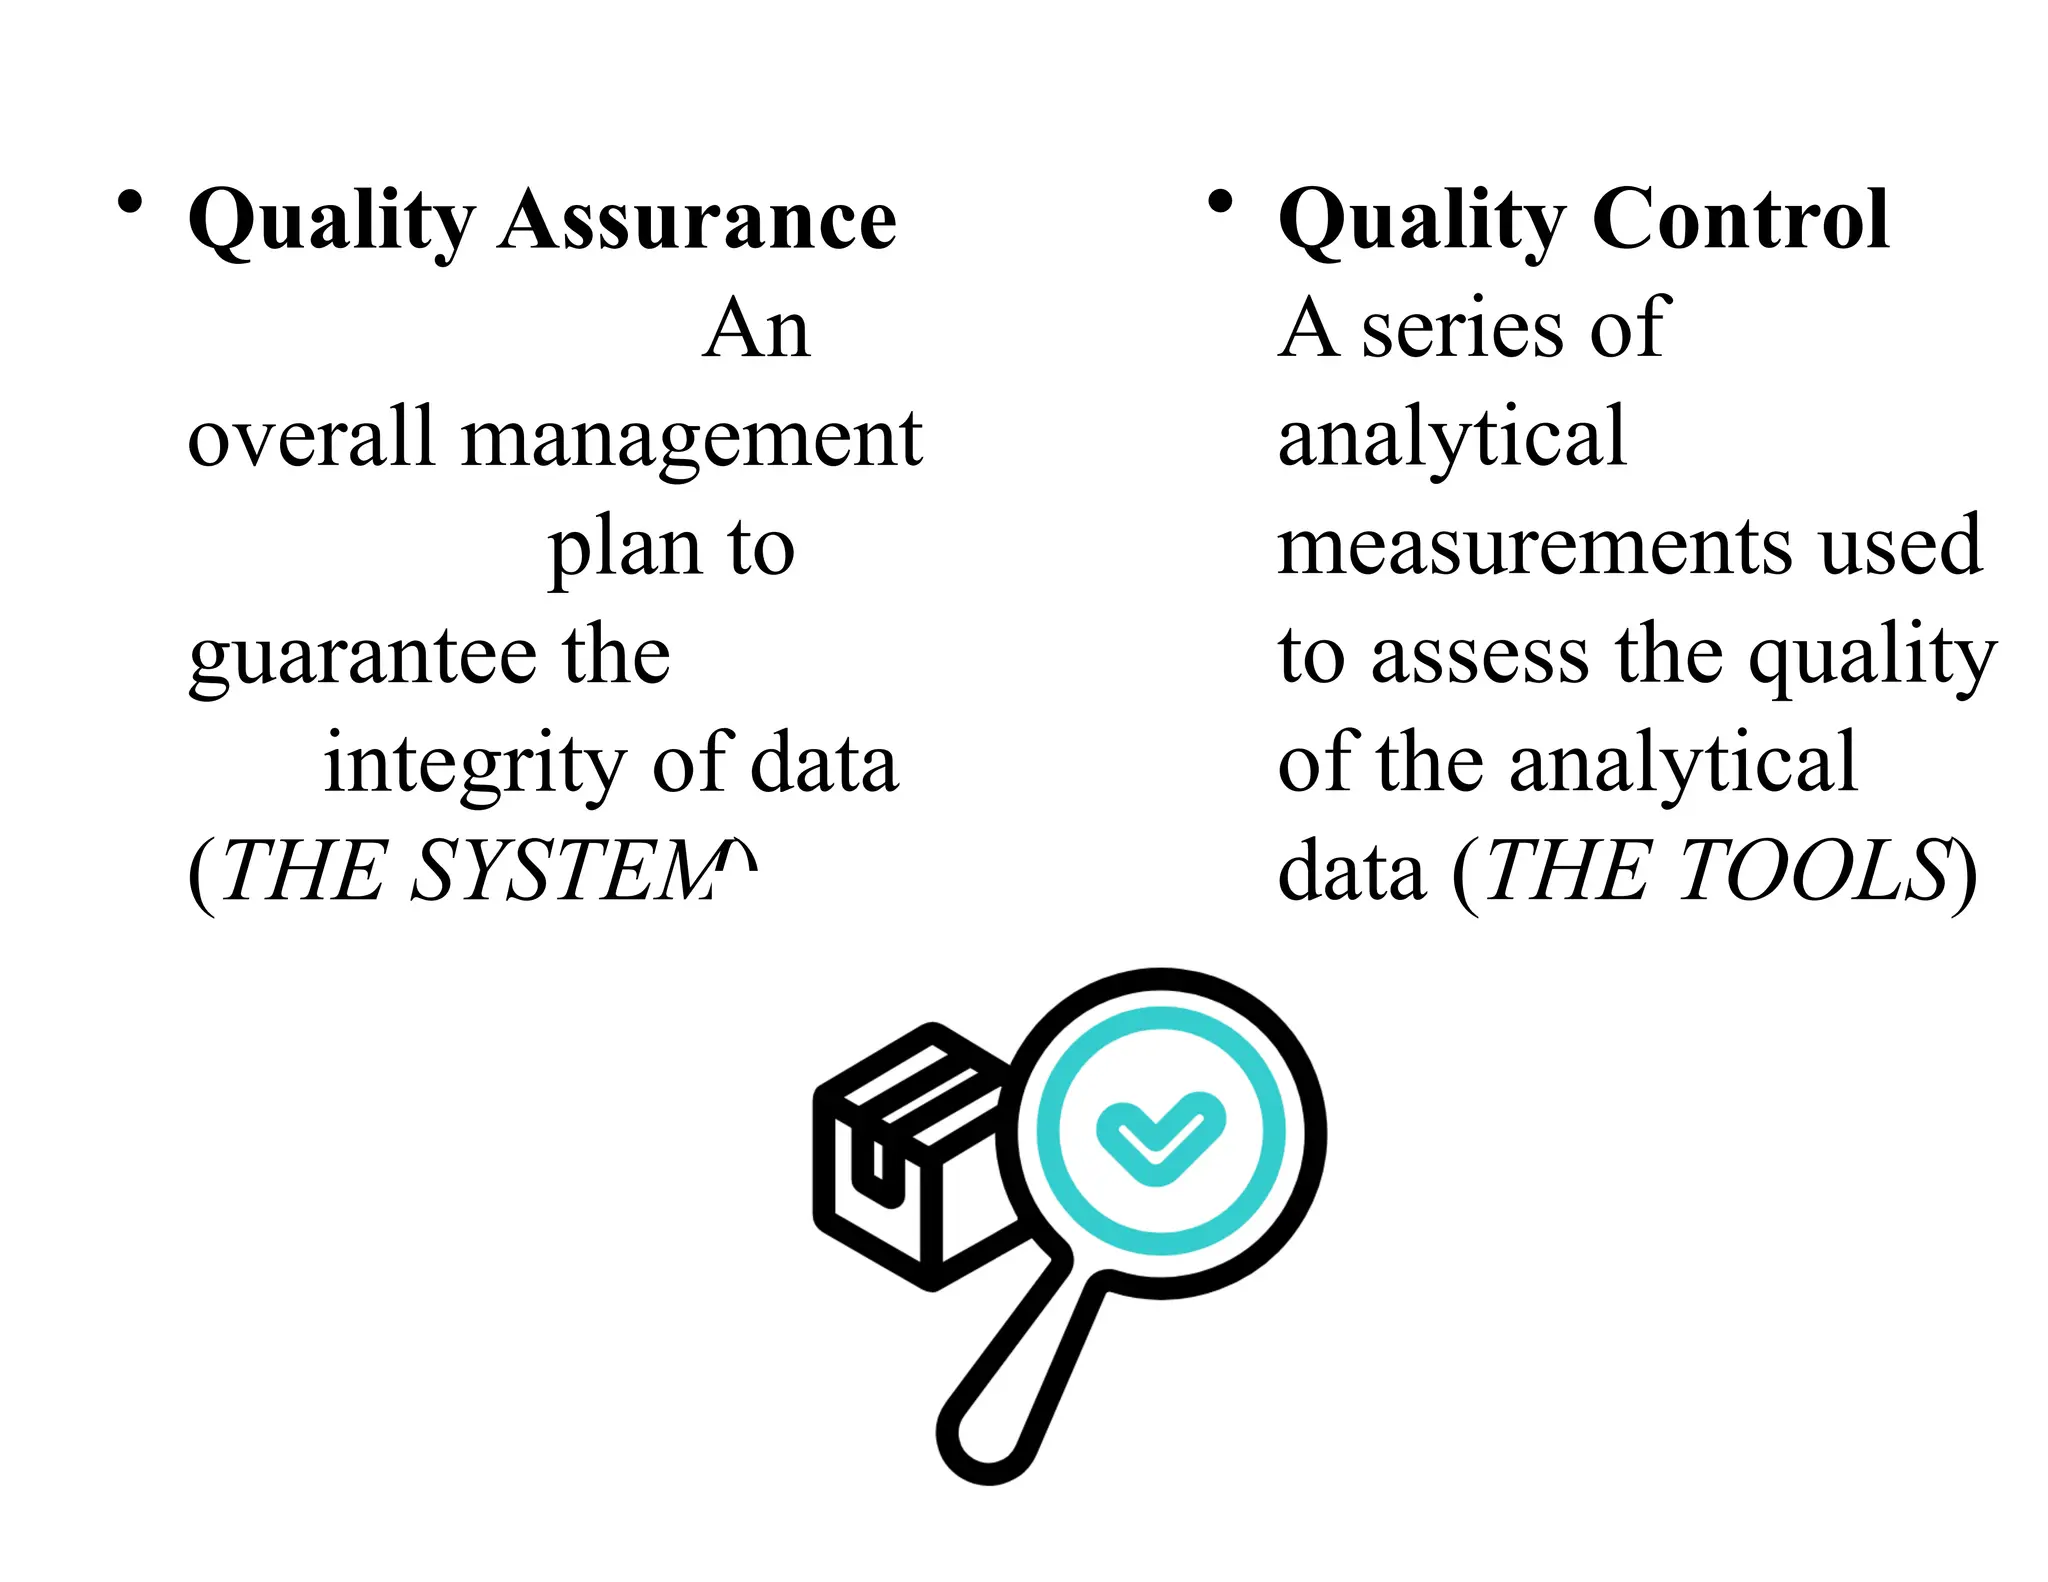
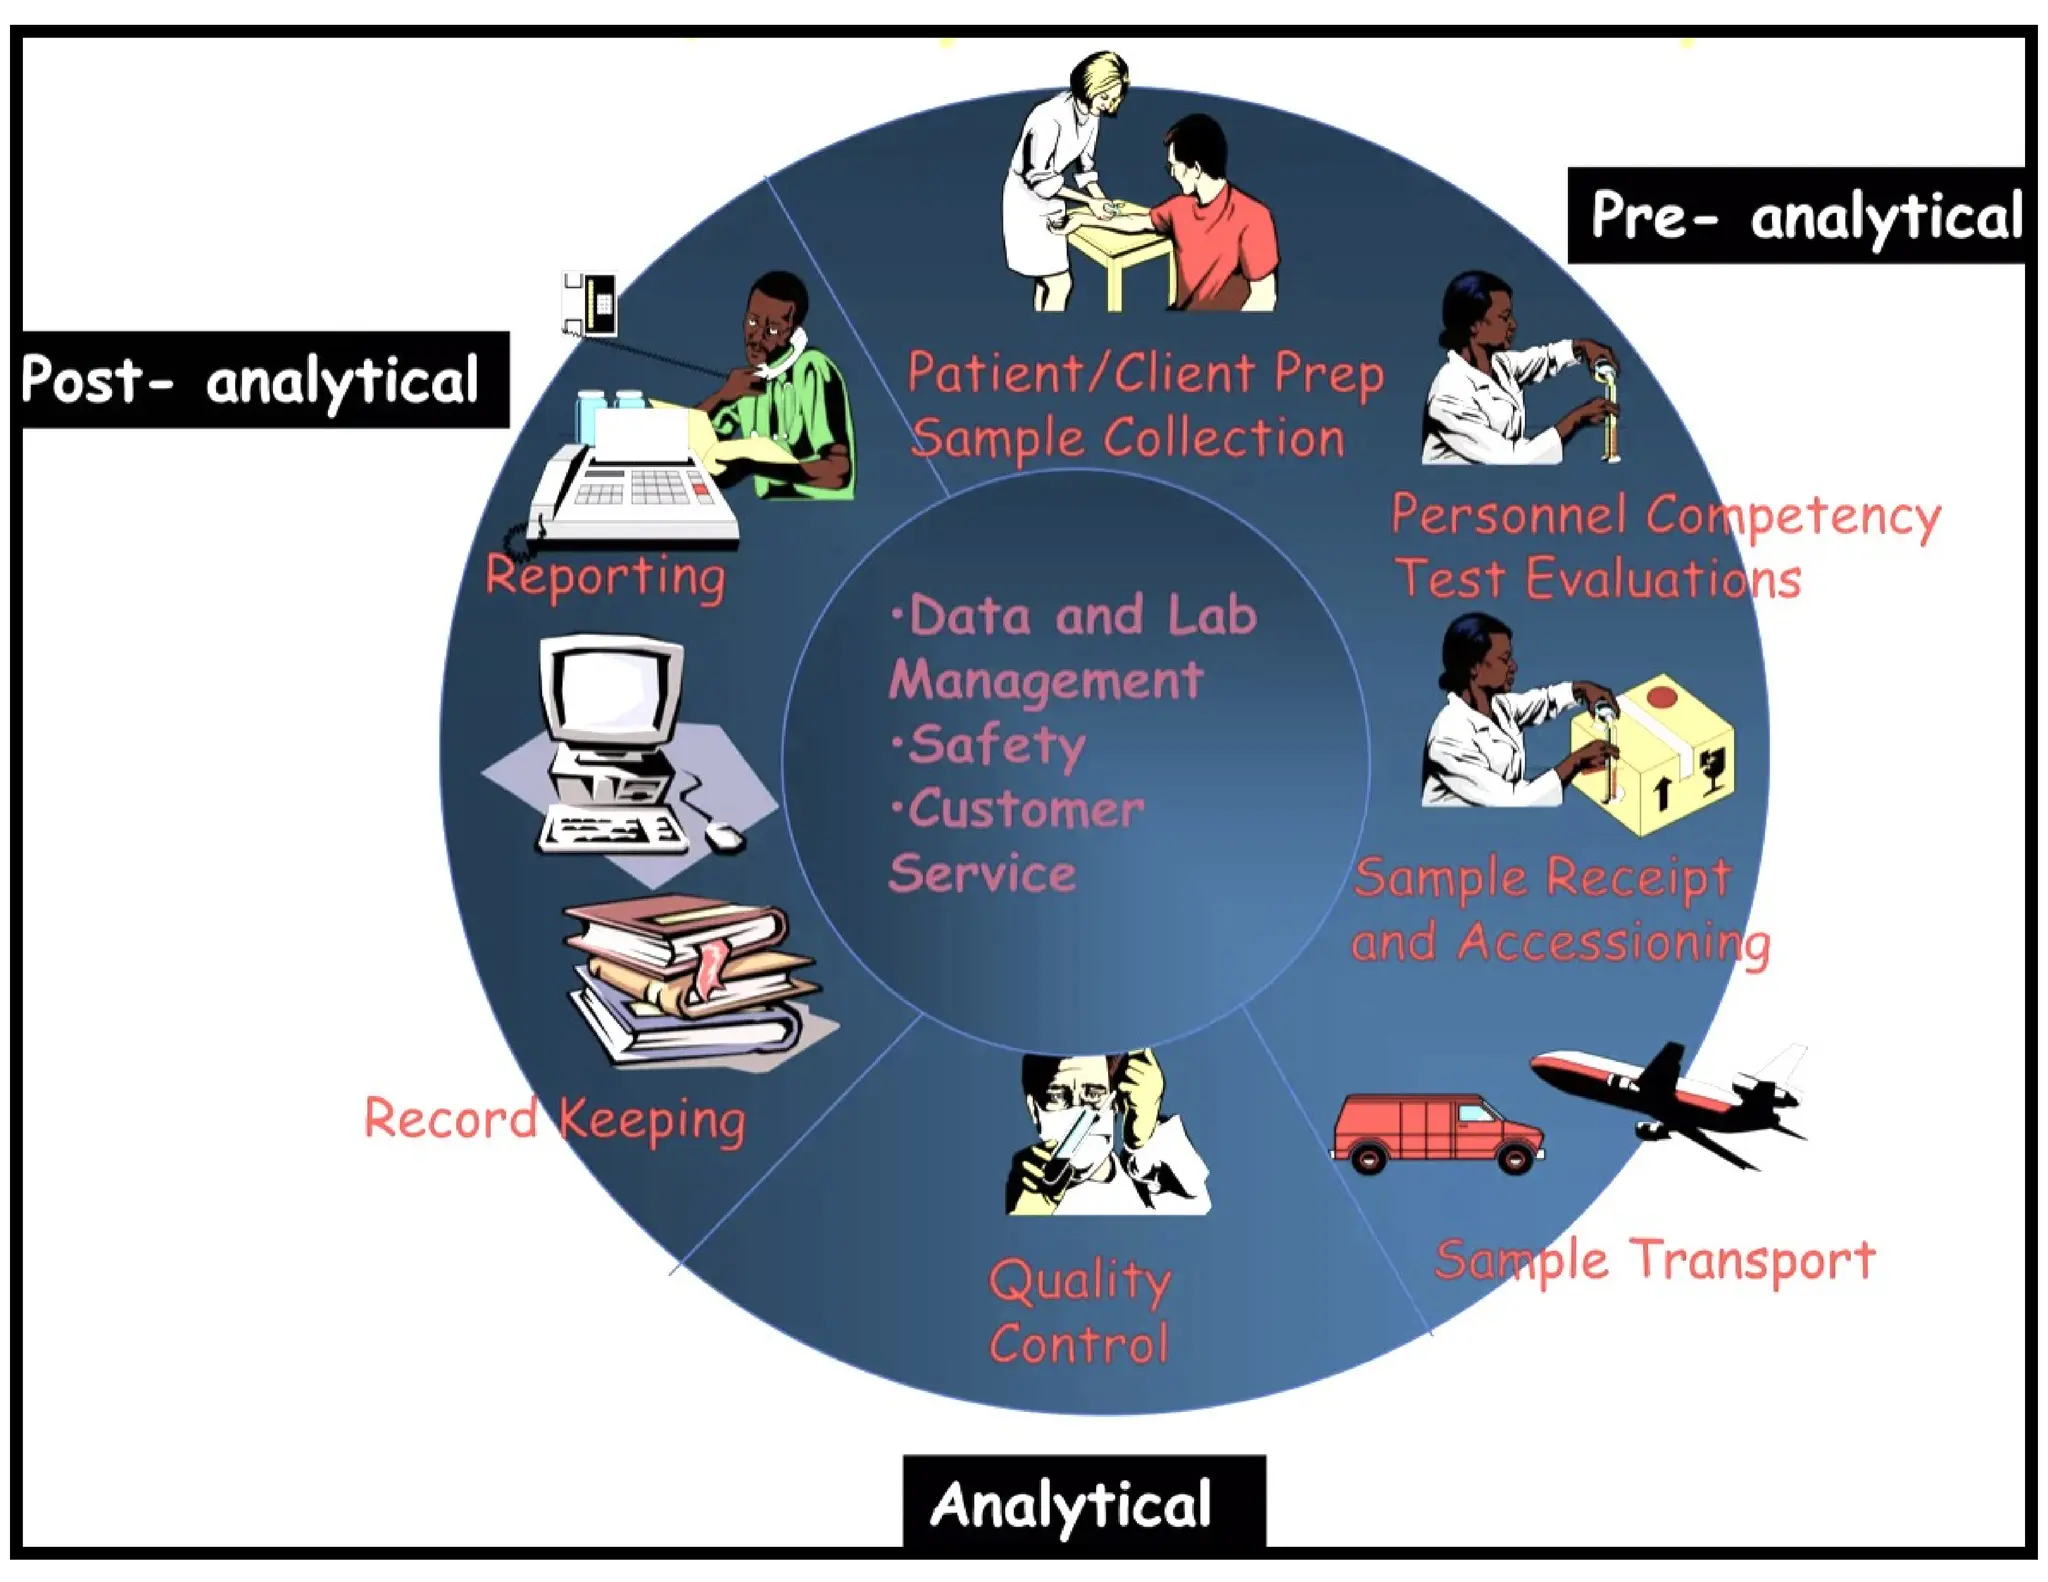
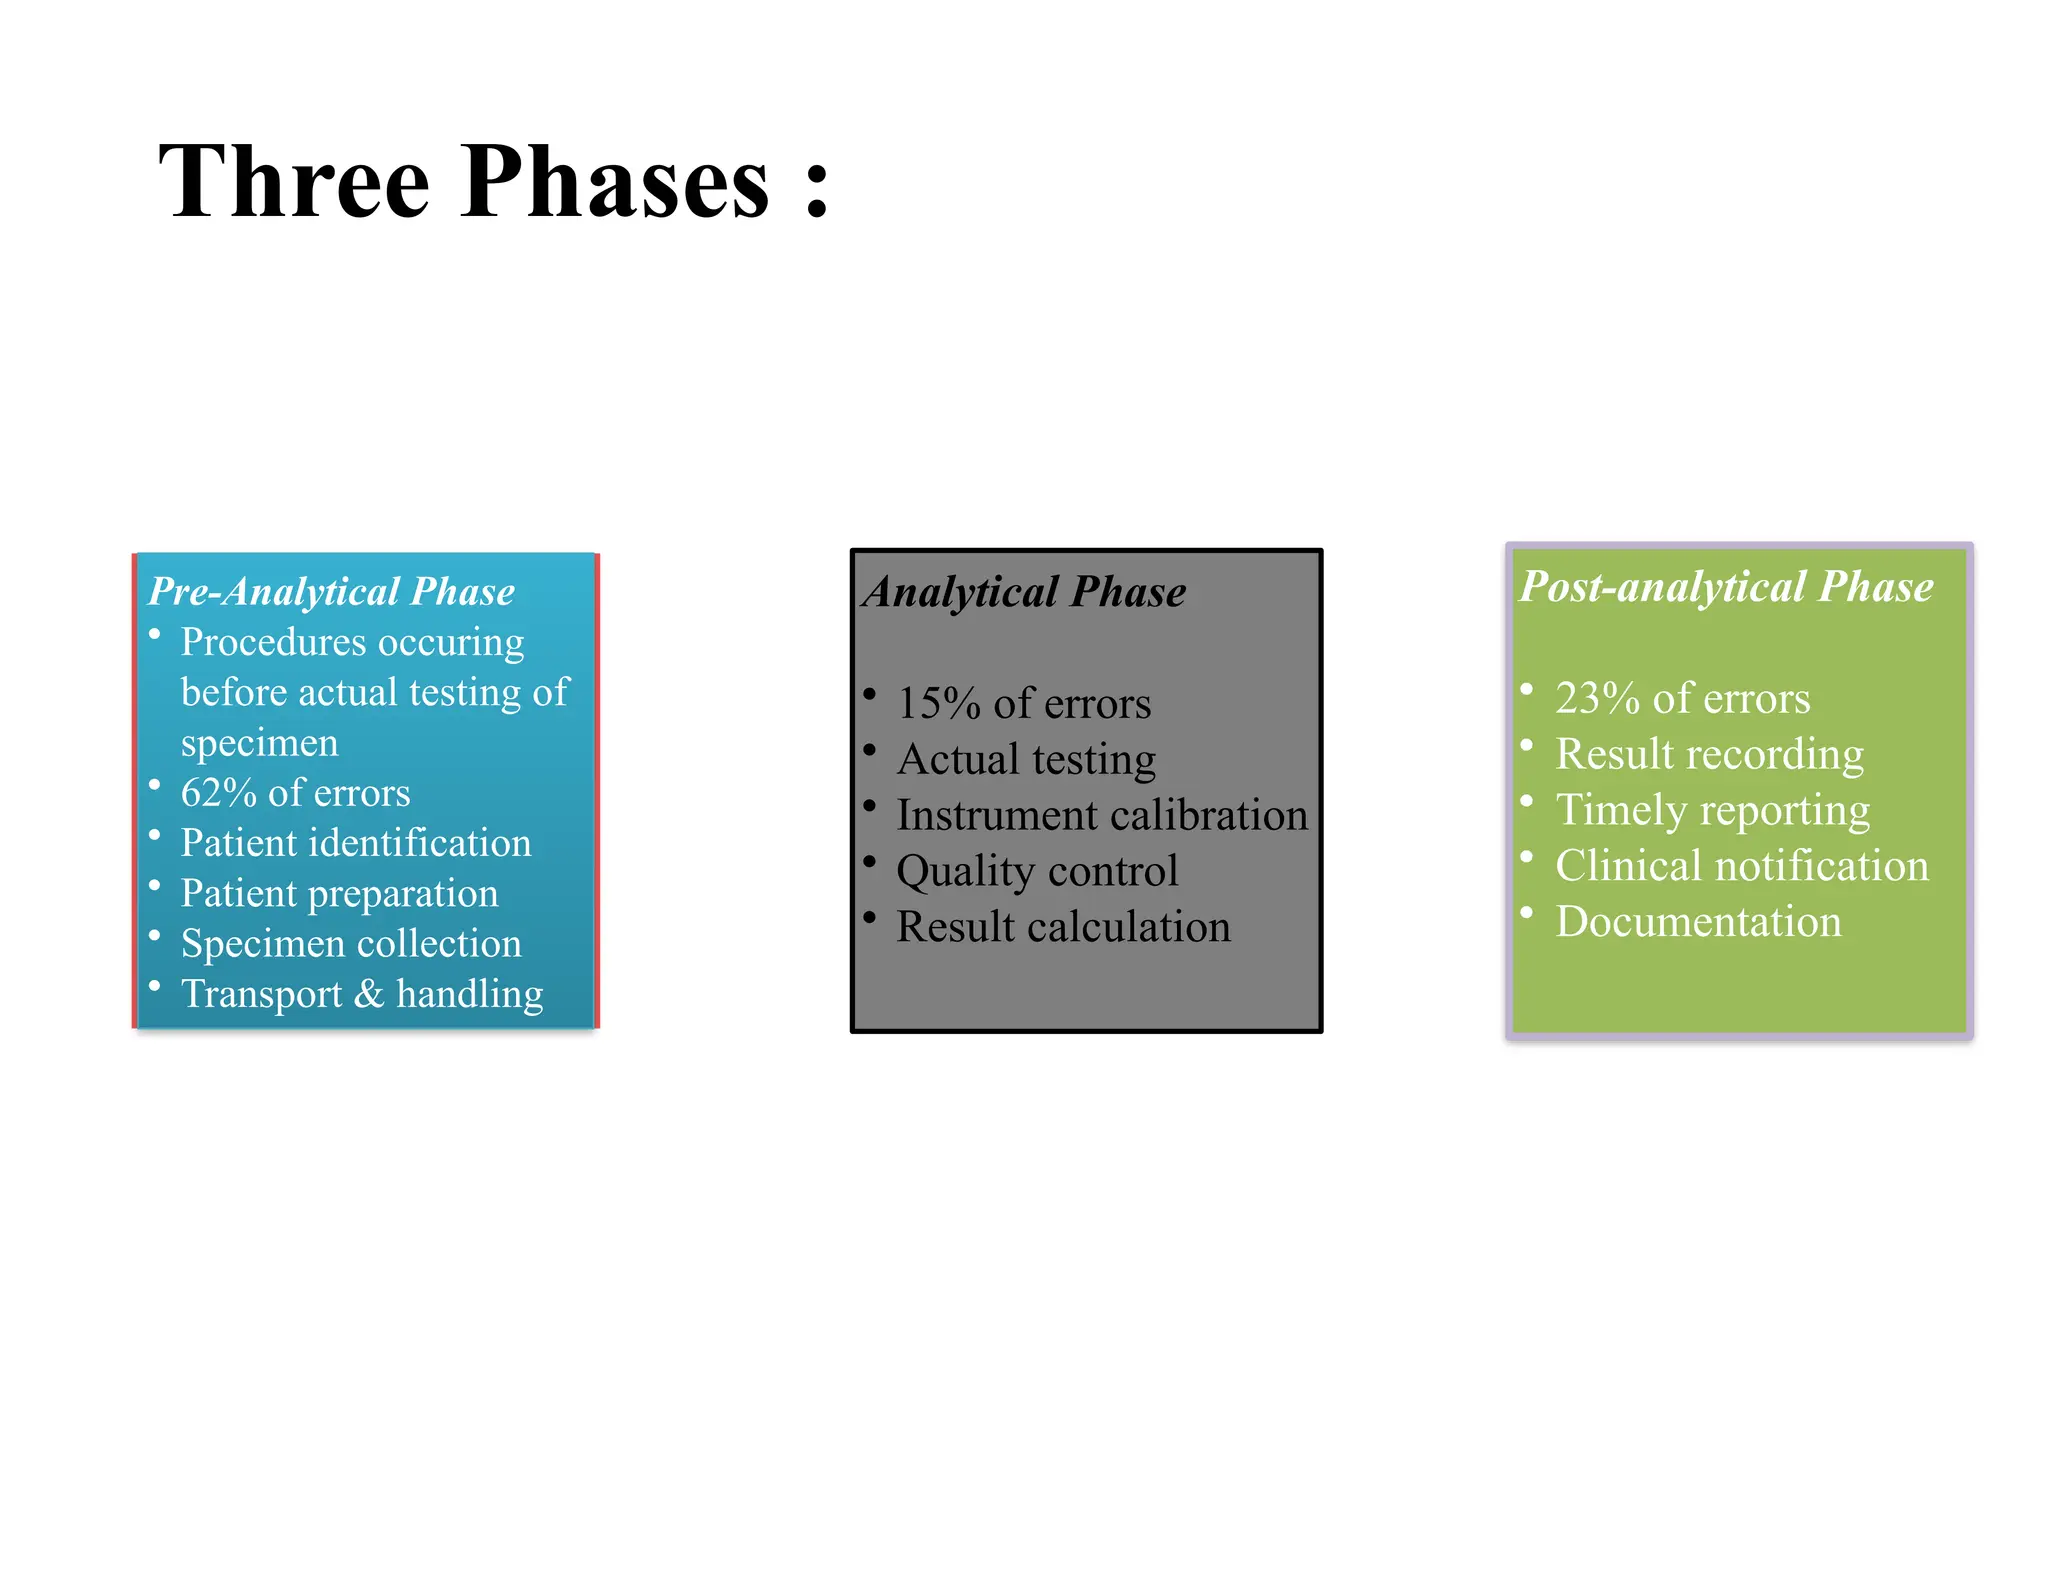
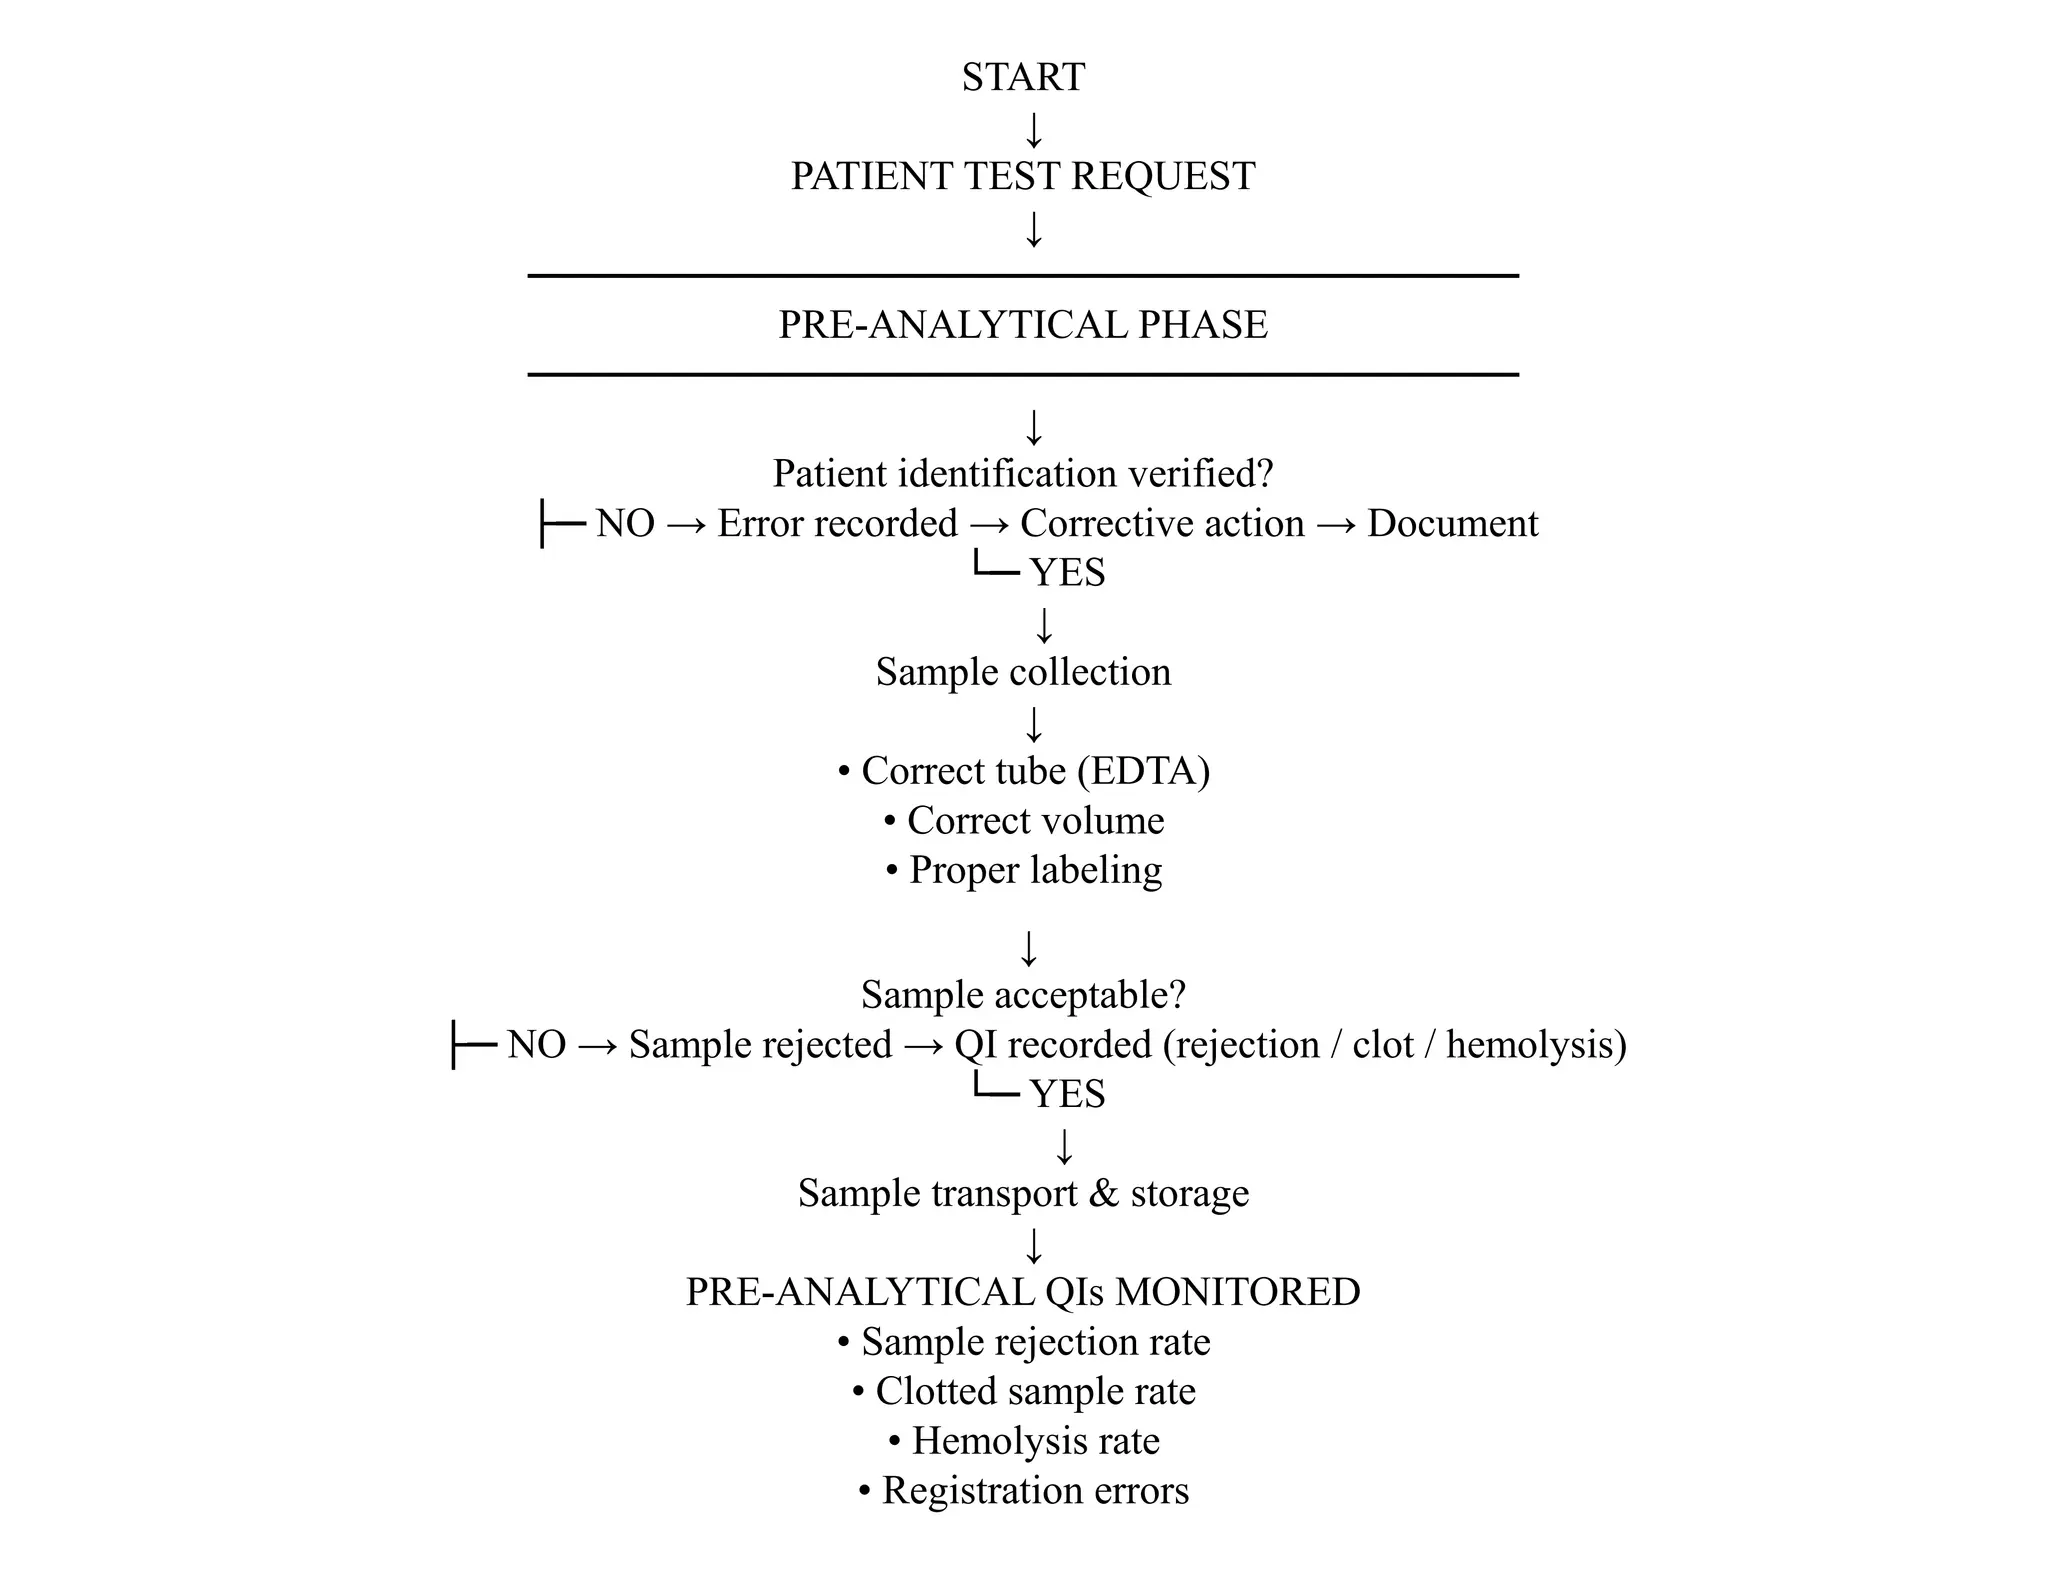
Three Phases :
Pre-AnalyticalPhase
• Procedures occuring
before actual testing of
specimen
• 62% of errors
• Patient identification
• Patient preparation
• Specimen collection
• Transport & handling
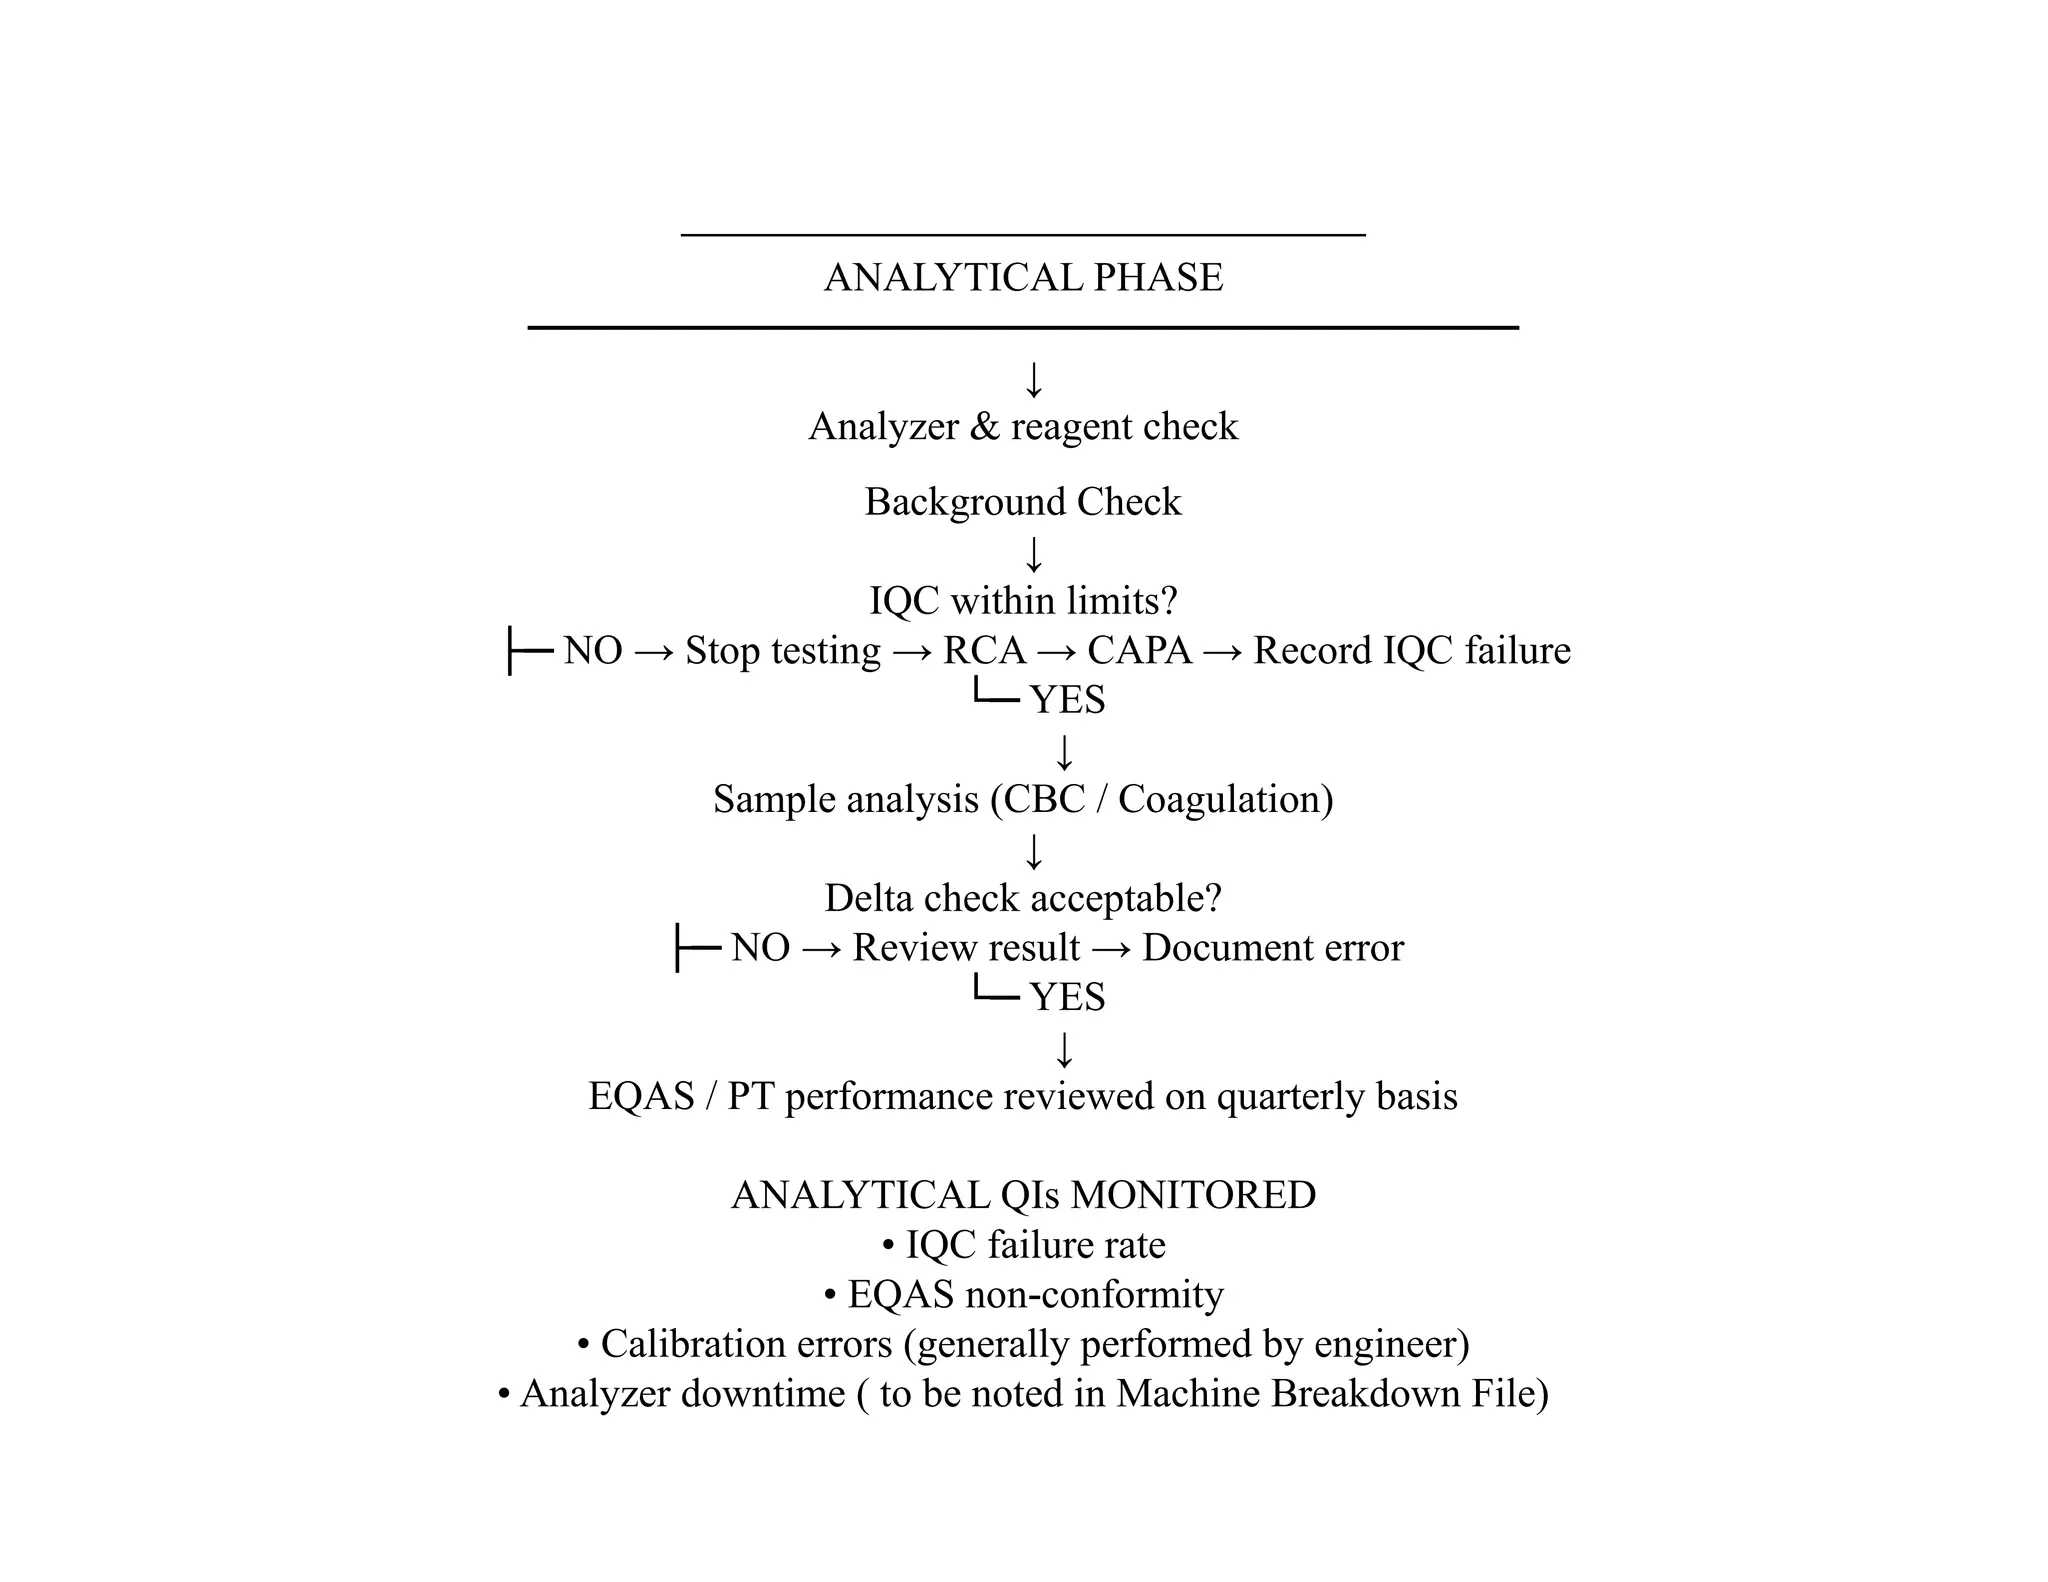
Analytical Phase
• 15% of errors
• Actual testing
• Instrument calibration
• Quality control
• Result calculation
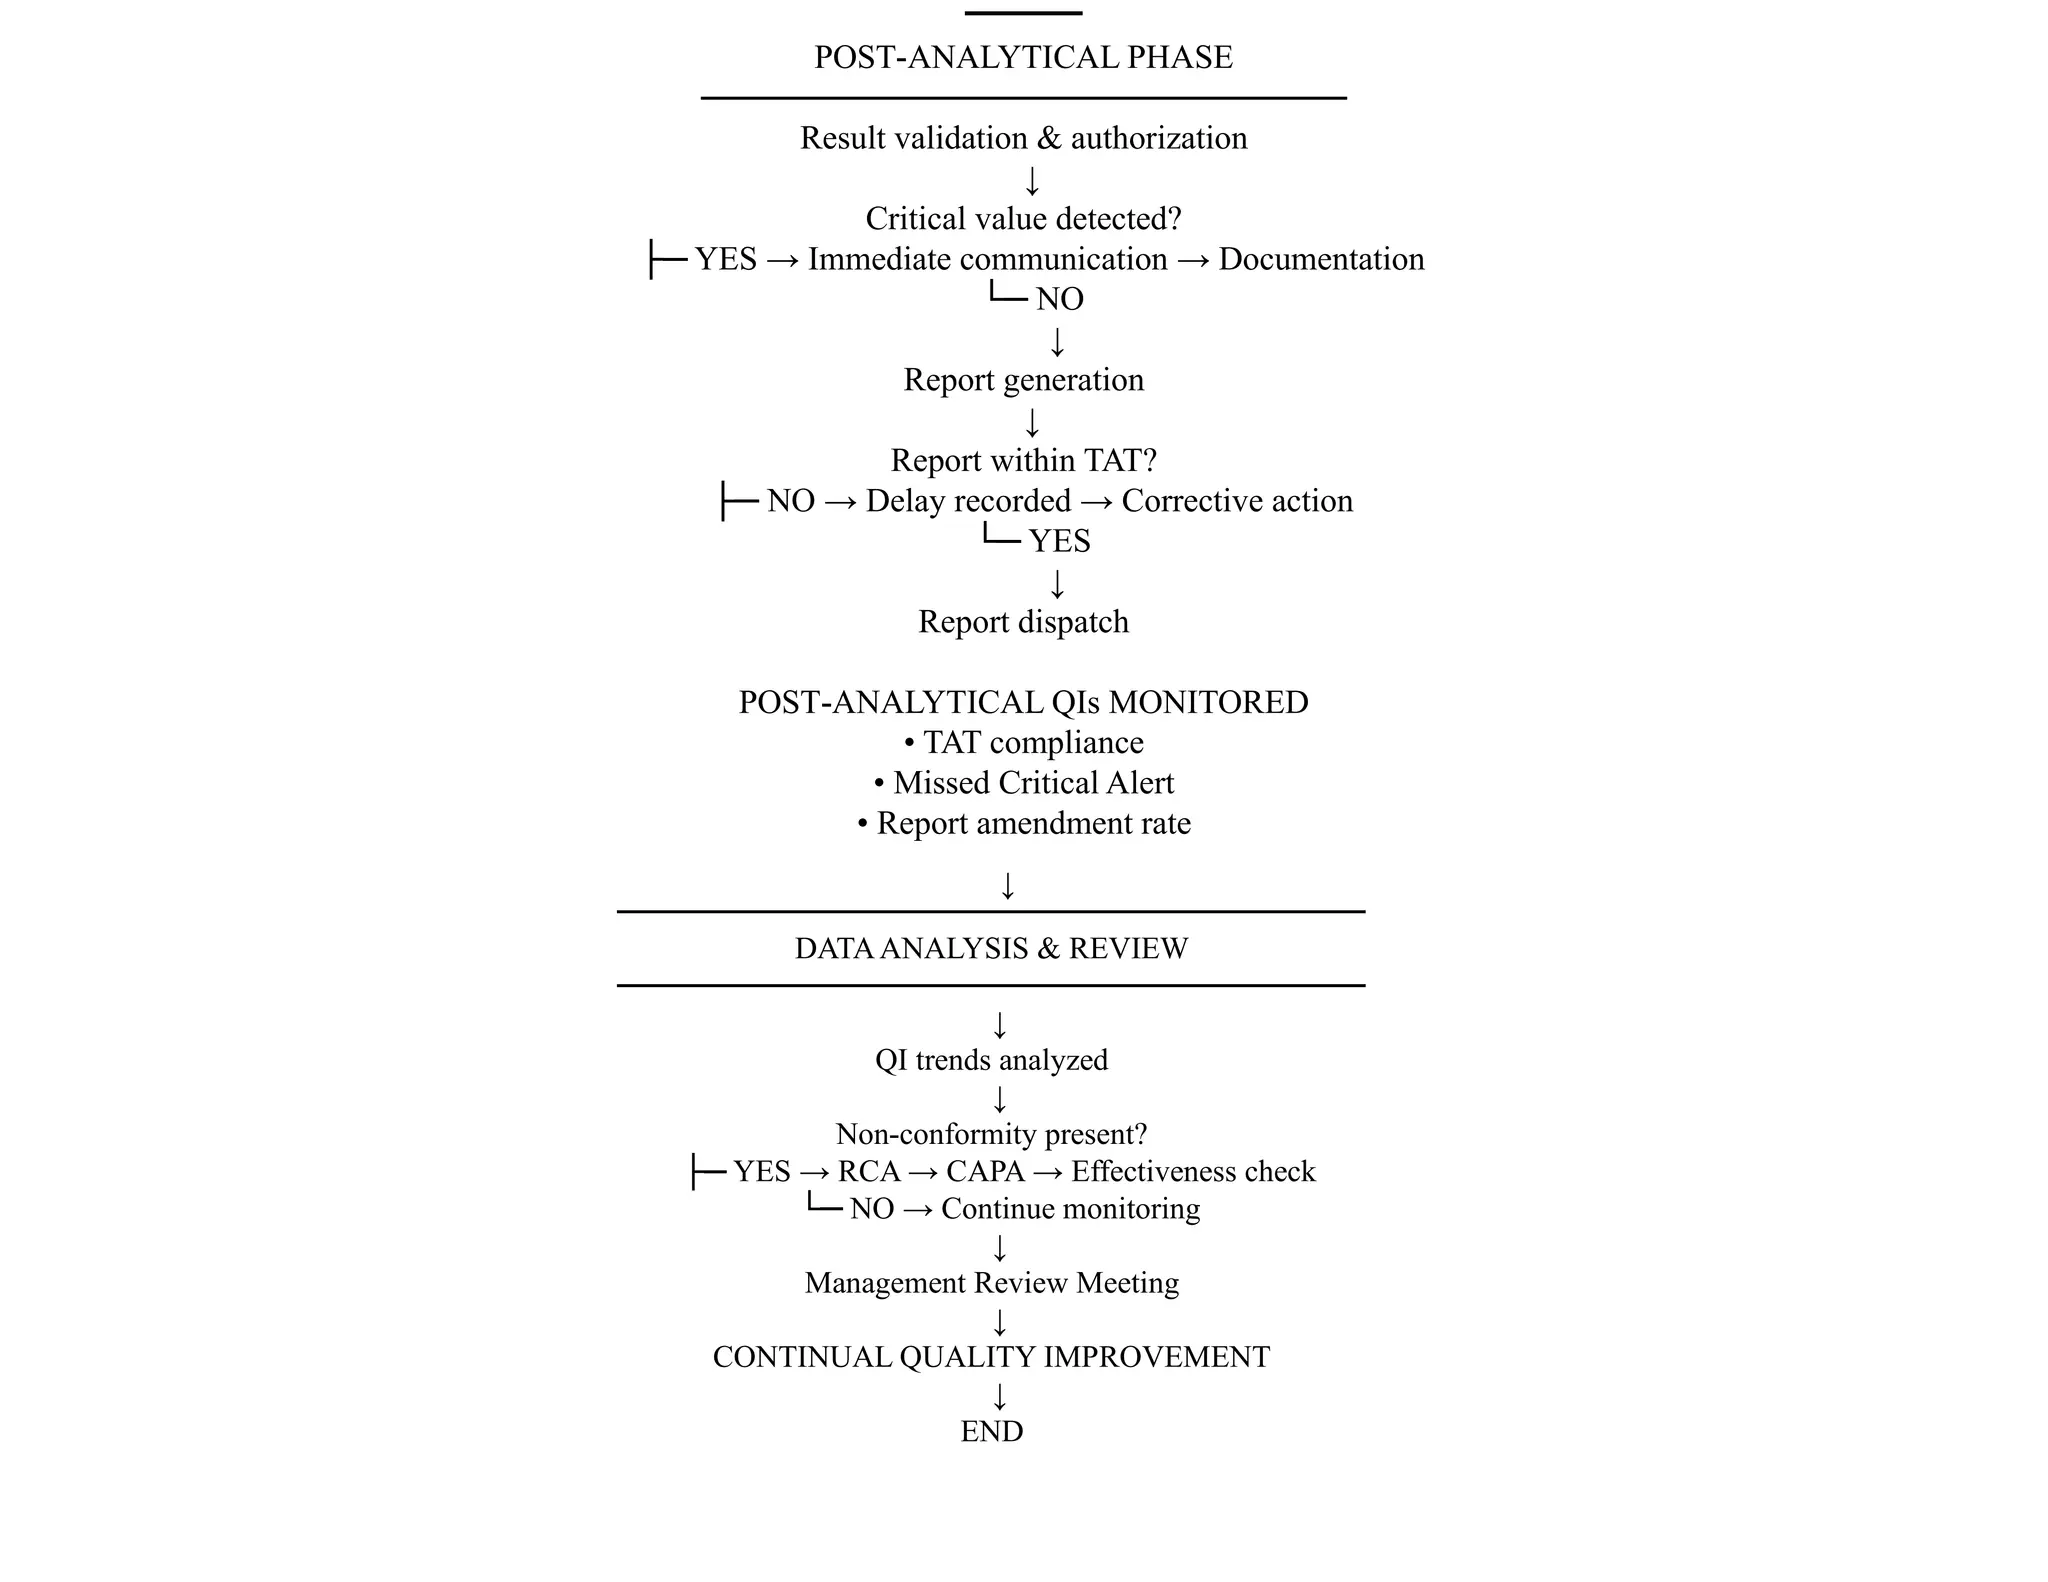
Post-analytical Phase
• 23% of errors
• Result recording
• Timely reporting
• Clinical notification
• Documentation
6.
Quality Assessment??
Also knownas proficiency testing
It is to determine the quality of results generated by
the laboratory
It is a challenge to the QA and QC programs
It can be external or internal
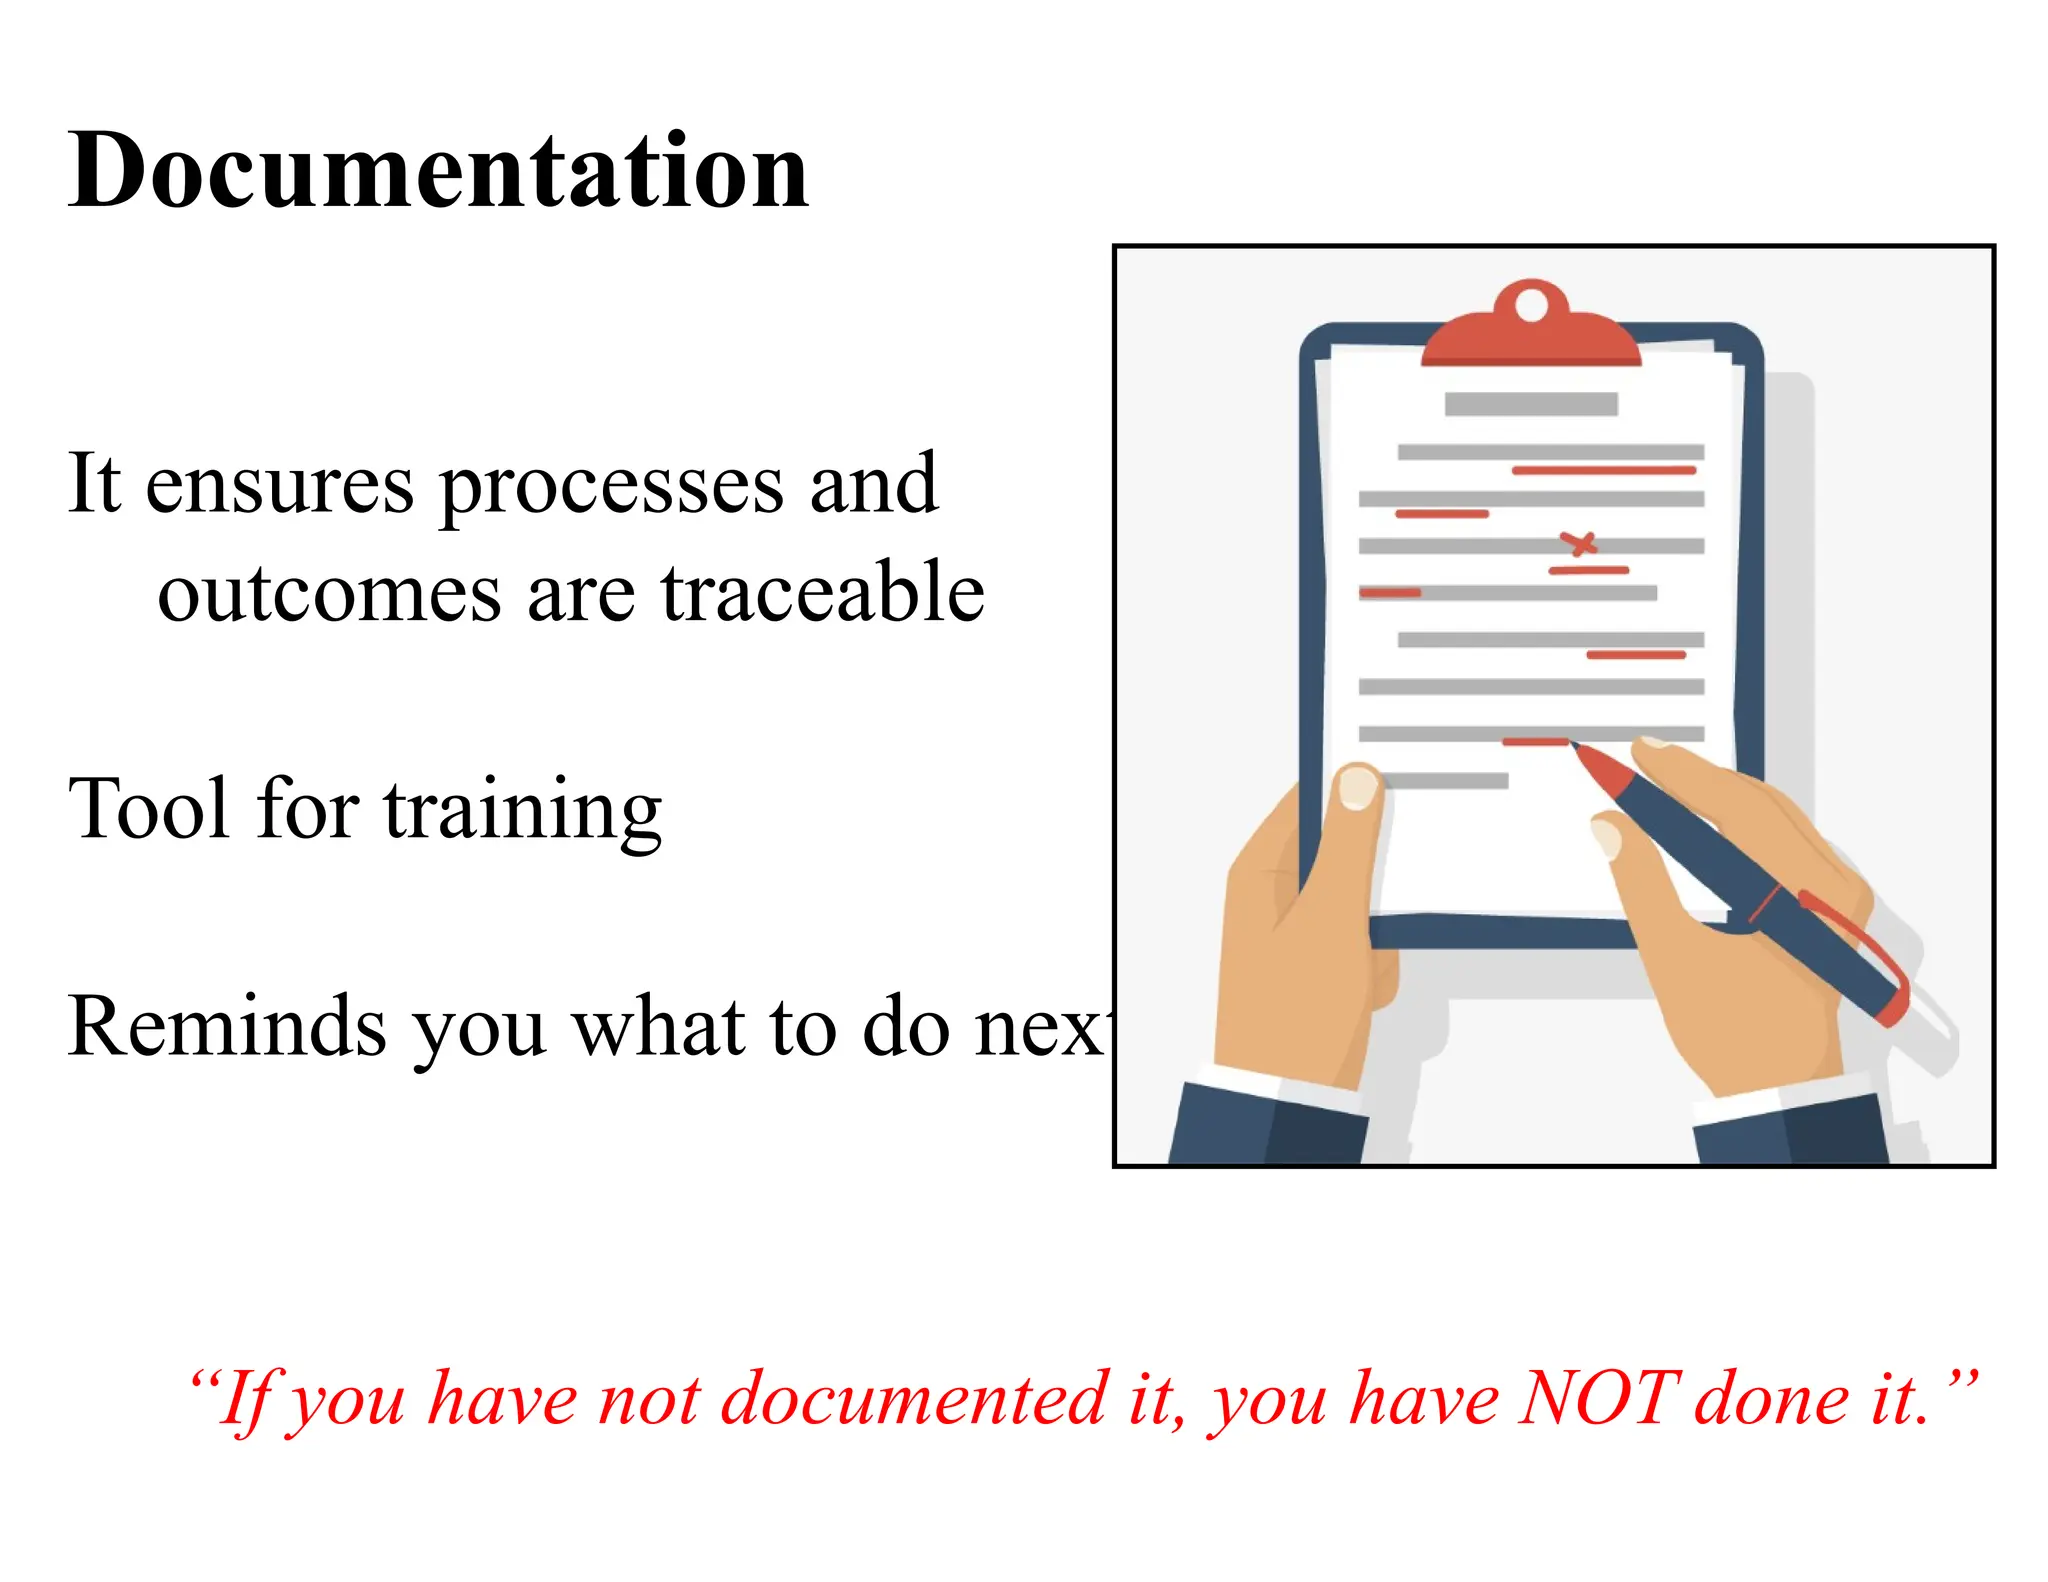
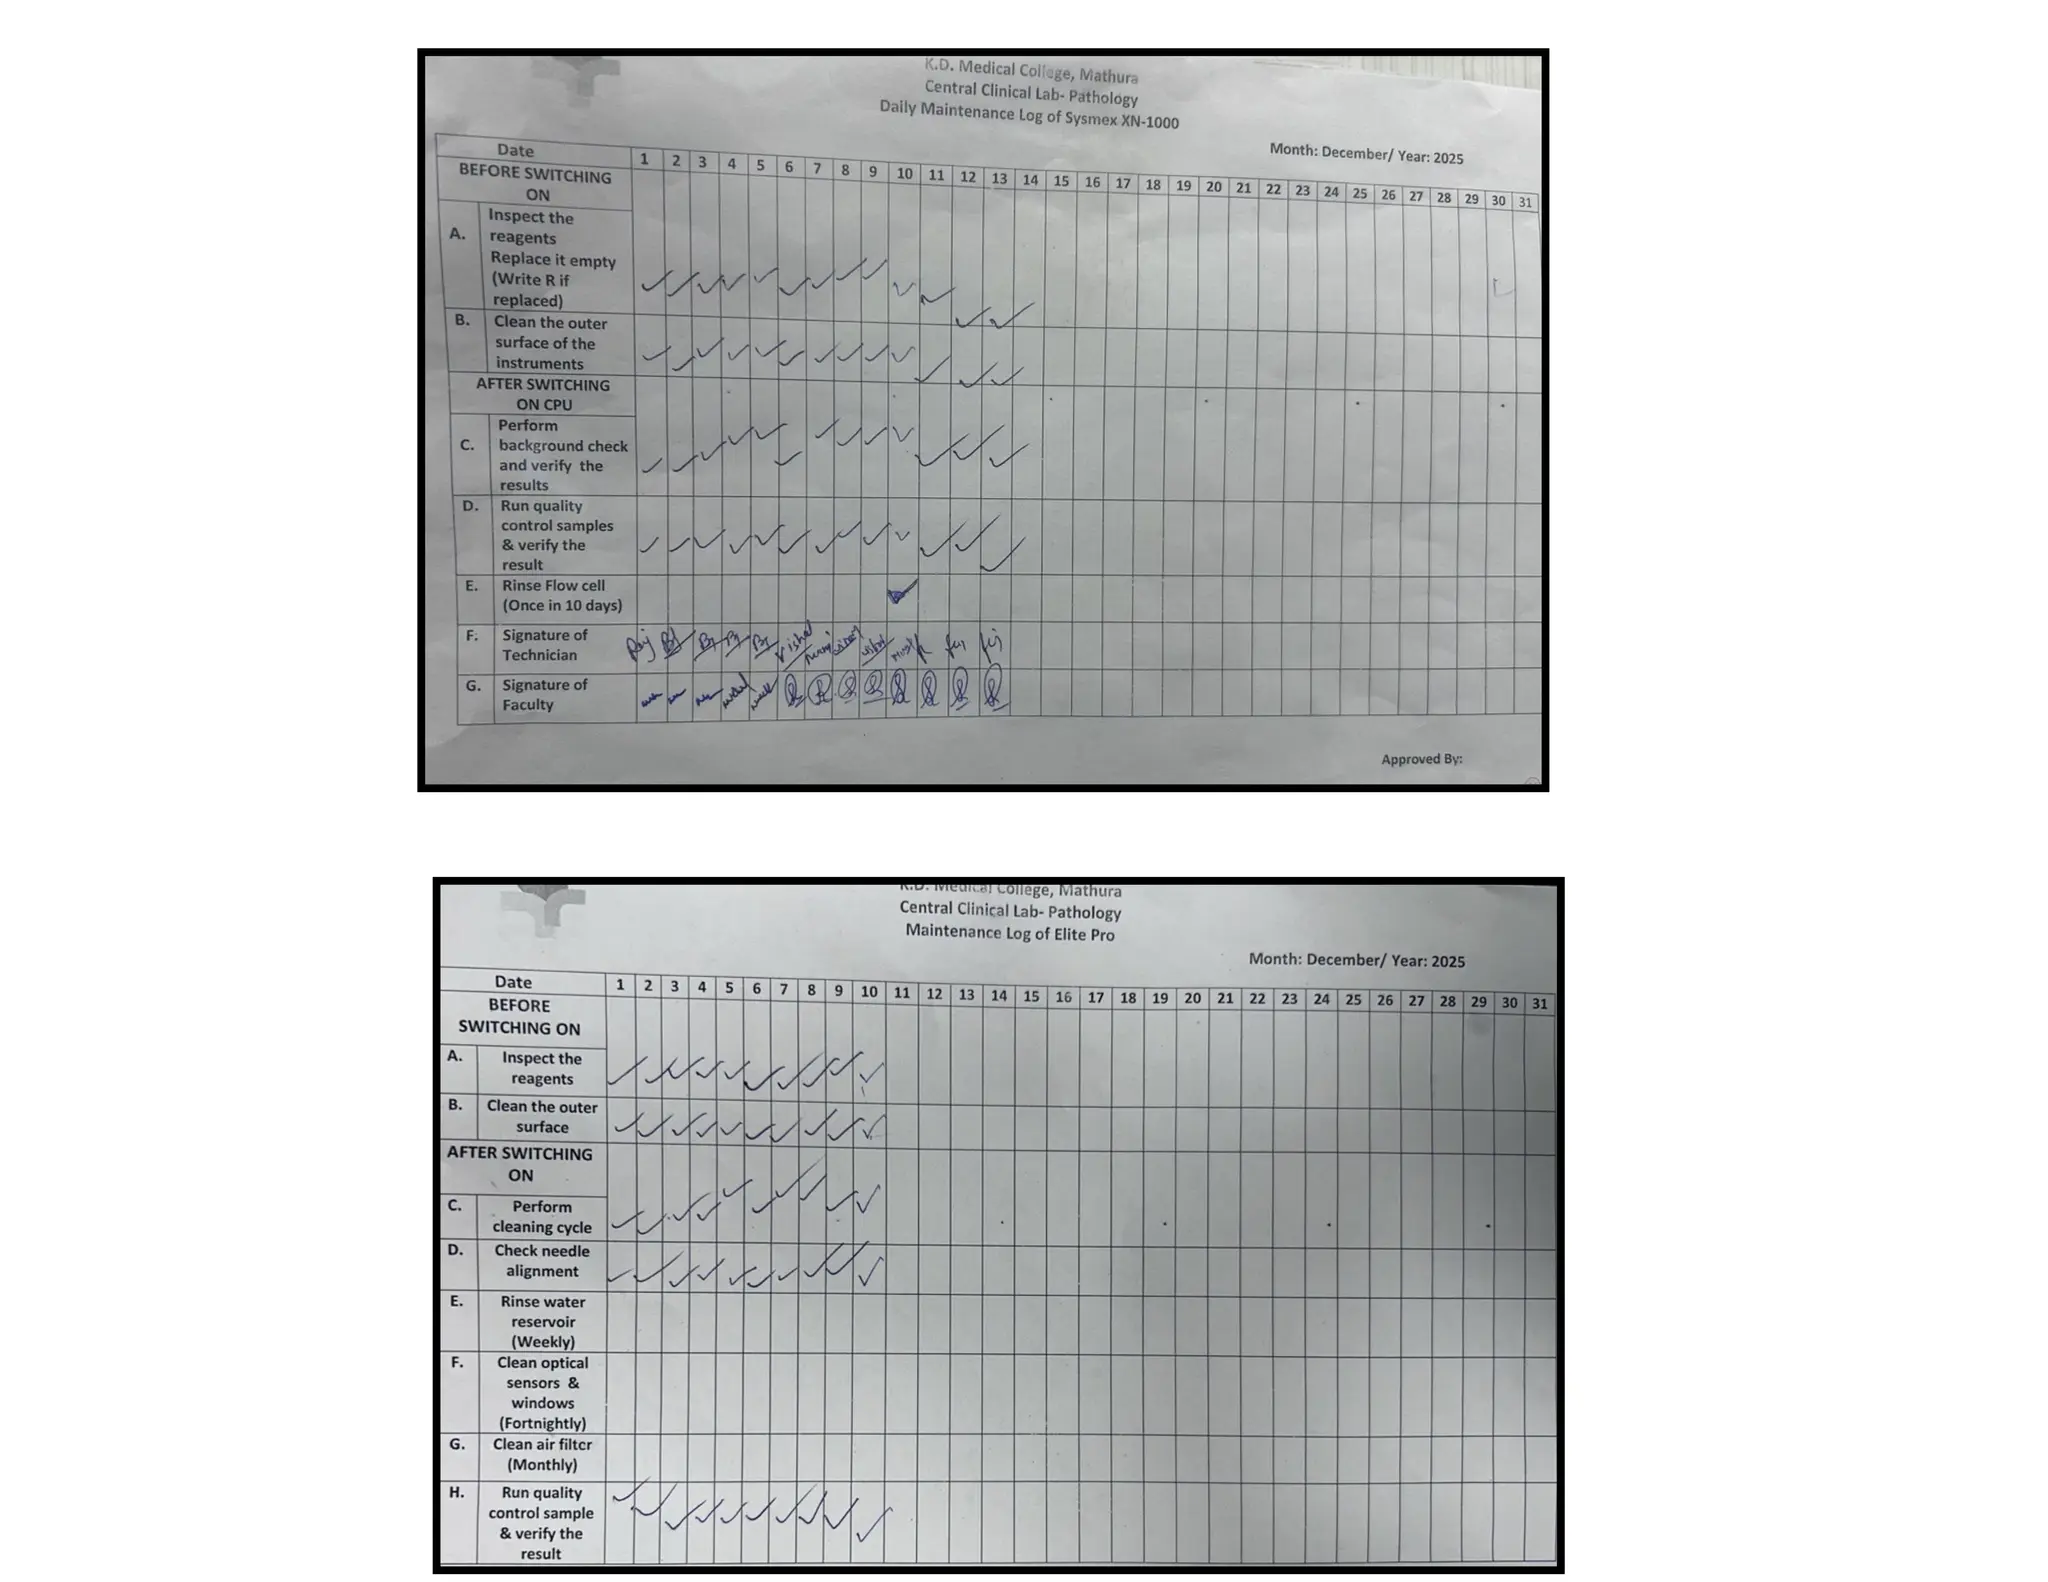
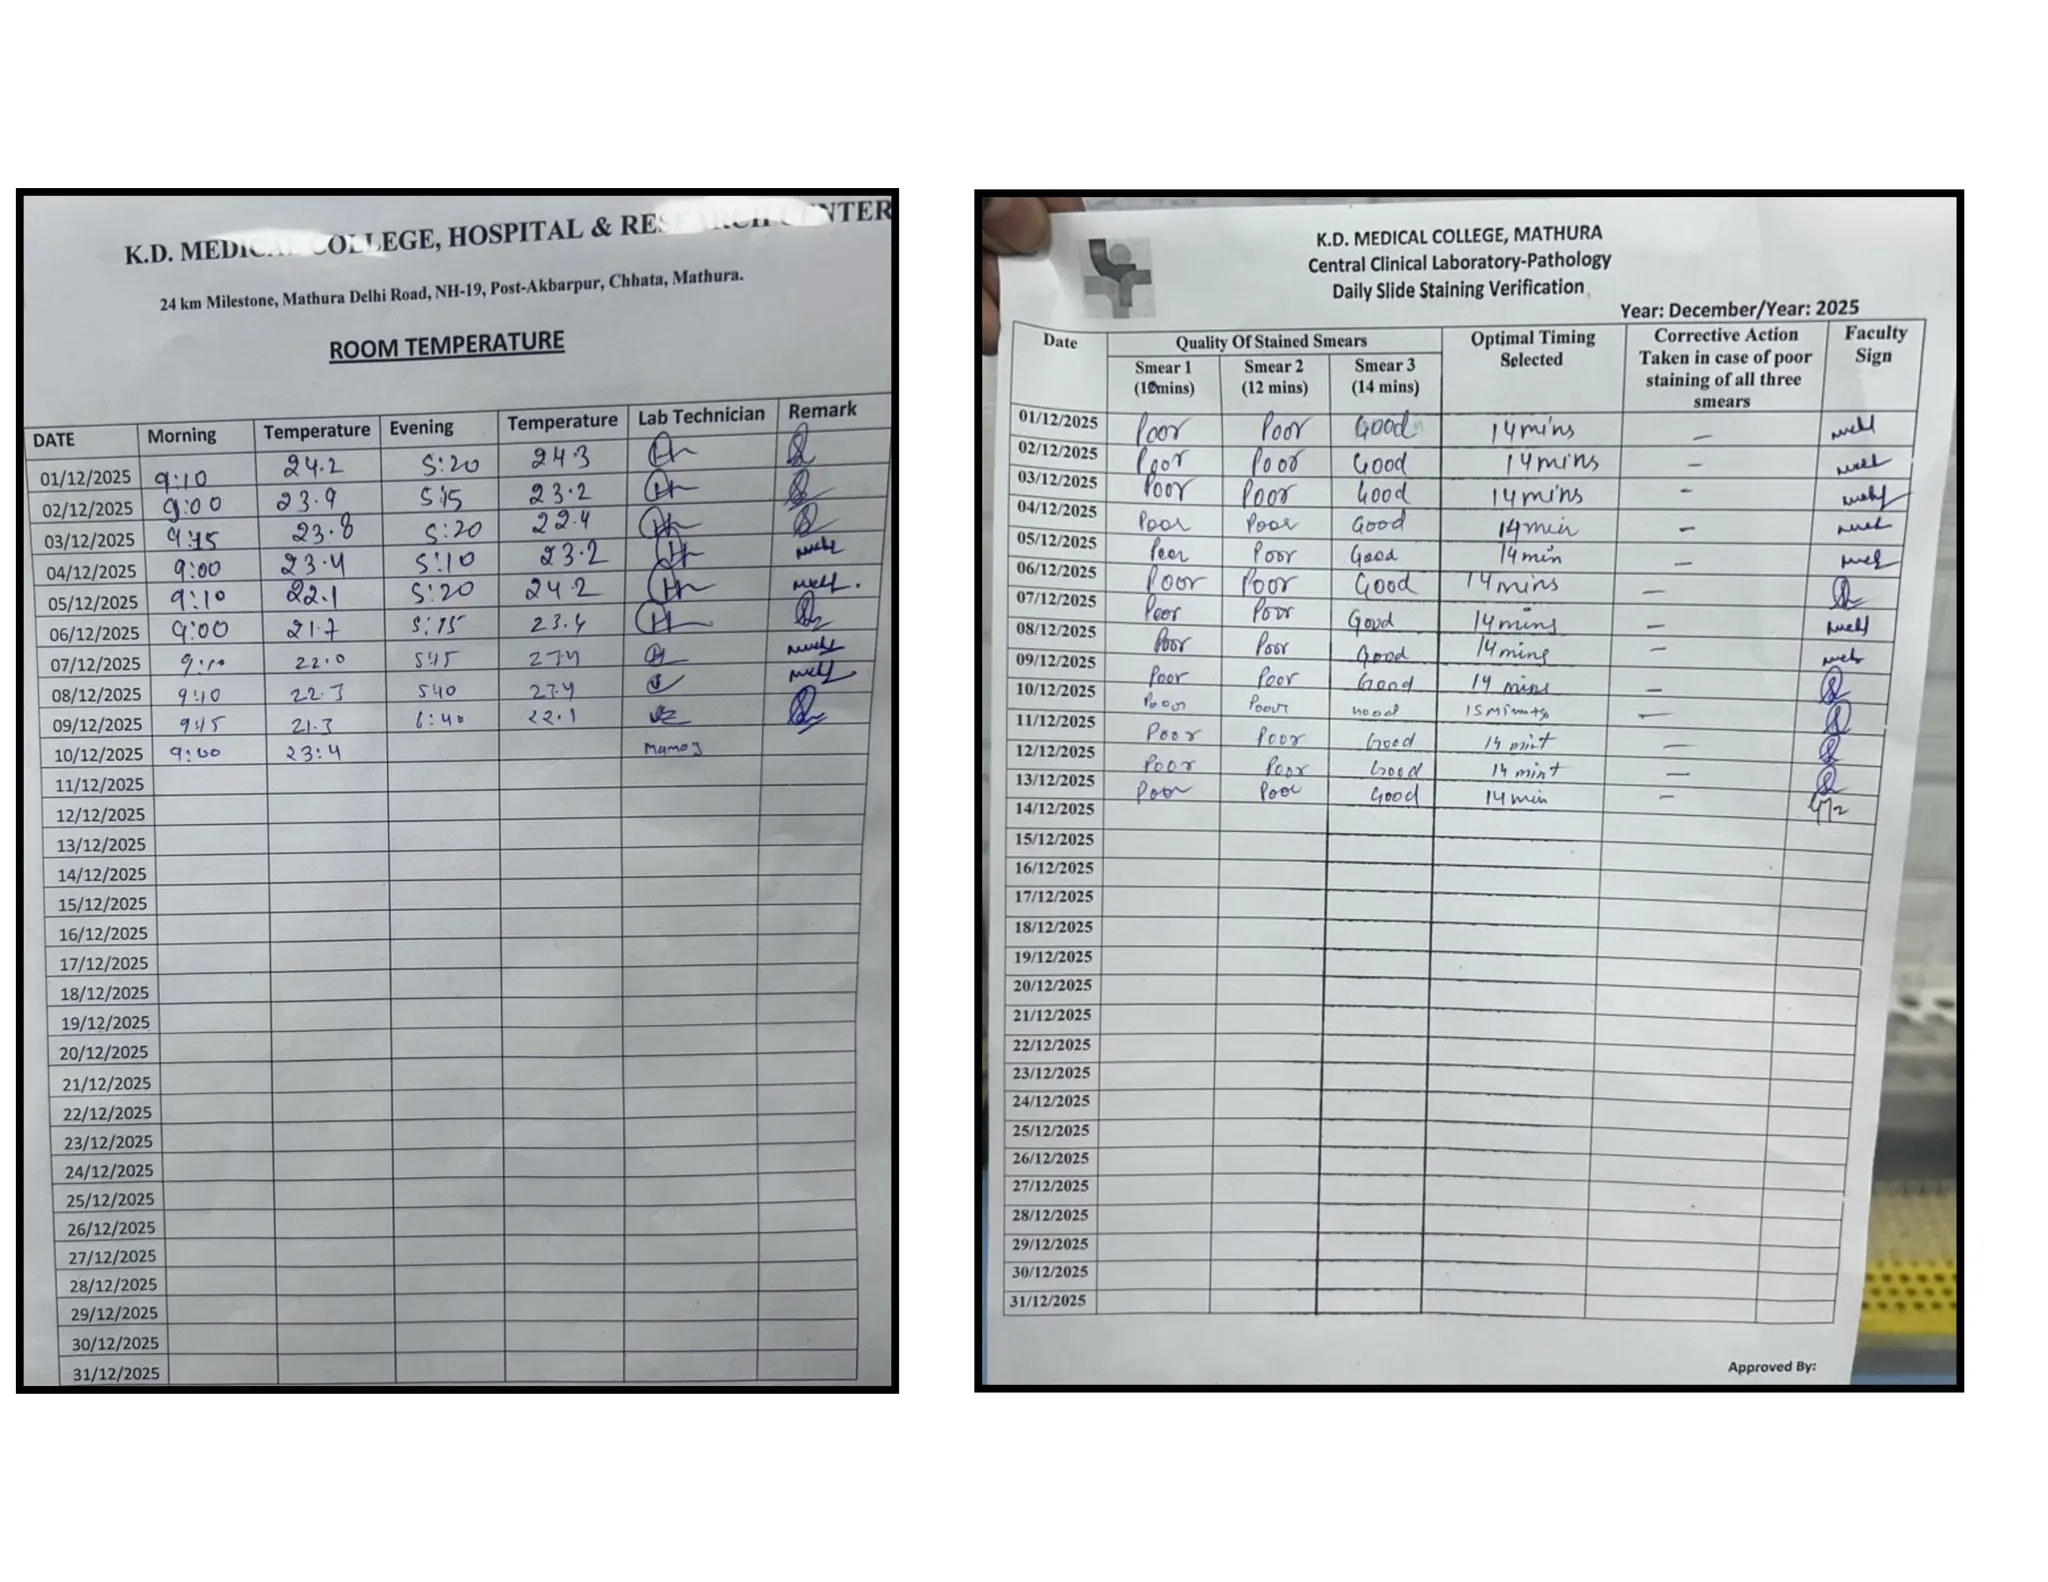
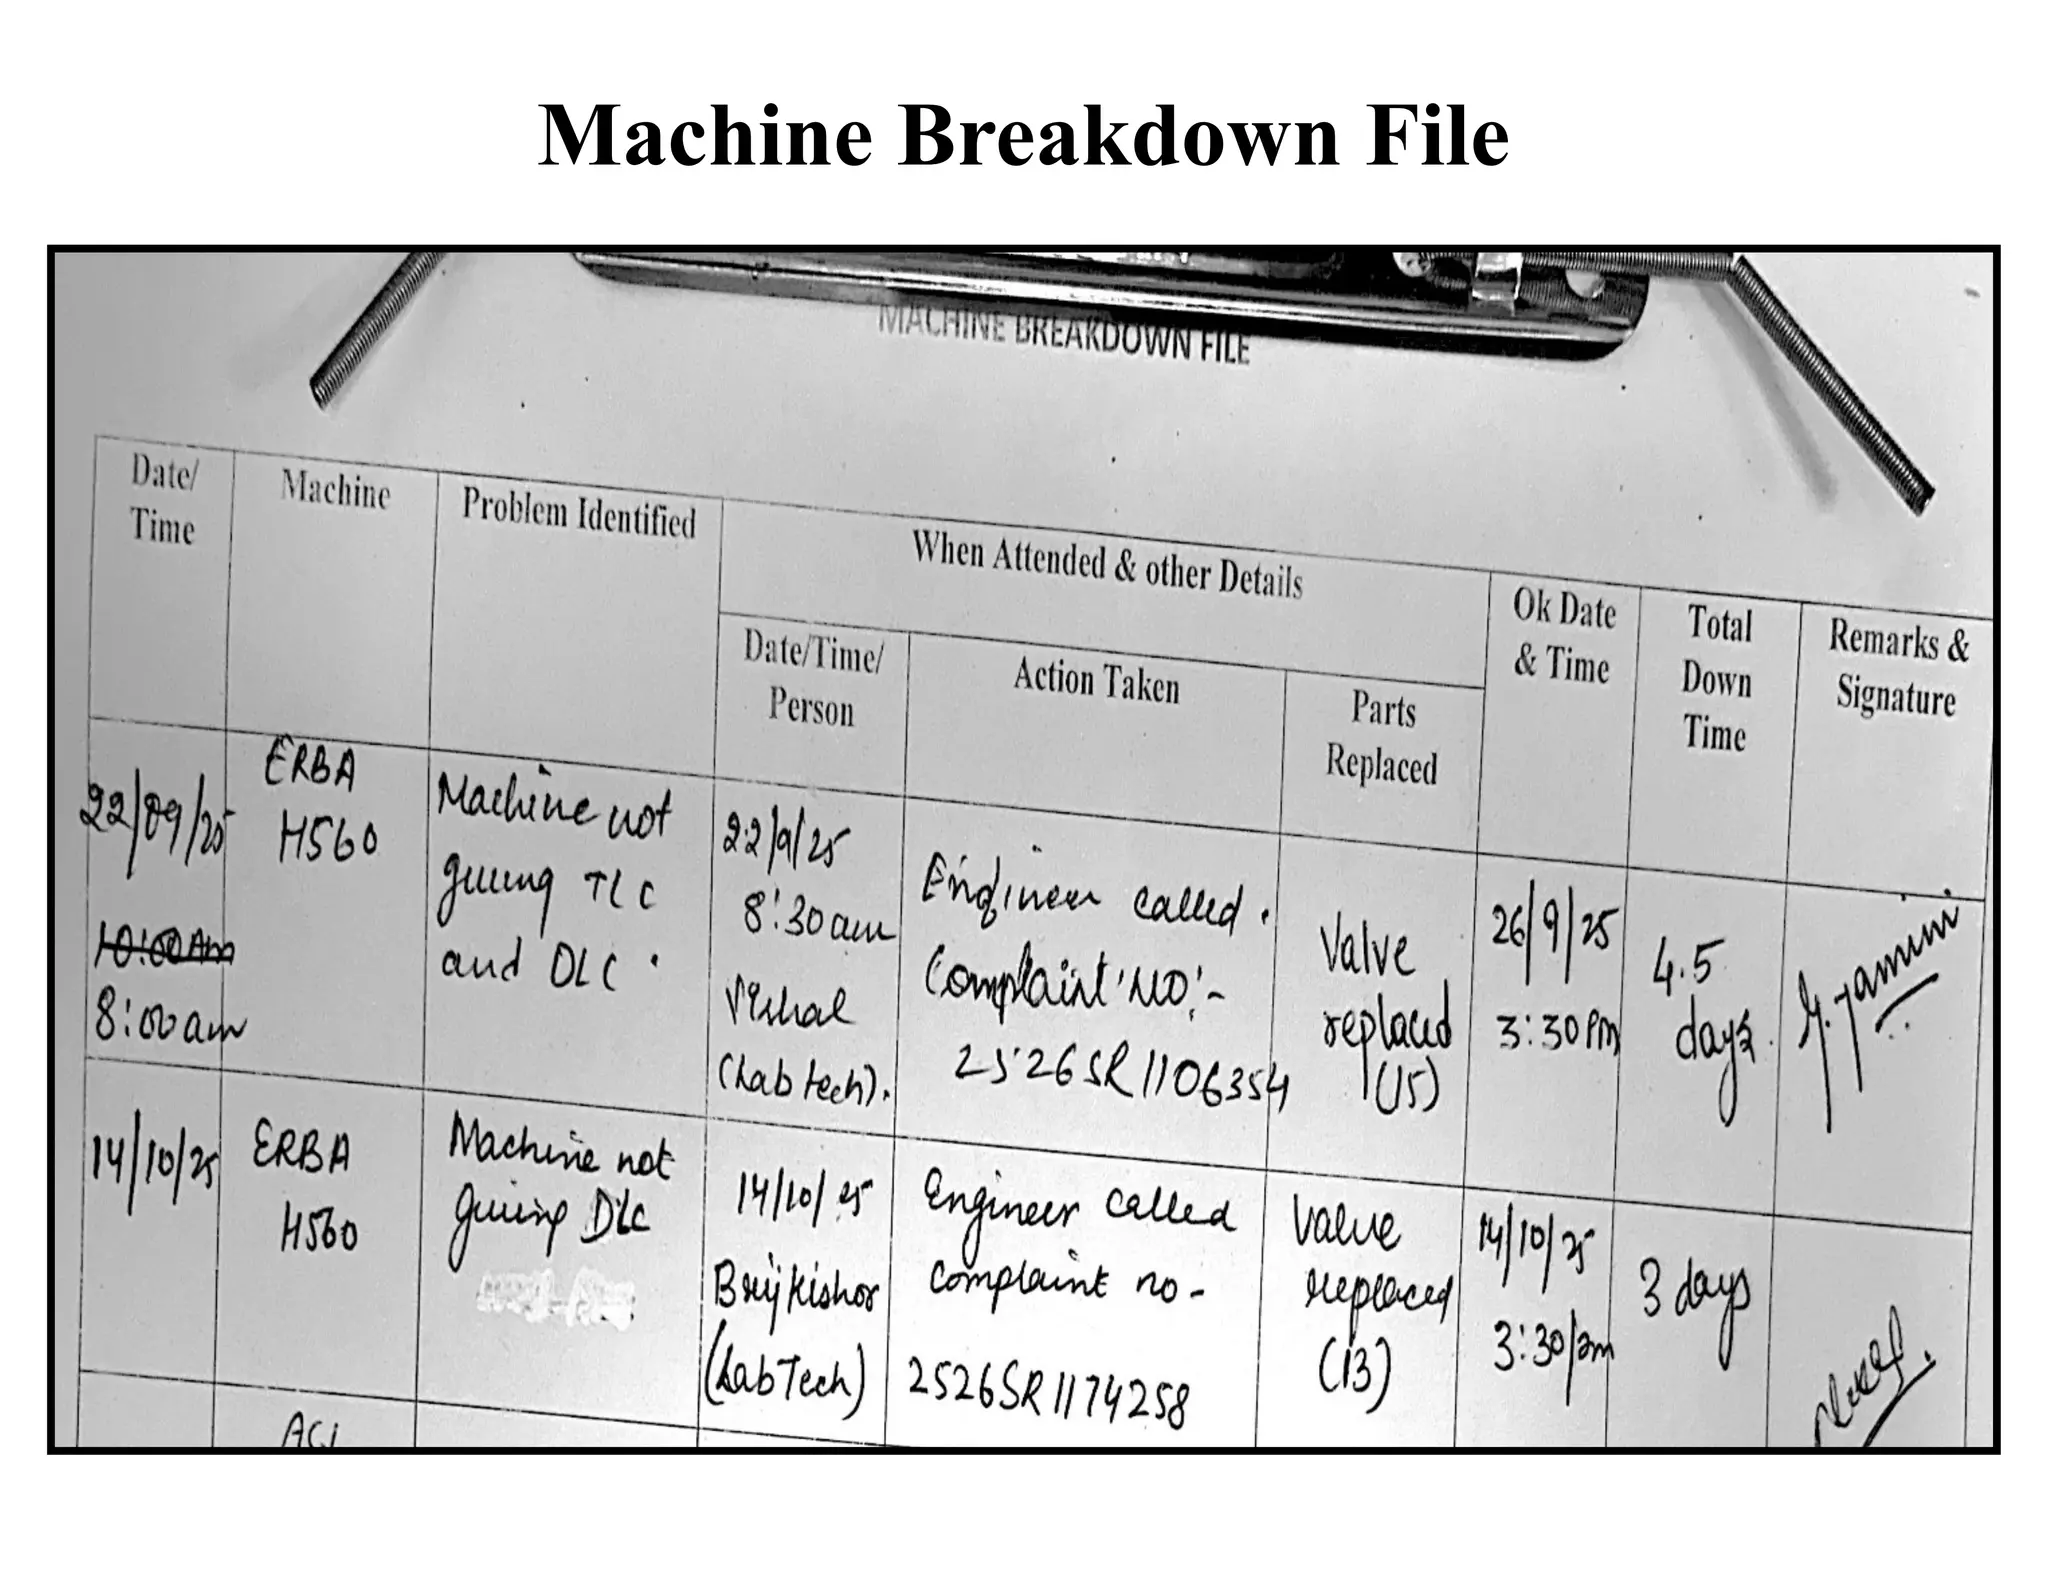
Documentation
It ensures processesand
outcomes are traceable
Tool for training
Reminds you what to do next
“If you have not documented it, you have NOT done it.”
9.
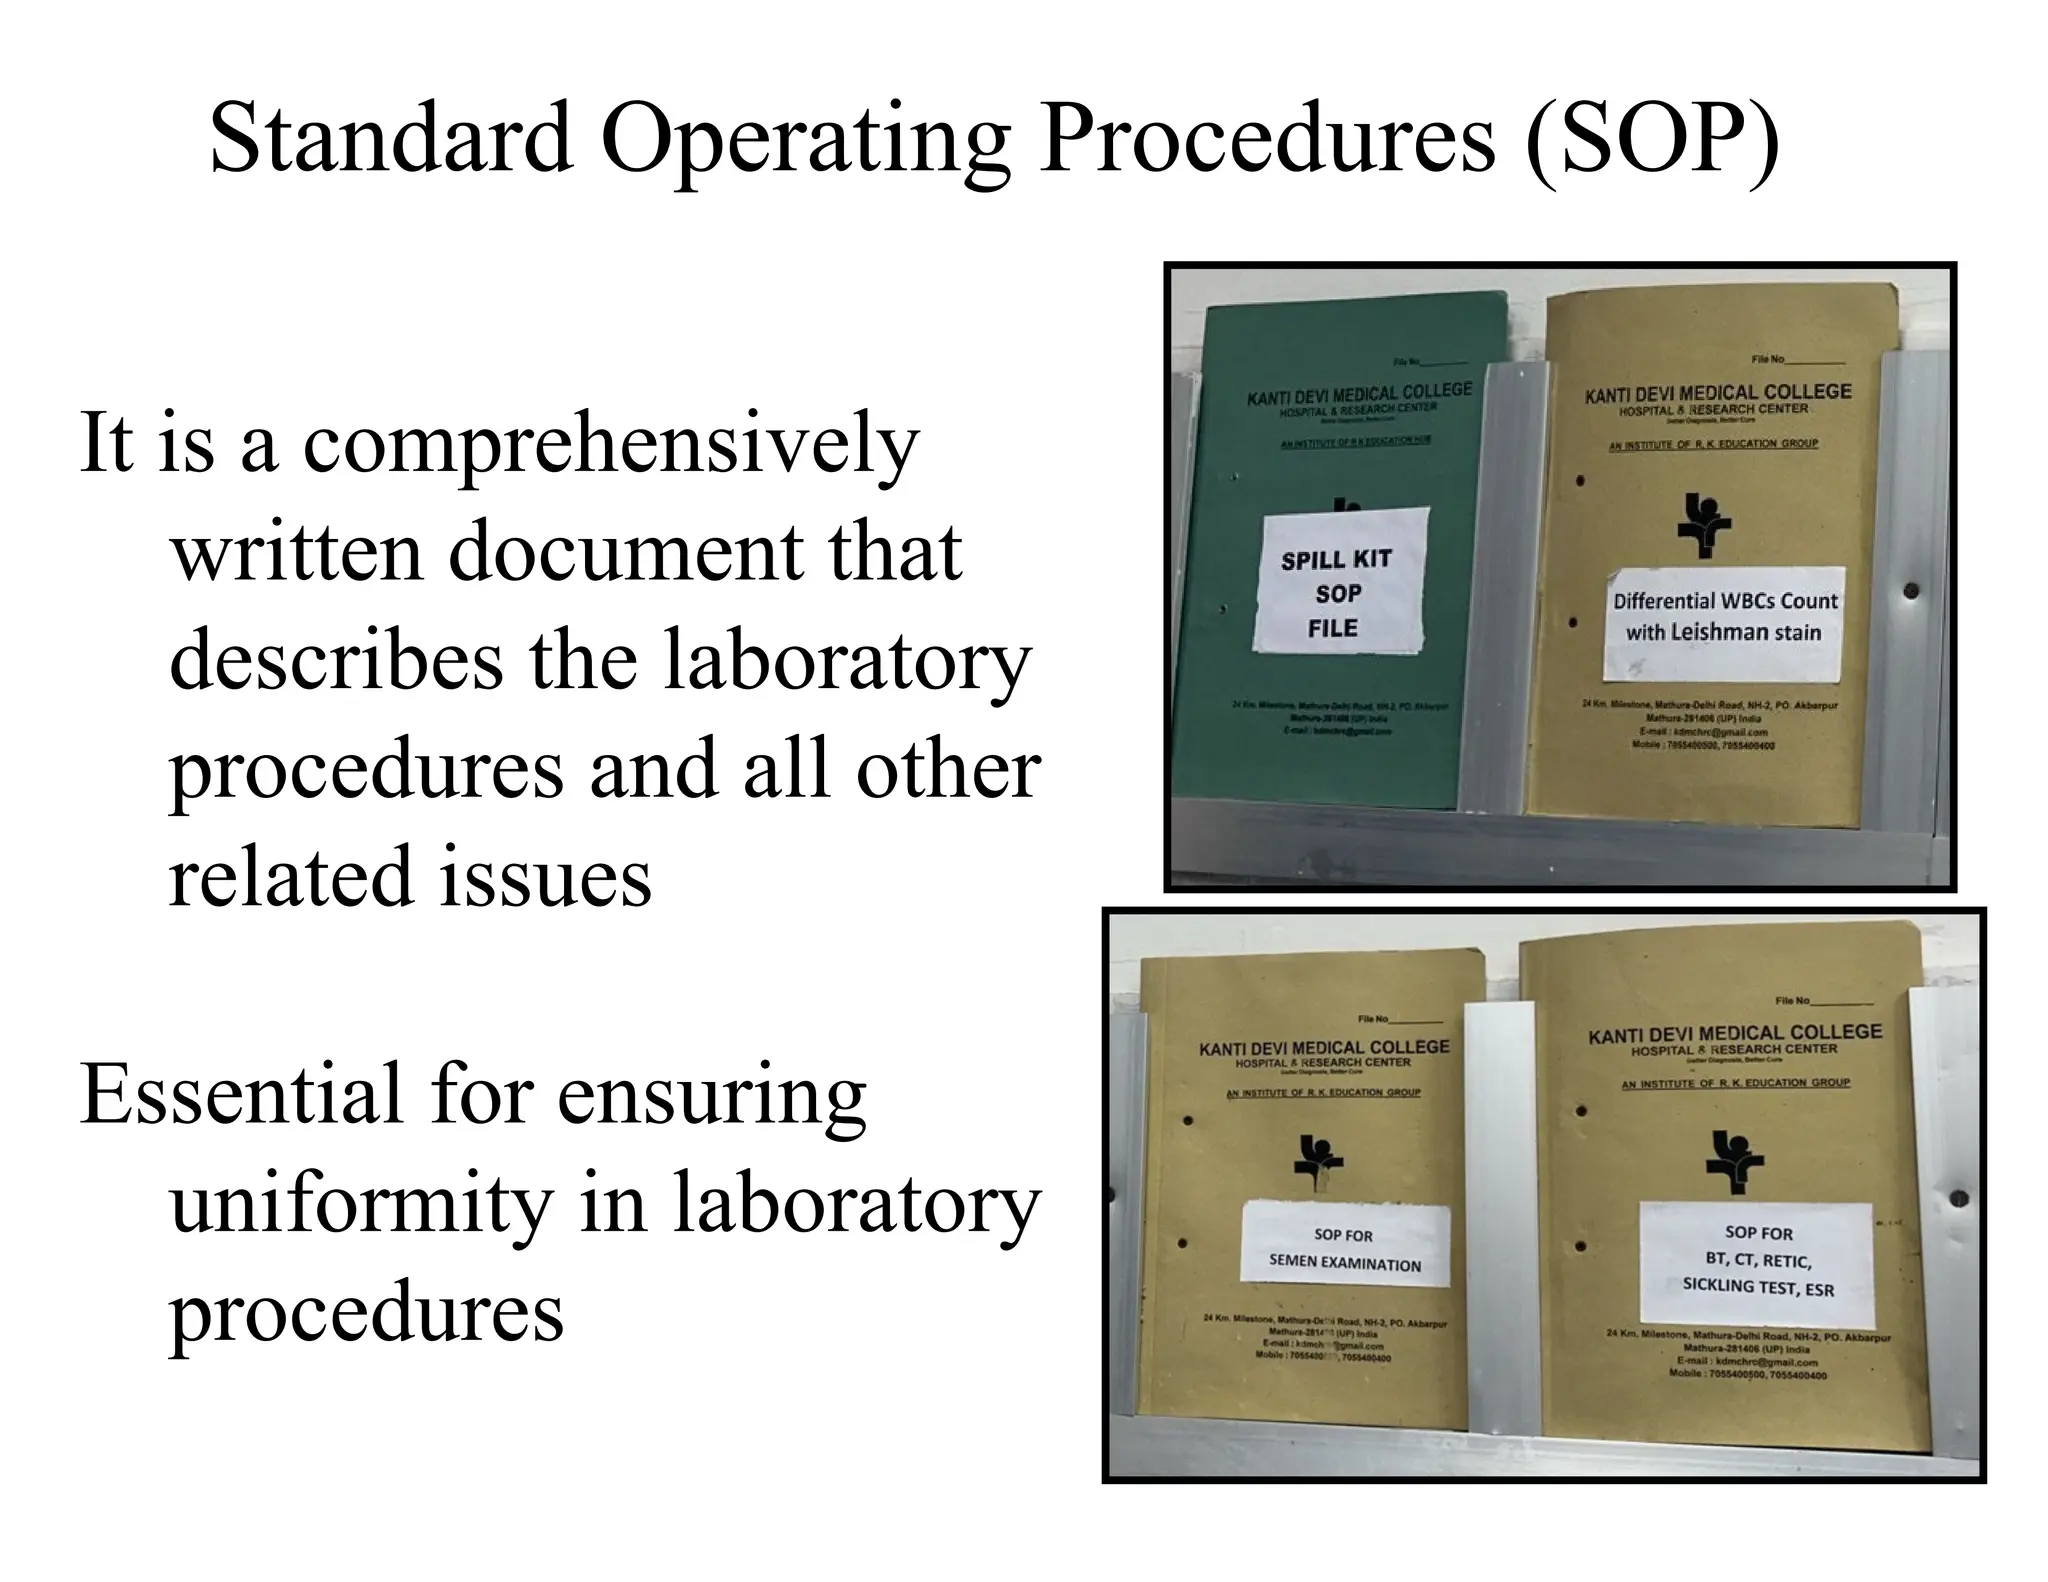
It is acomprehensively
written document that
describes the laboratory
procedures and all other
related issues
Essential for ensuring
uniformity in laboratory
procedures
Standard Operating Procedures (SOP)
10.
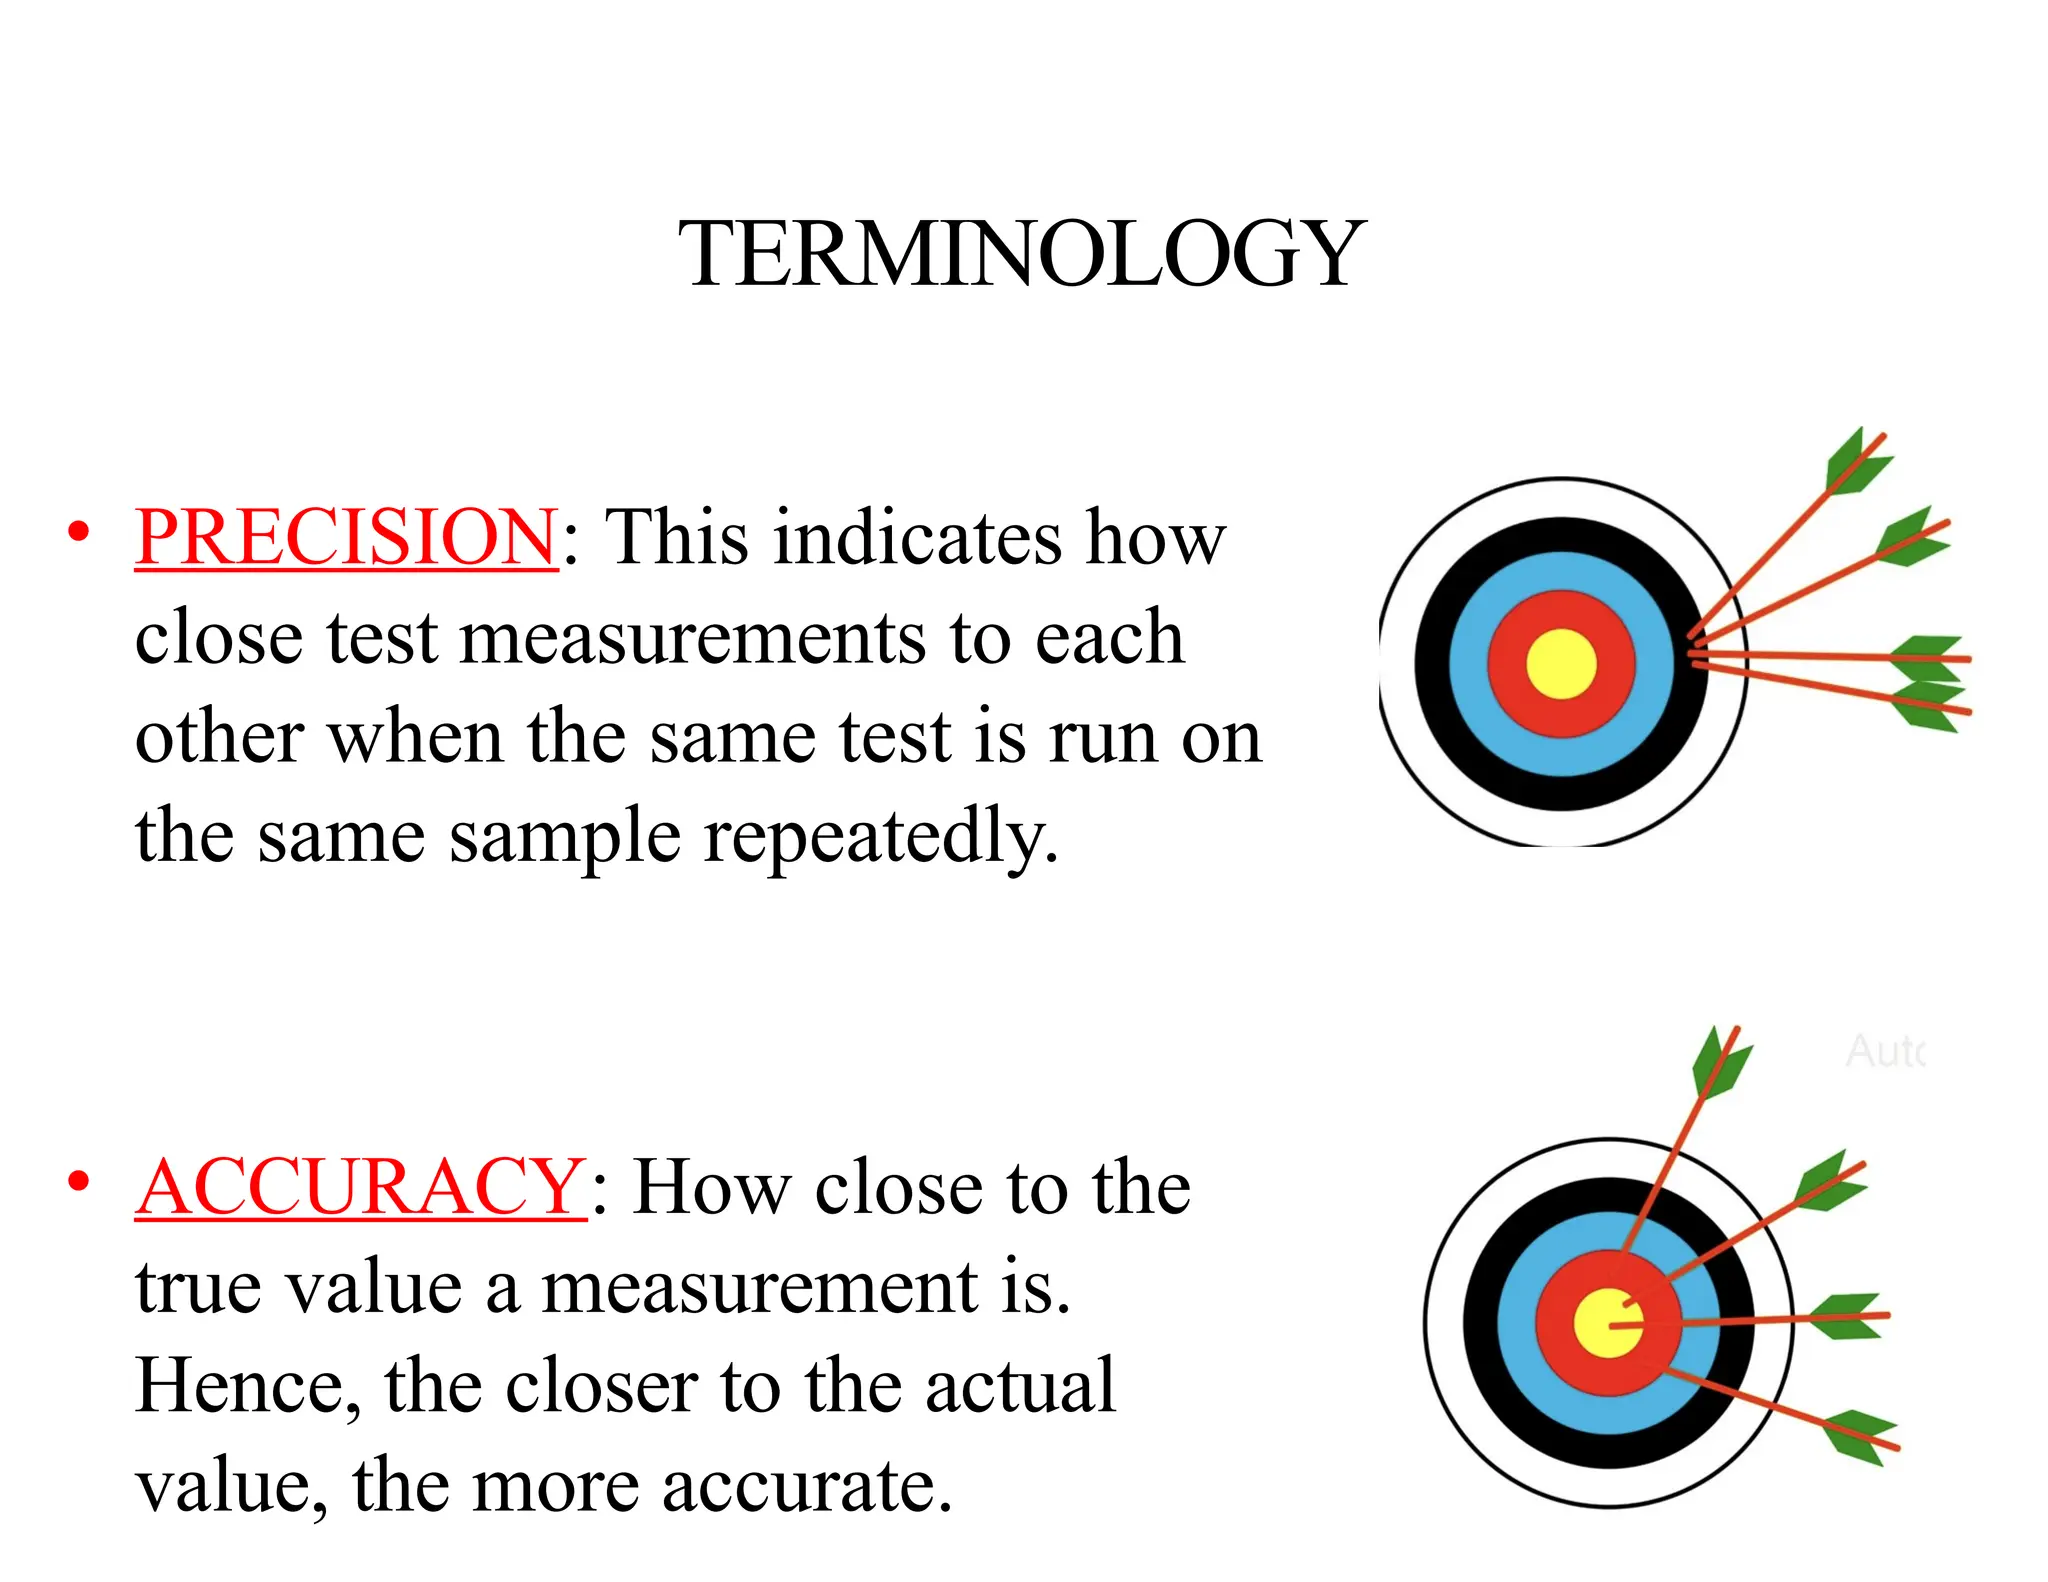
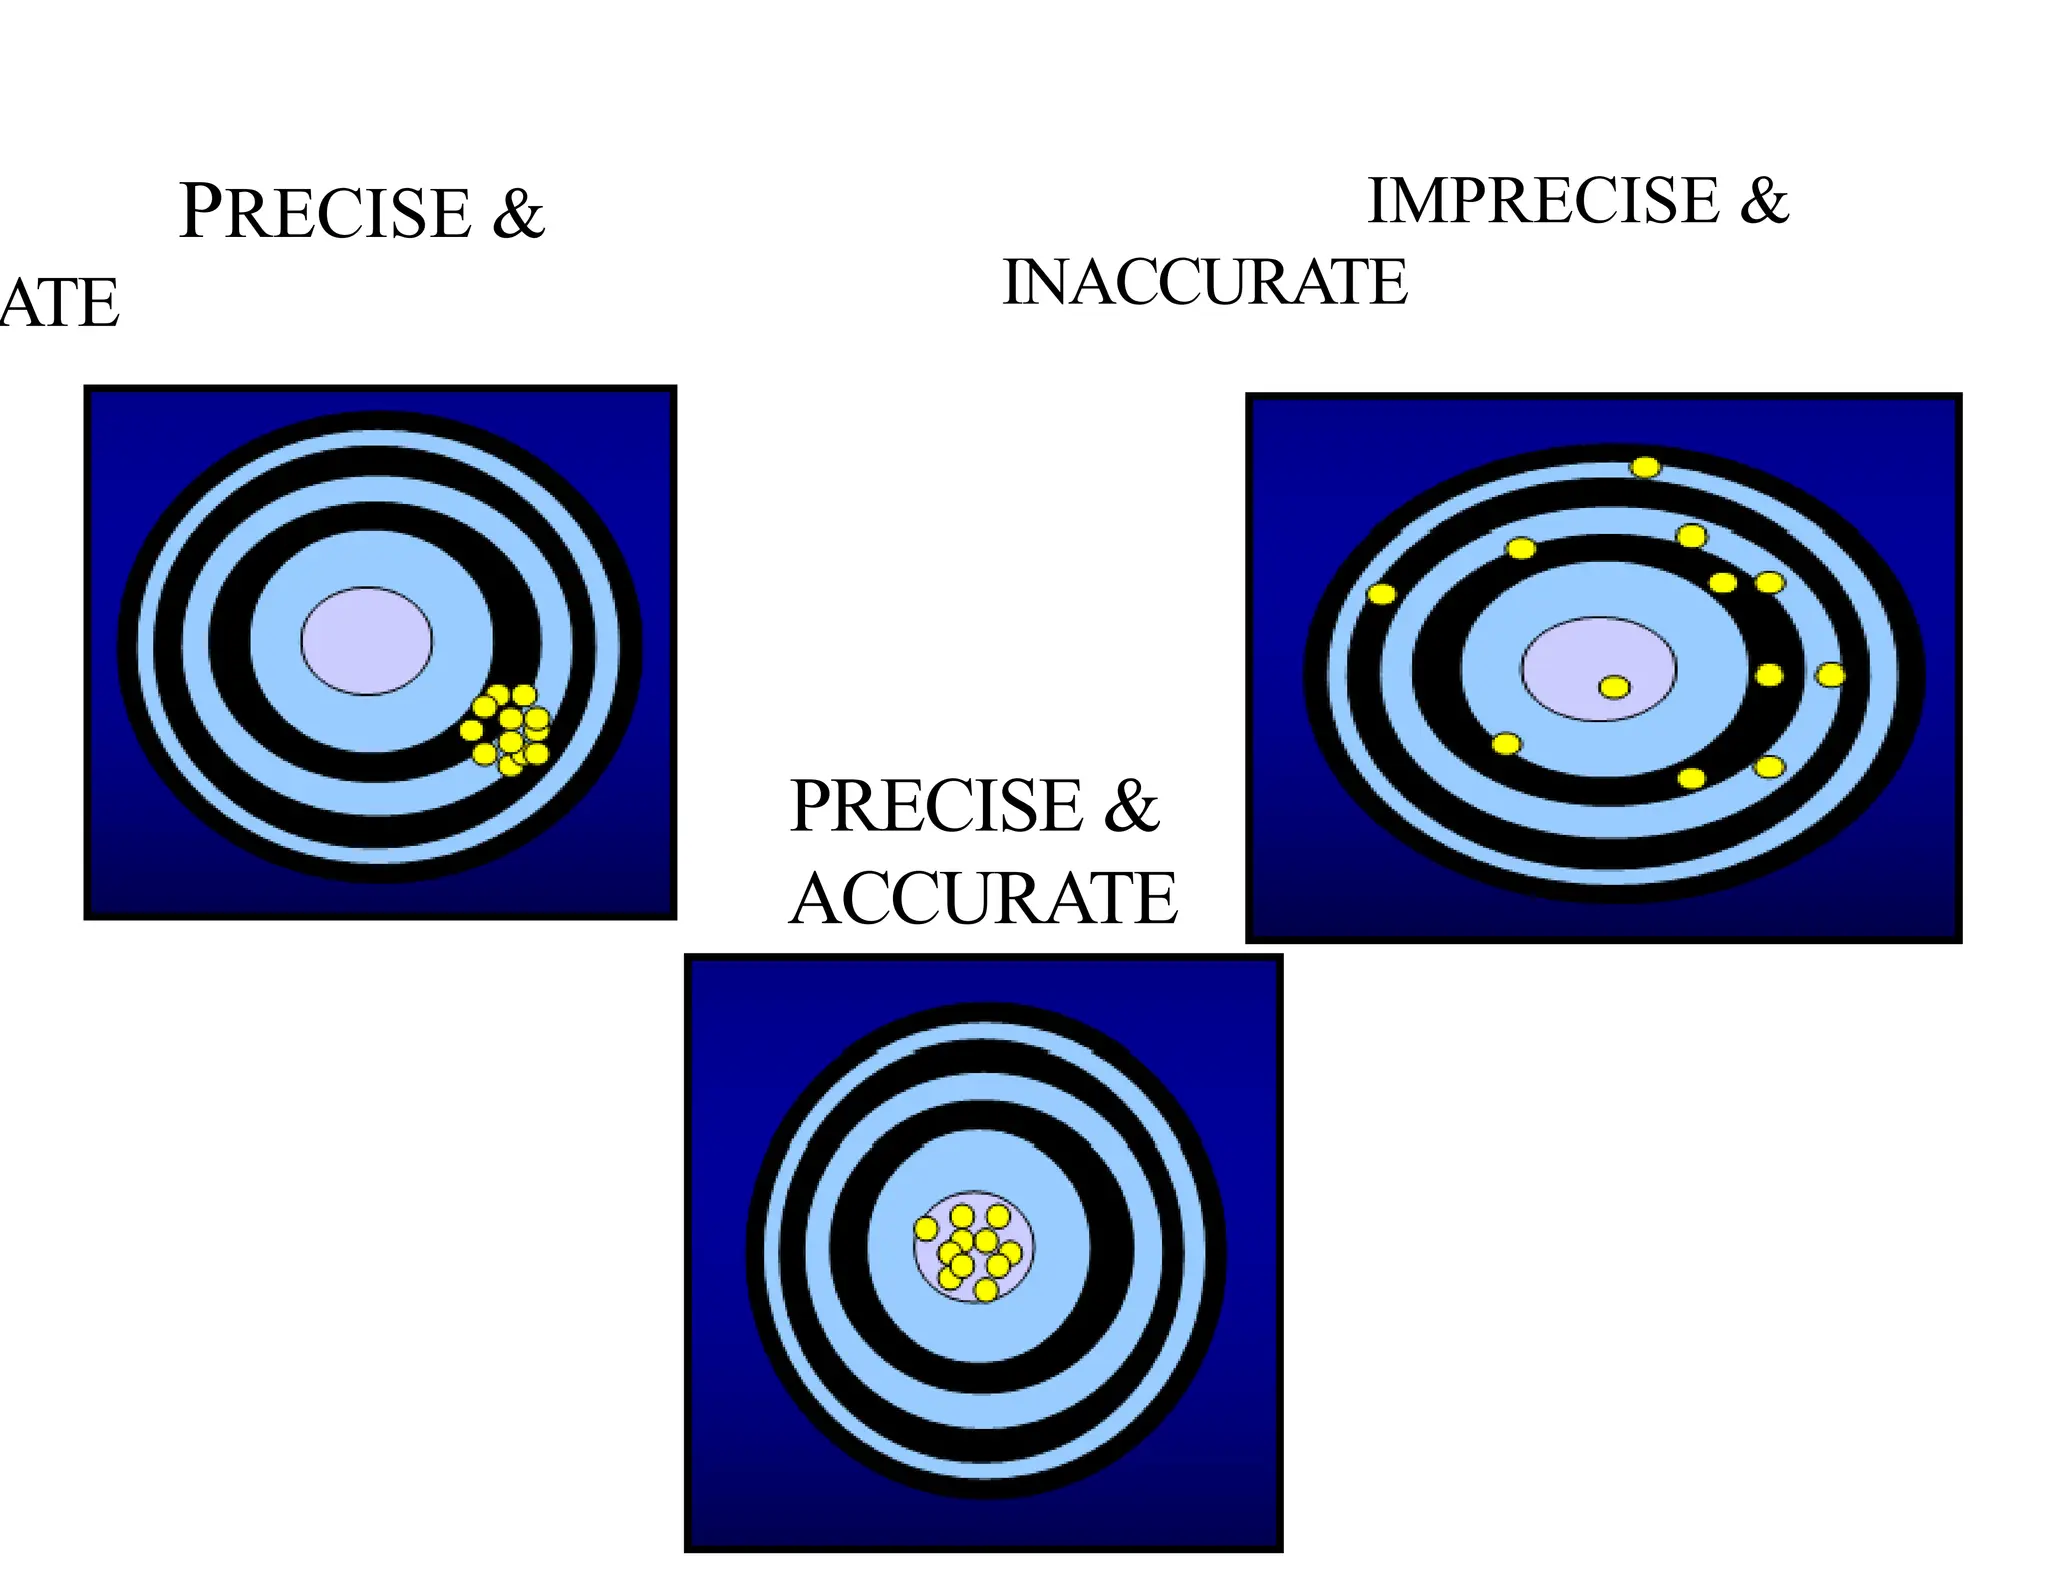
TERMINOLOGY
• PRECISION: Thisindicates how
close test measurements to each
other when the same test is run on
the same sample repeatedly.
• ACCURACY: How close to the
true value a measurement is.
Hence, the closer to the actual
value, the more accurate.
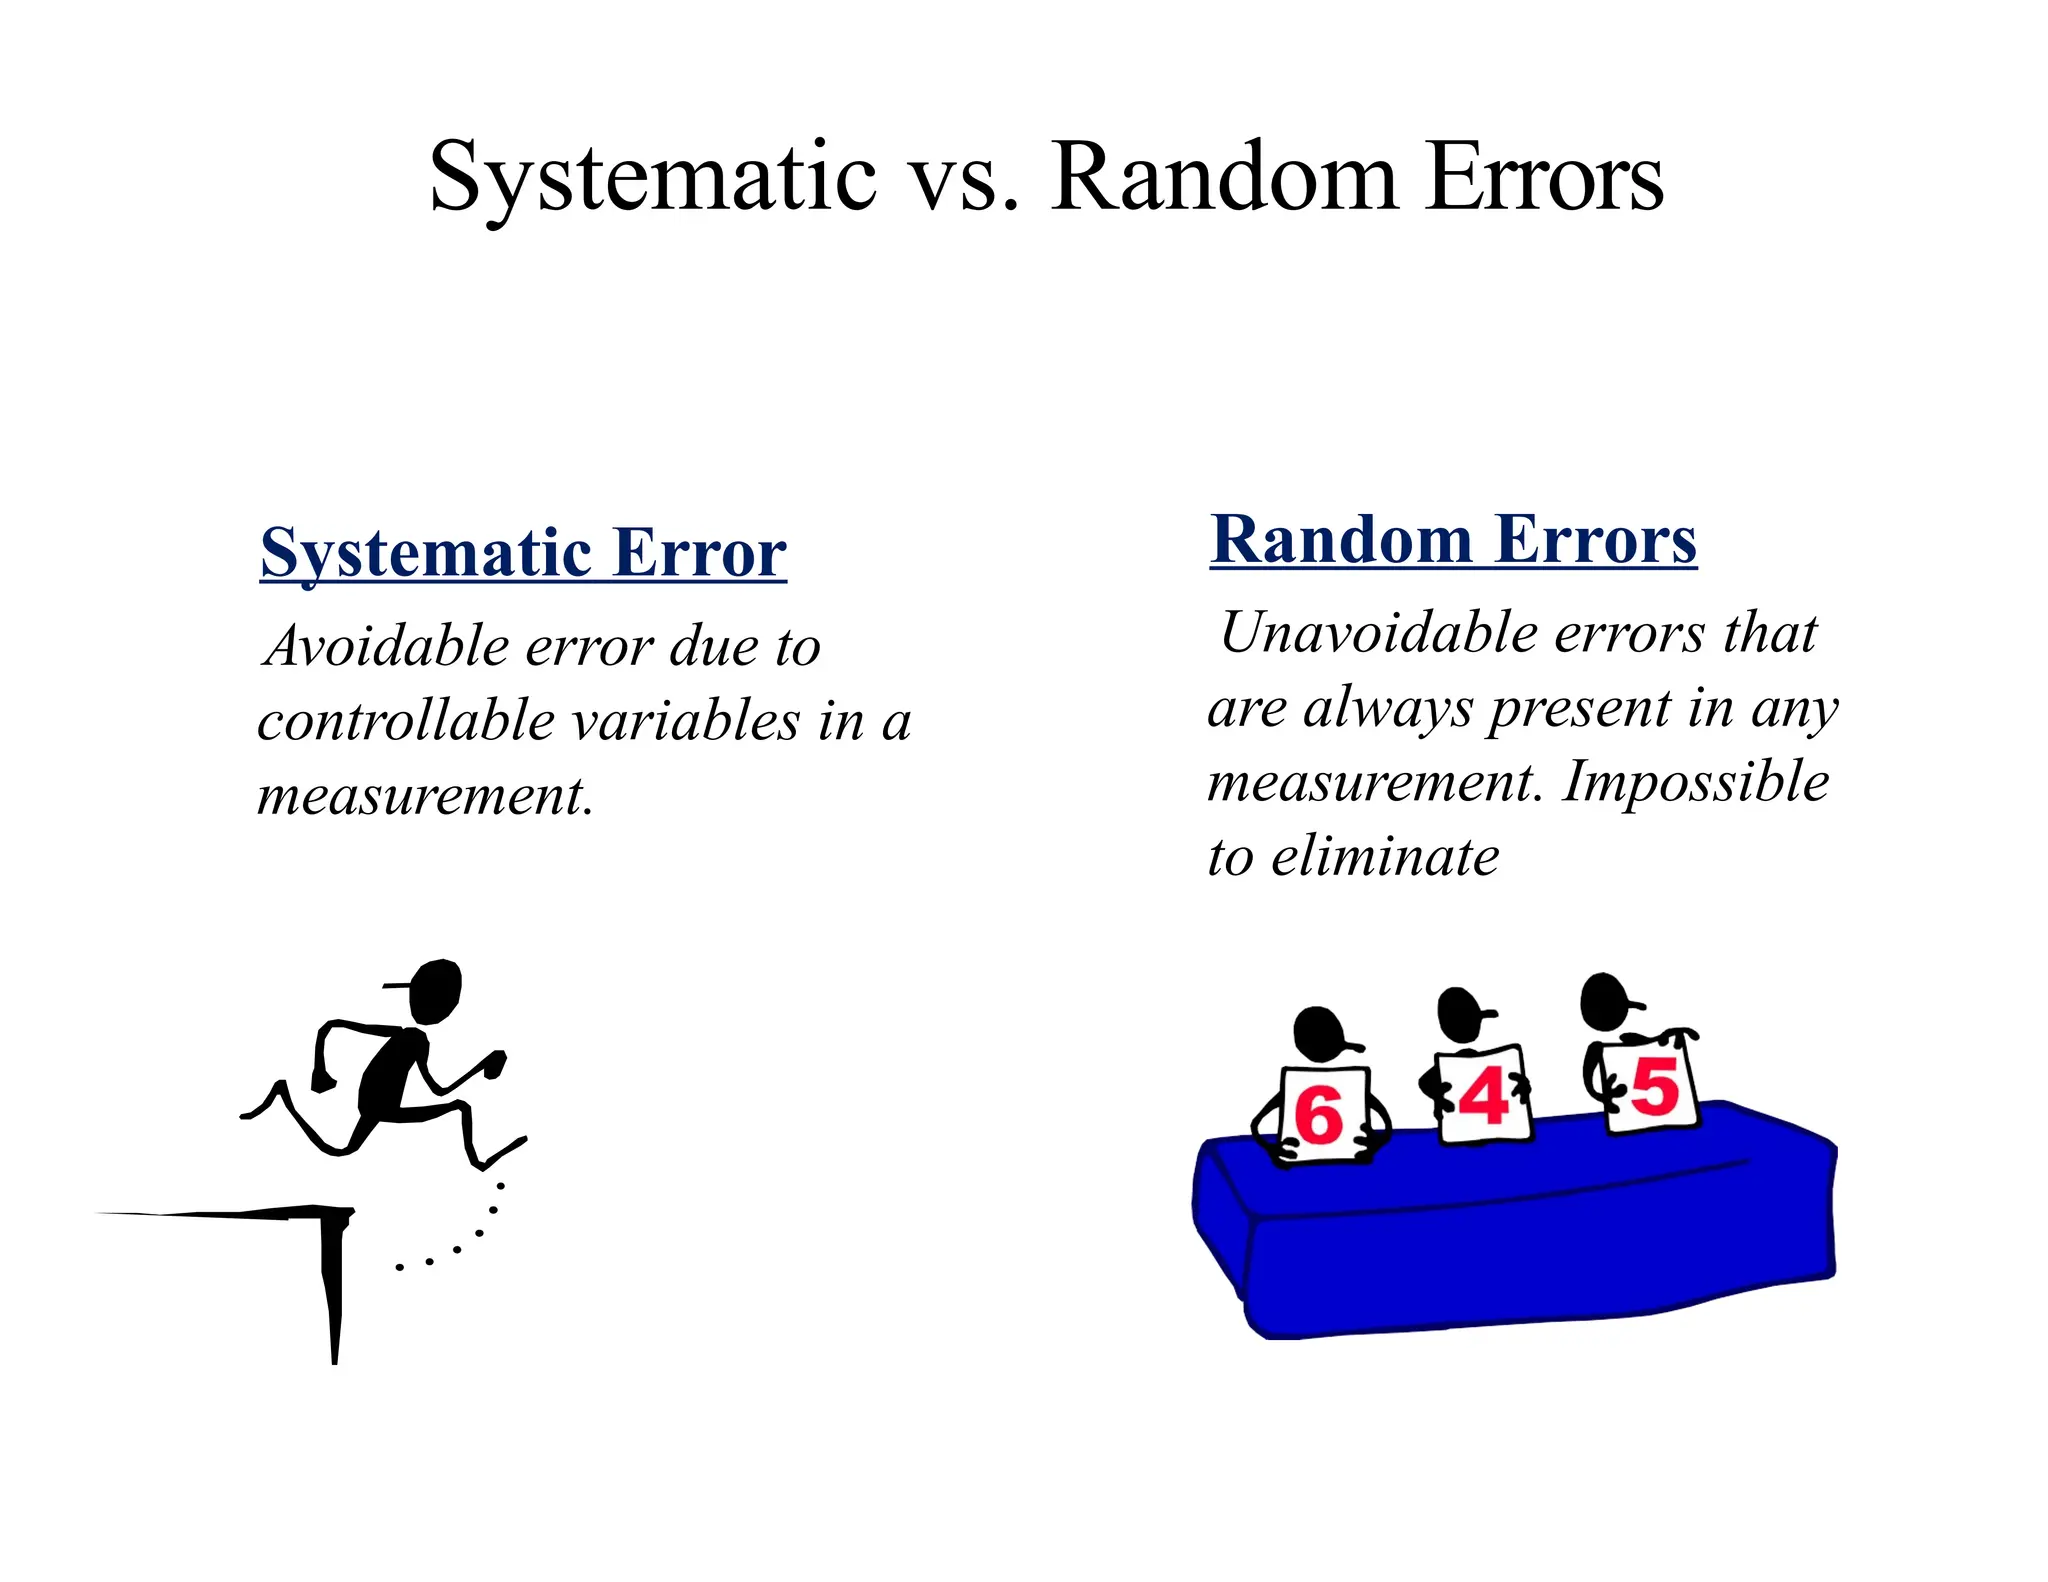
Systematic vs. RandomErrors
Systematic Error
Avoidable error due to
controllable variables in a
measurement.
Random Errors
Unavoidable errors that
are always present in any
measurement. Impossible
to eliminate
15.
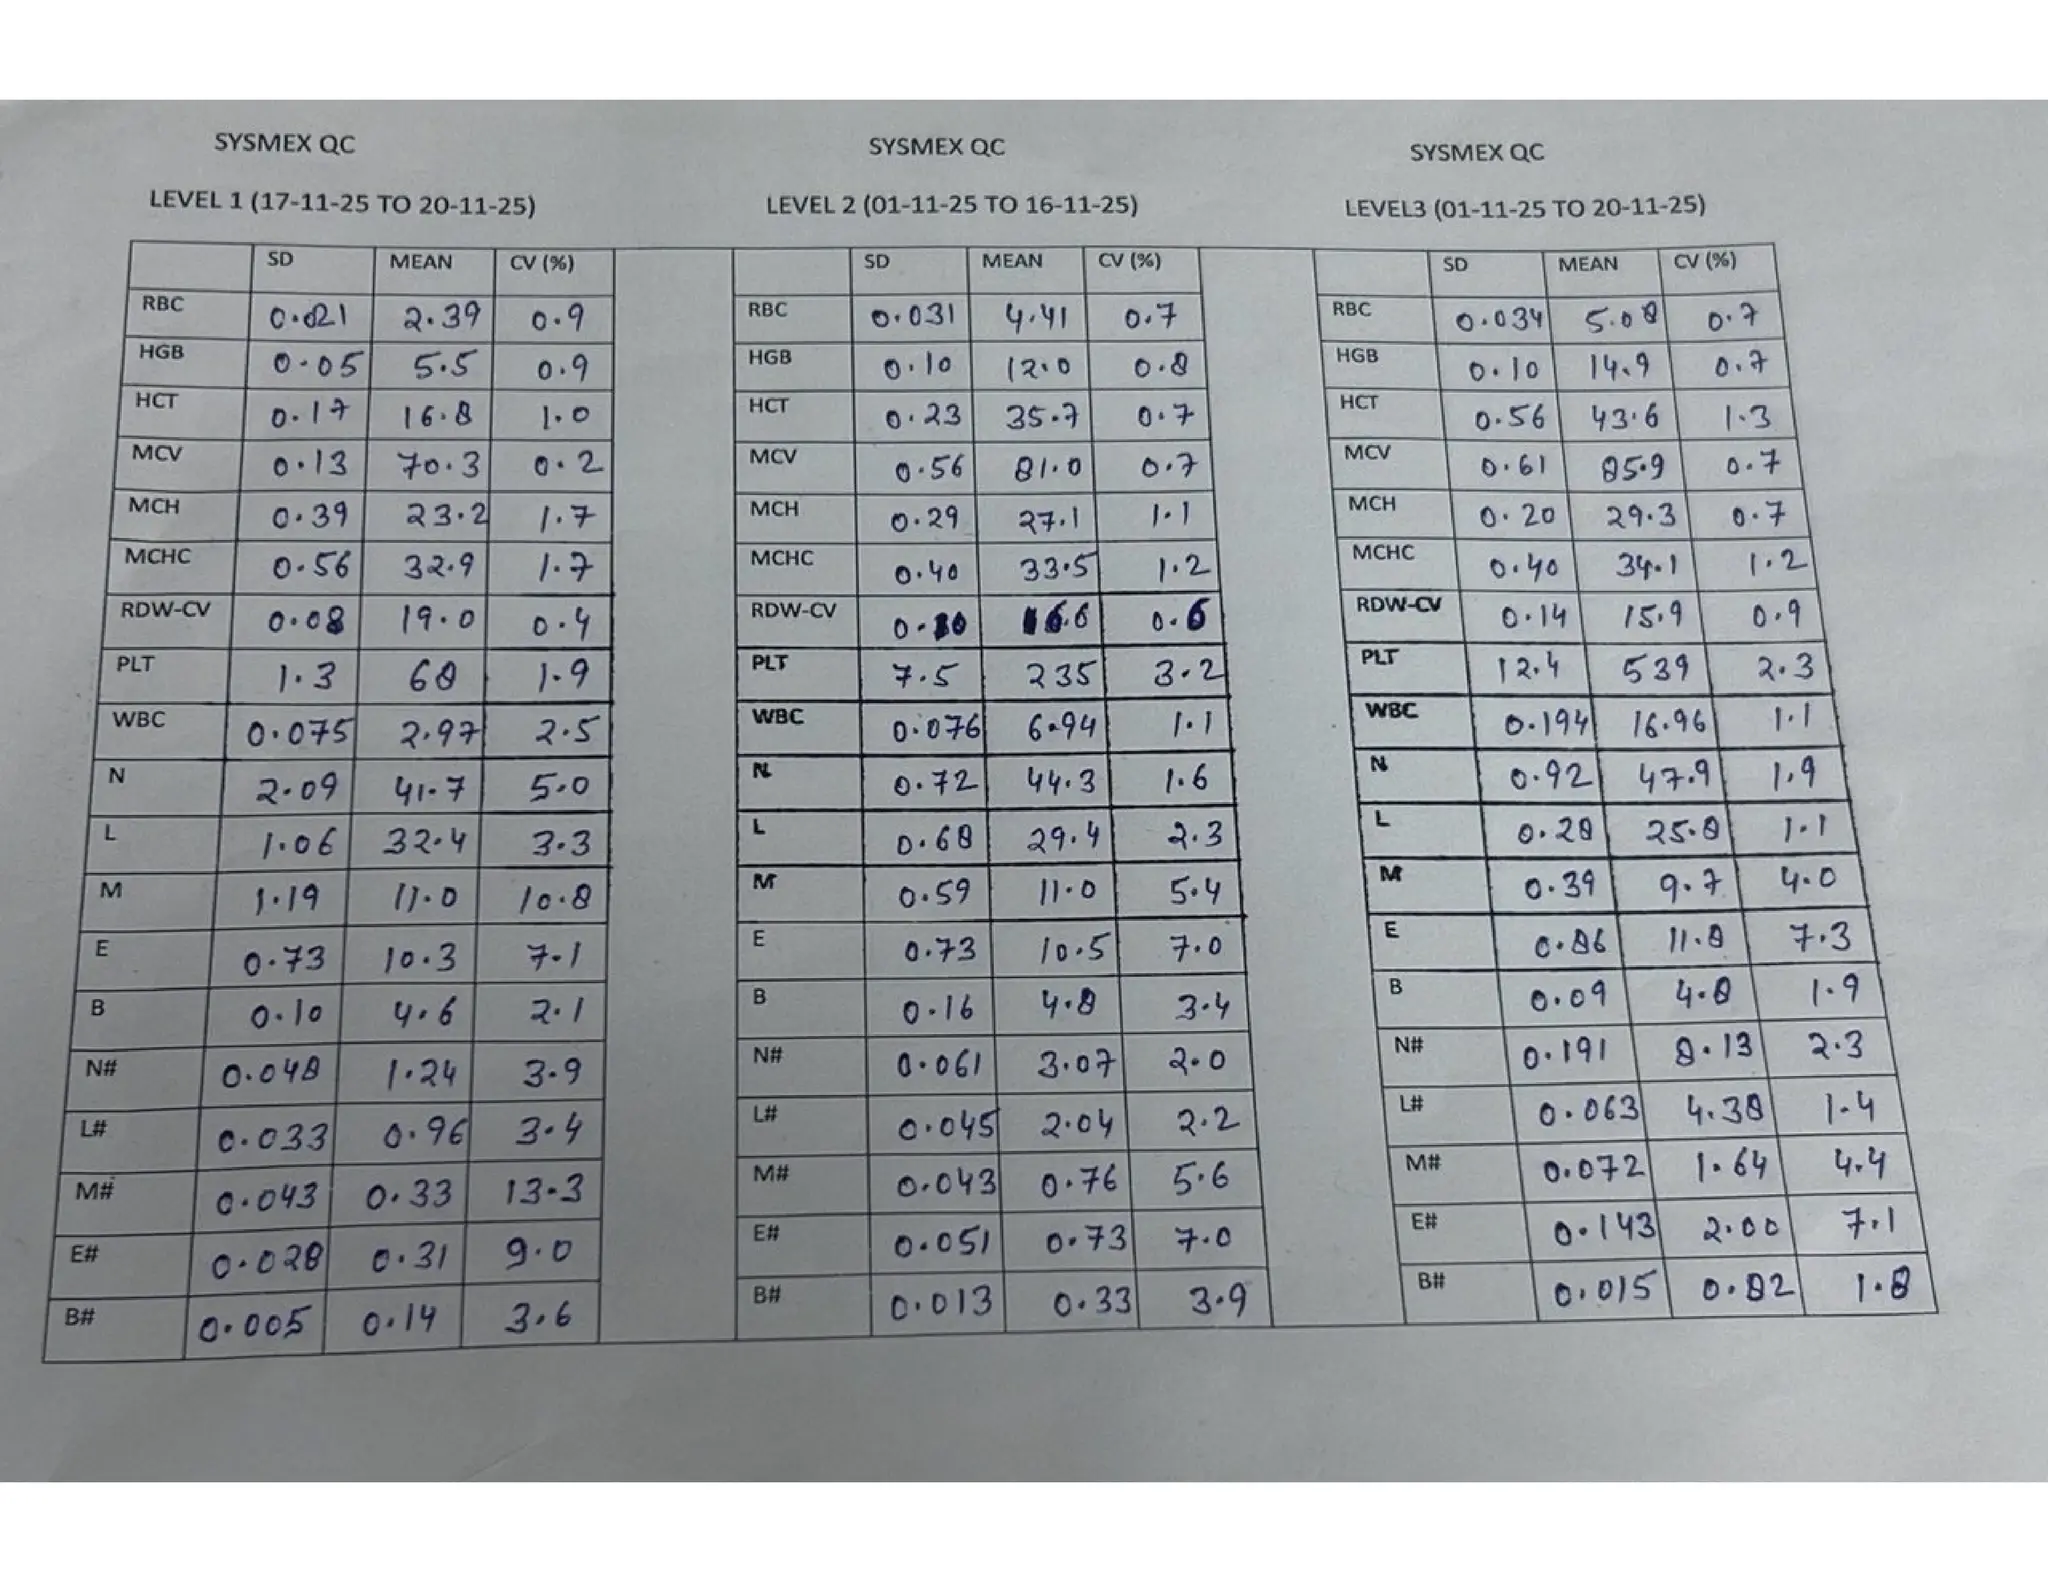
Statistical Quality ControlExercise
•Standard Control values (3 levels of control)
•Calculation of mean
•Calculation of standard deviation
•Creation of Levey-Jennings chart
16.
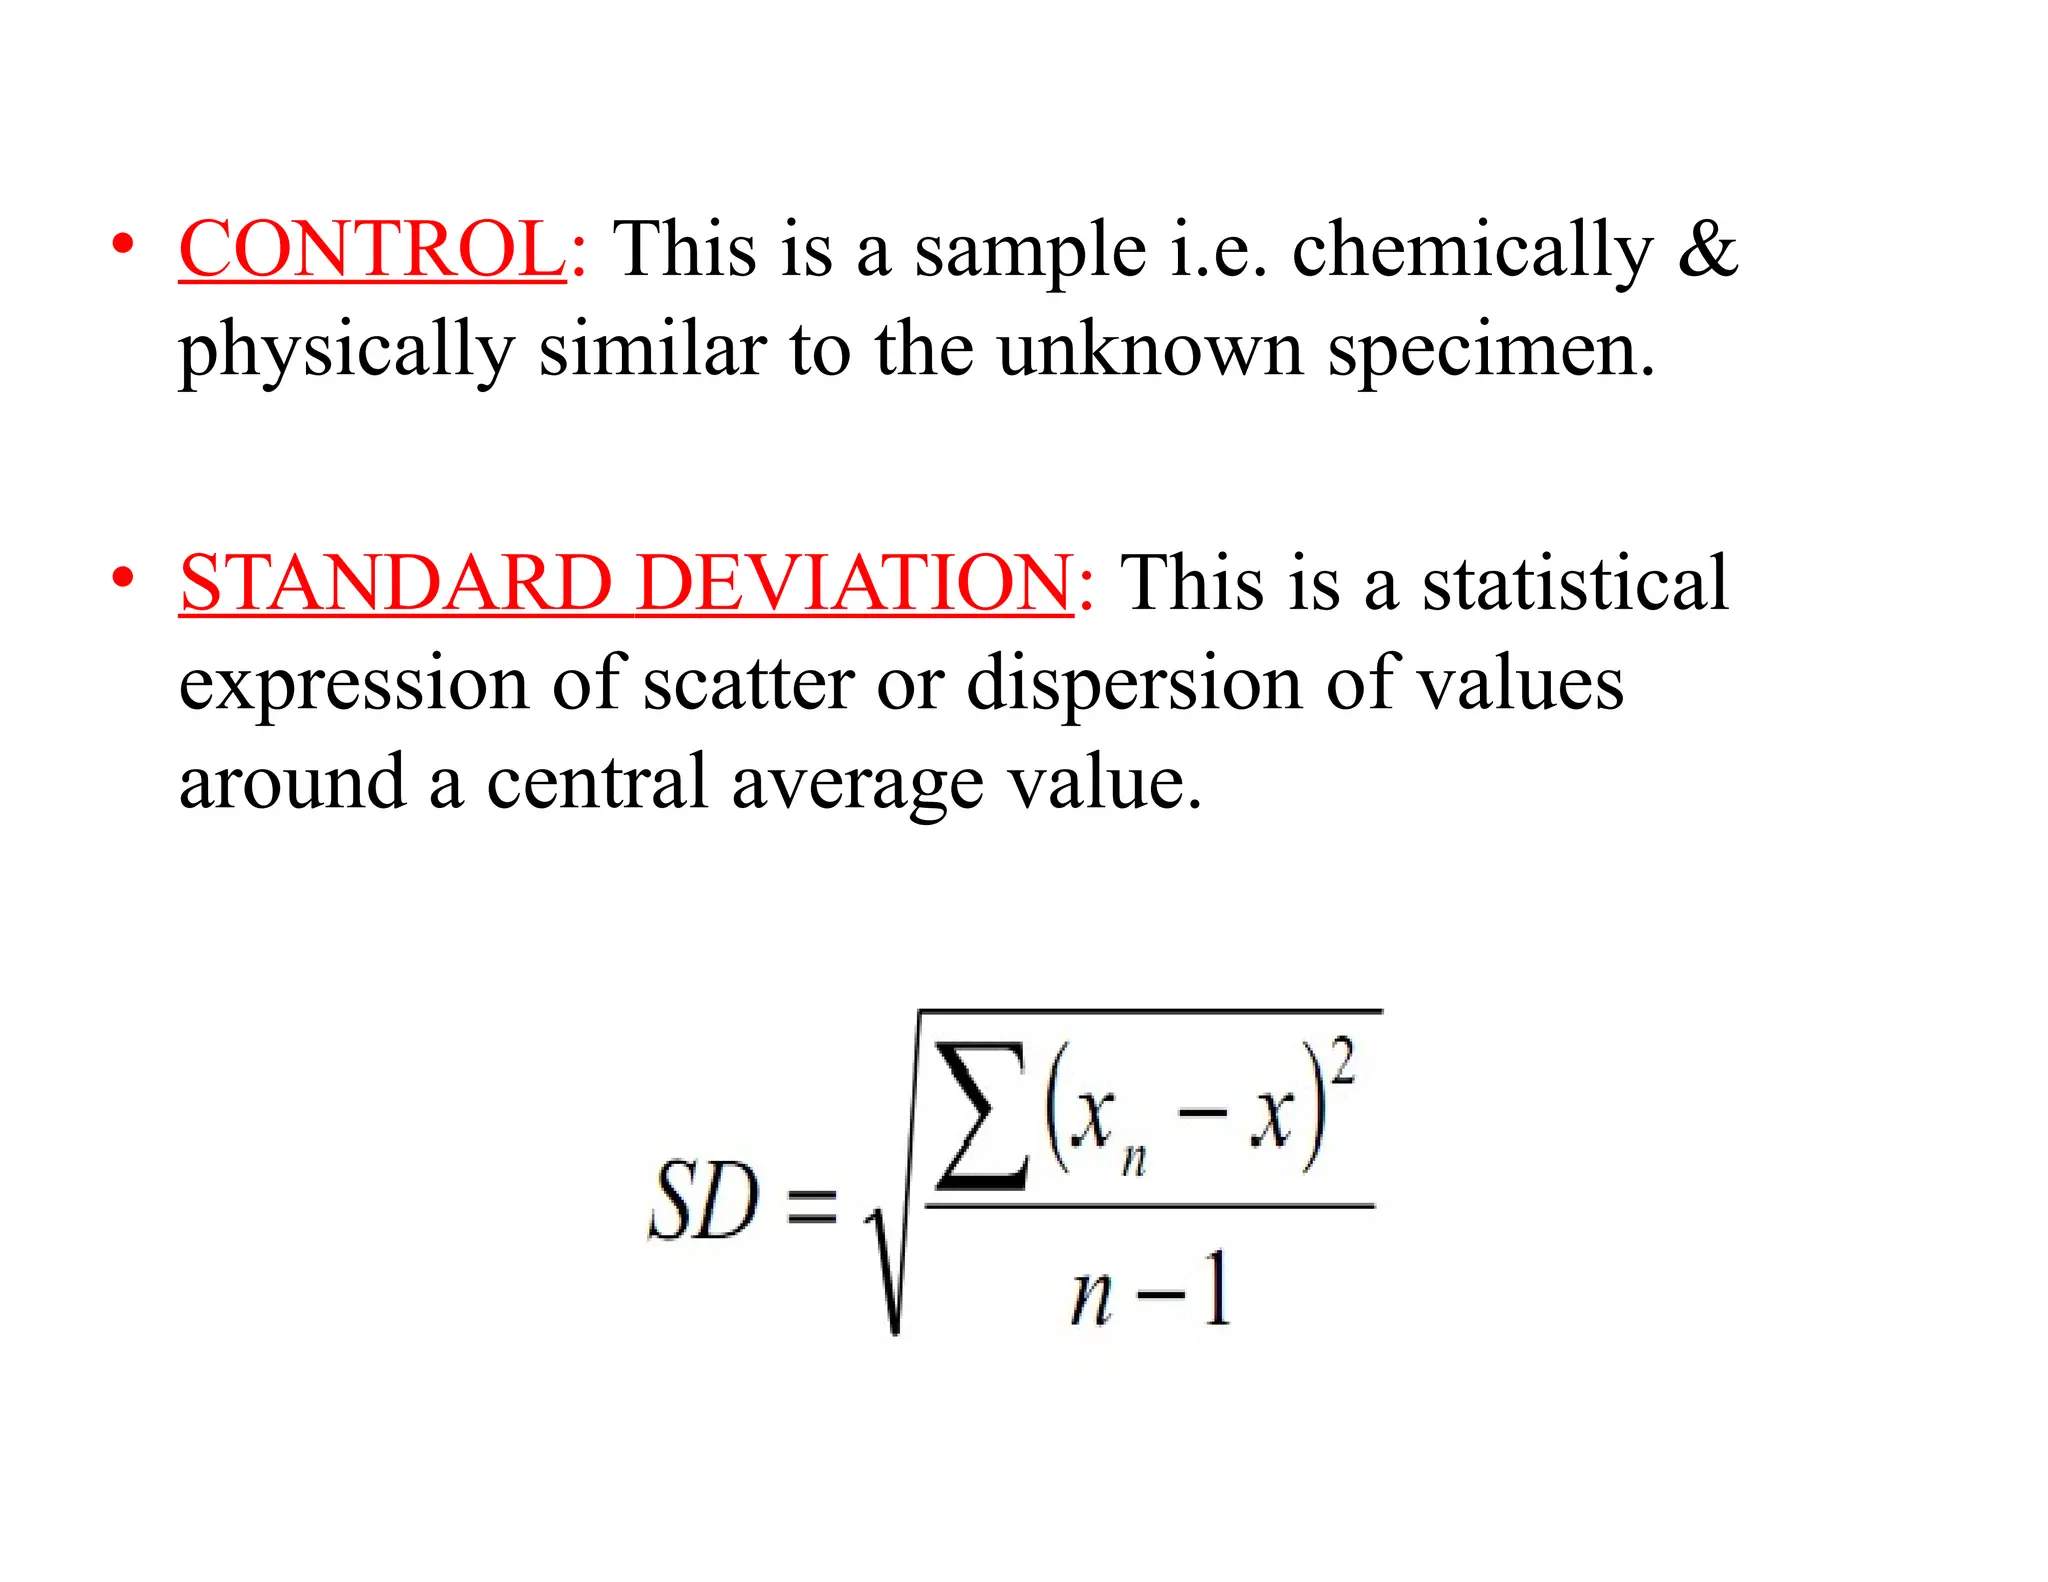
• CONTROL: Thisis a sample i.e. chemically &
physically similar to the unknown specimen.
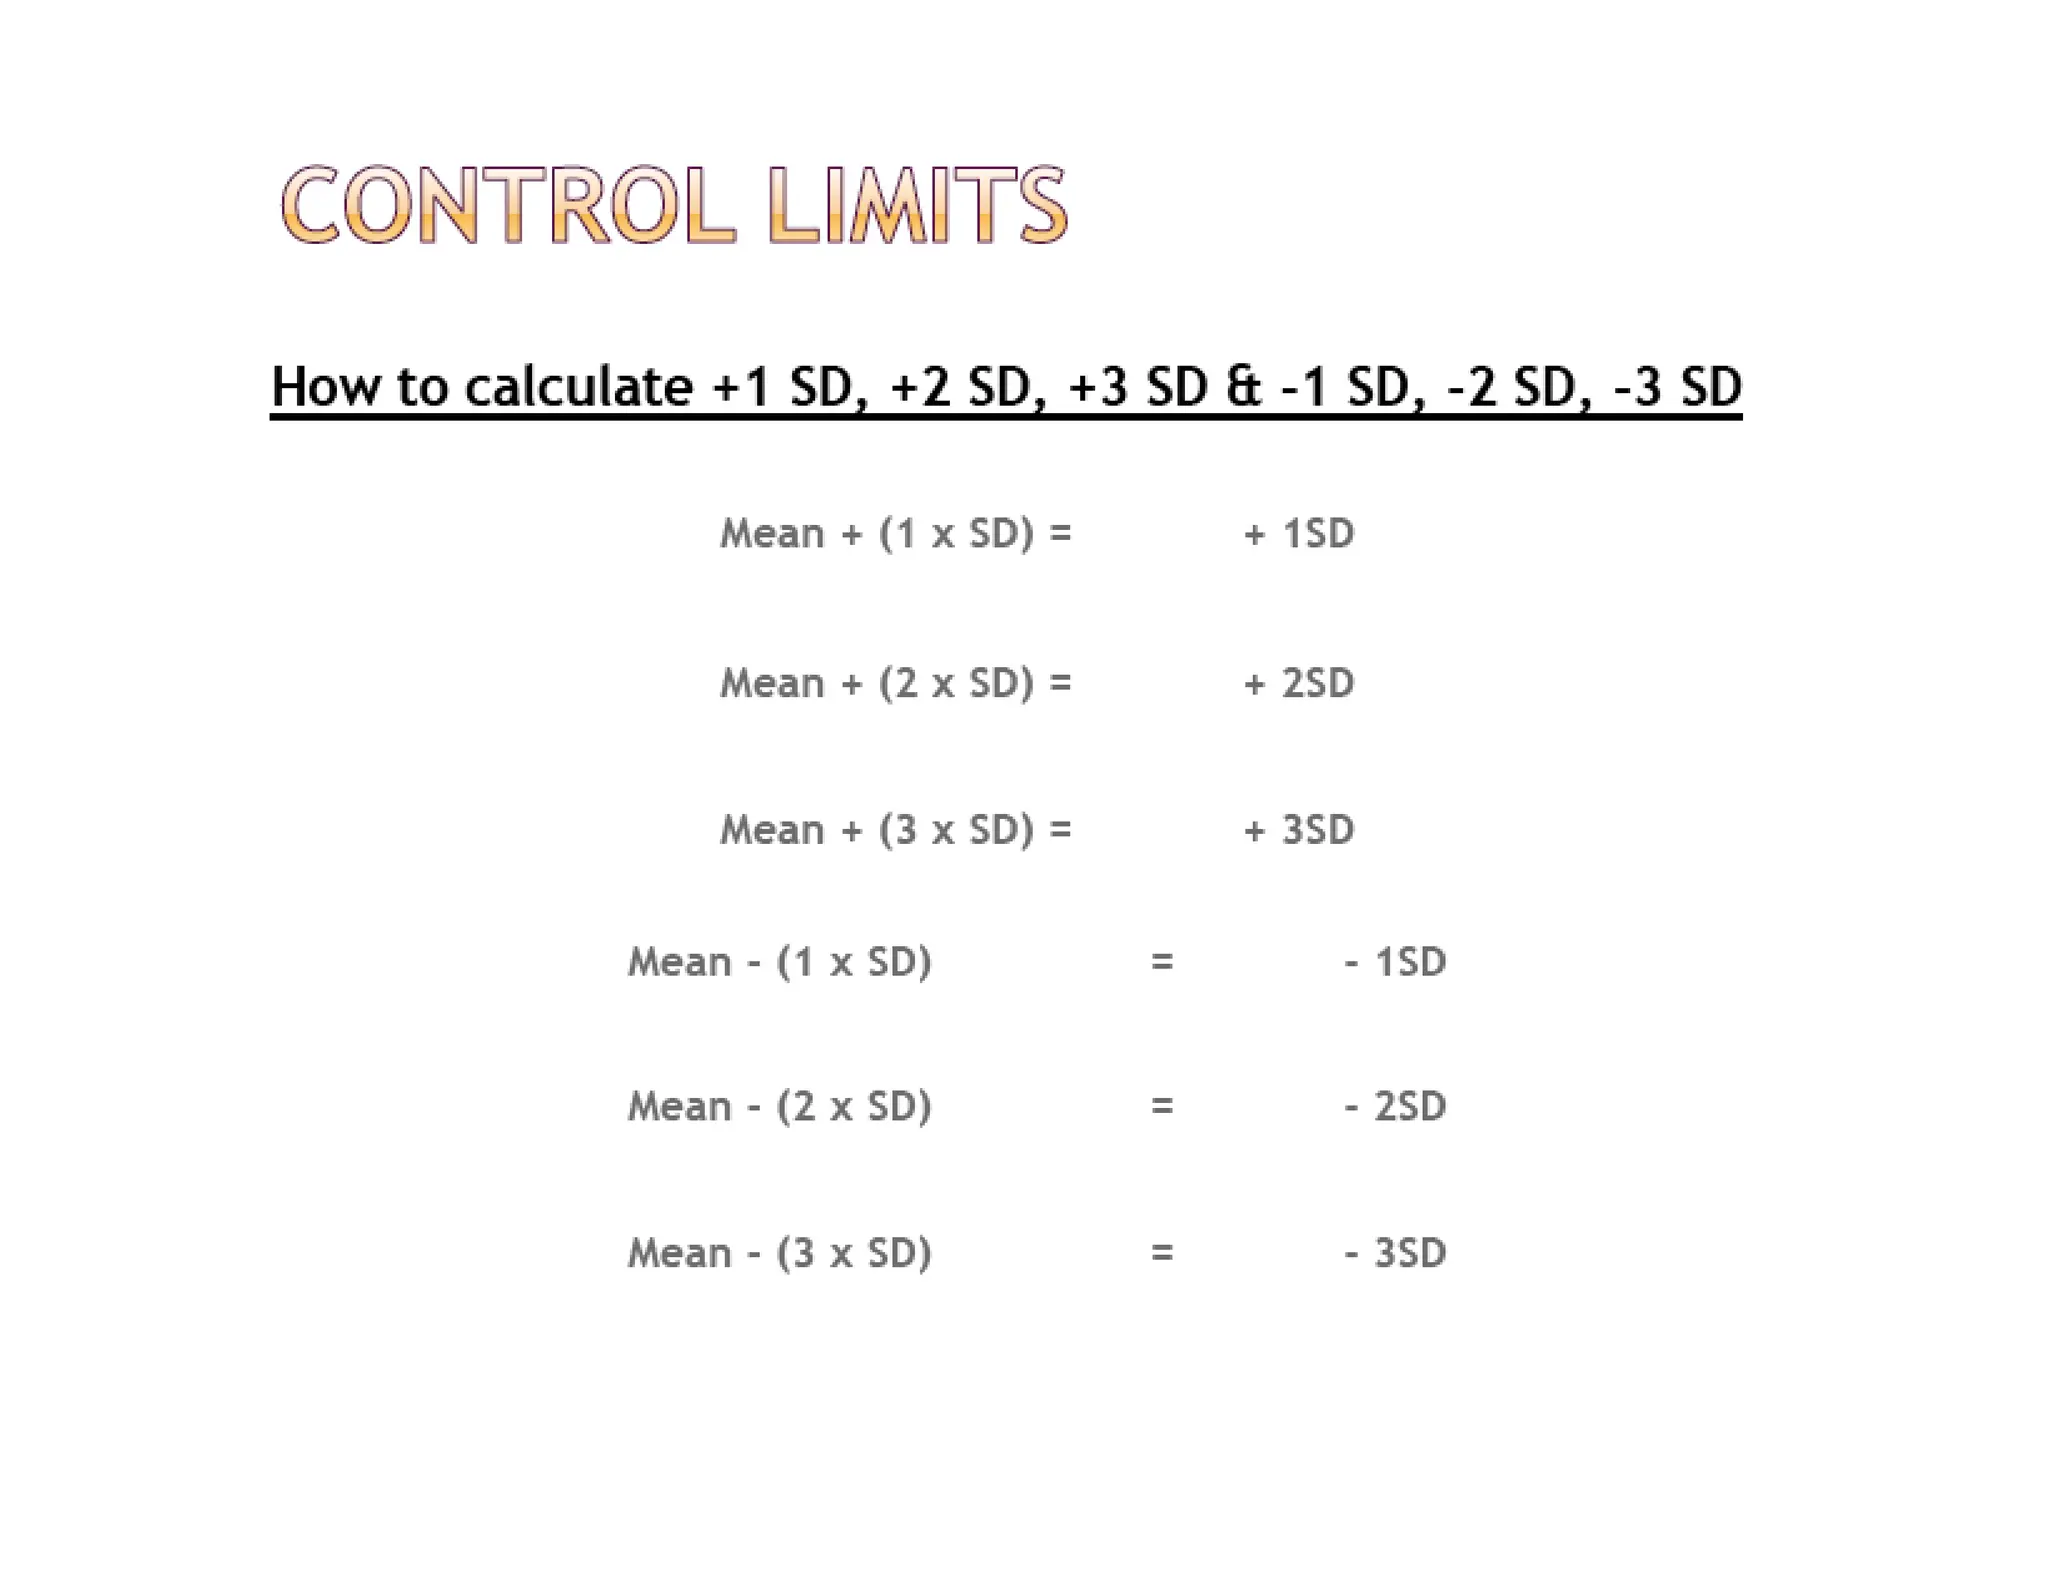
• STANDARD DEVIATION: This is a statistical
expression of scatter or dispersion of values
around a central average value.
17.
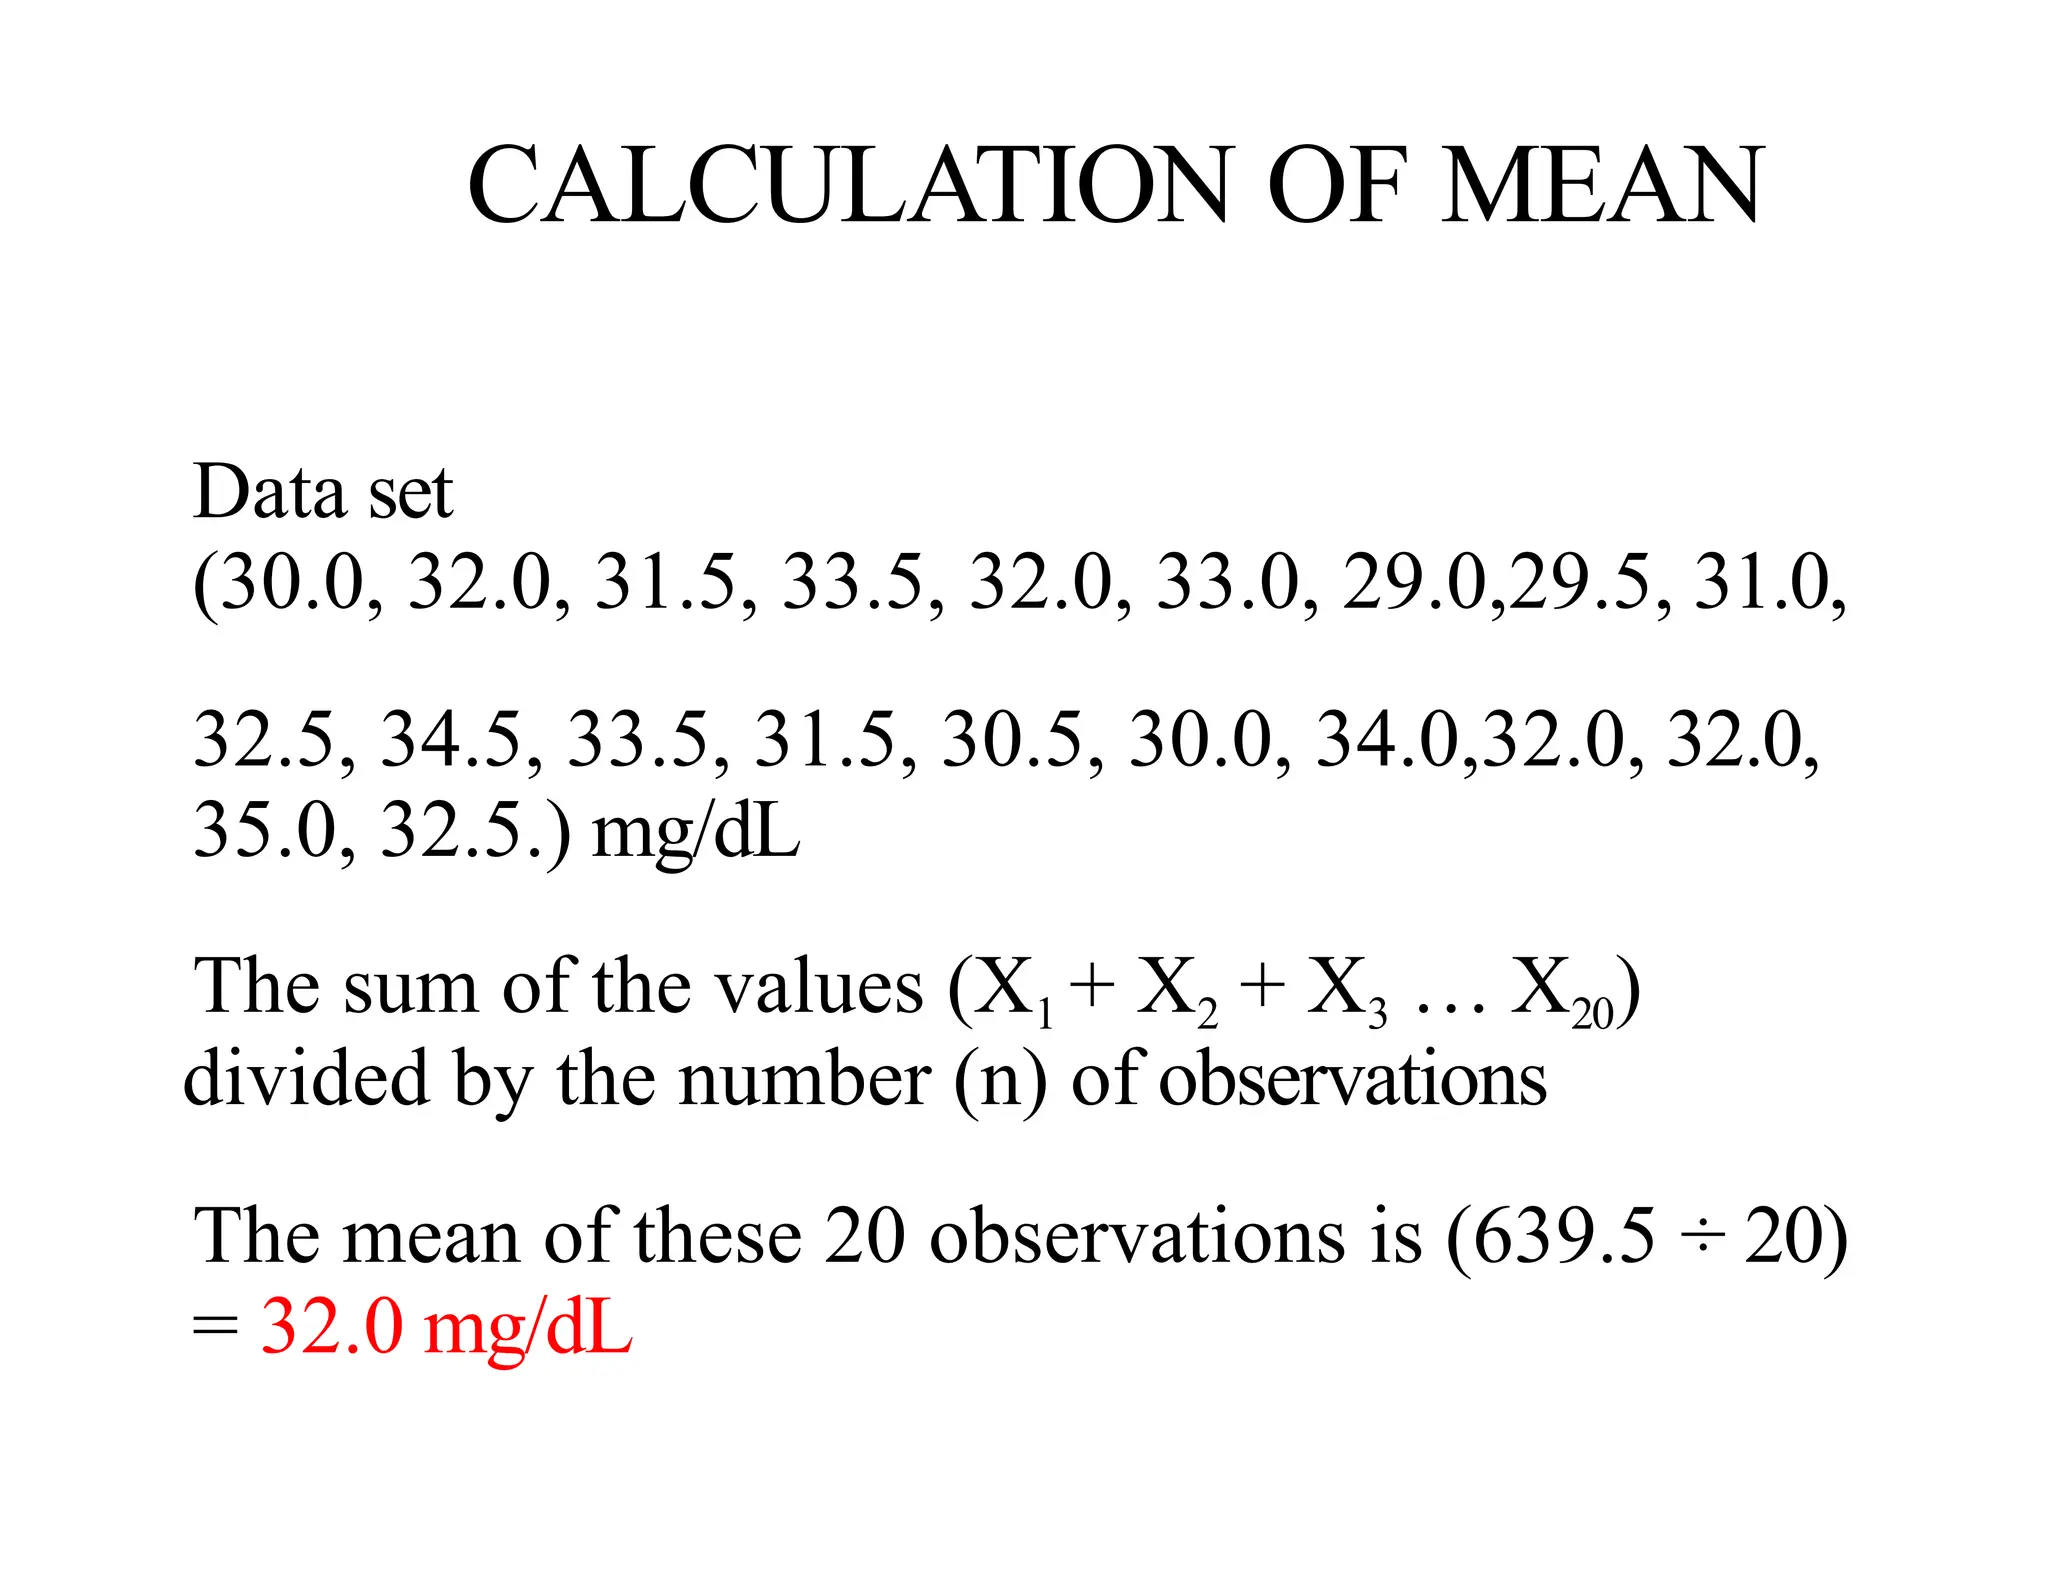
CALCULATION OF MEAN
Dataset
(30.0, 32.0, 31.5, 33.5, 32.0, 33.0, 29.0,29.5, 31.0,
32.5, 34.5, 33.5, 31.5, 30.5, 30.0, 34.0,32.0, 32.0,
35.0, 32.5.) mg/dL
The sum of the values (X1 + X2 + X3 … X20)
divided by the number (n) of observations
The mean of these 20 observations is (639.5 ÷ 20)
= 32.0 mg/dL
19.
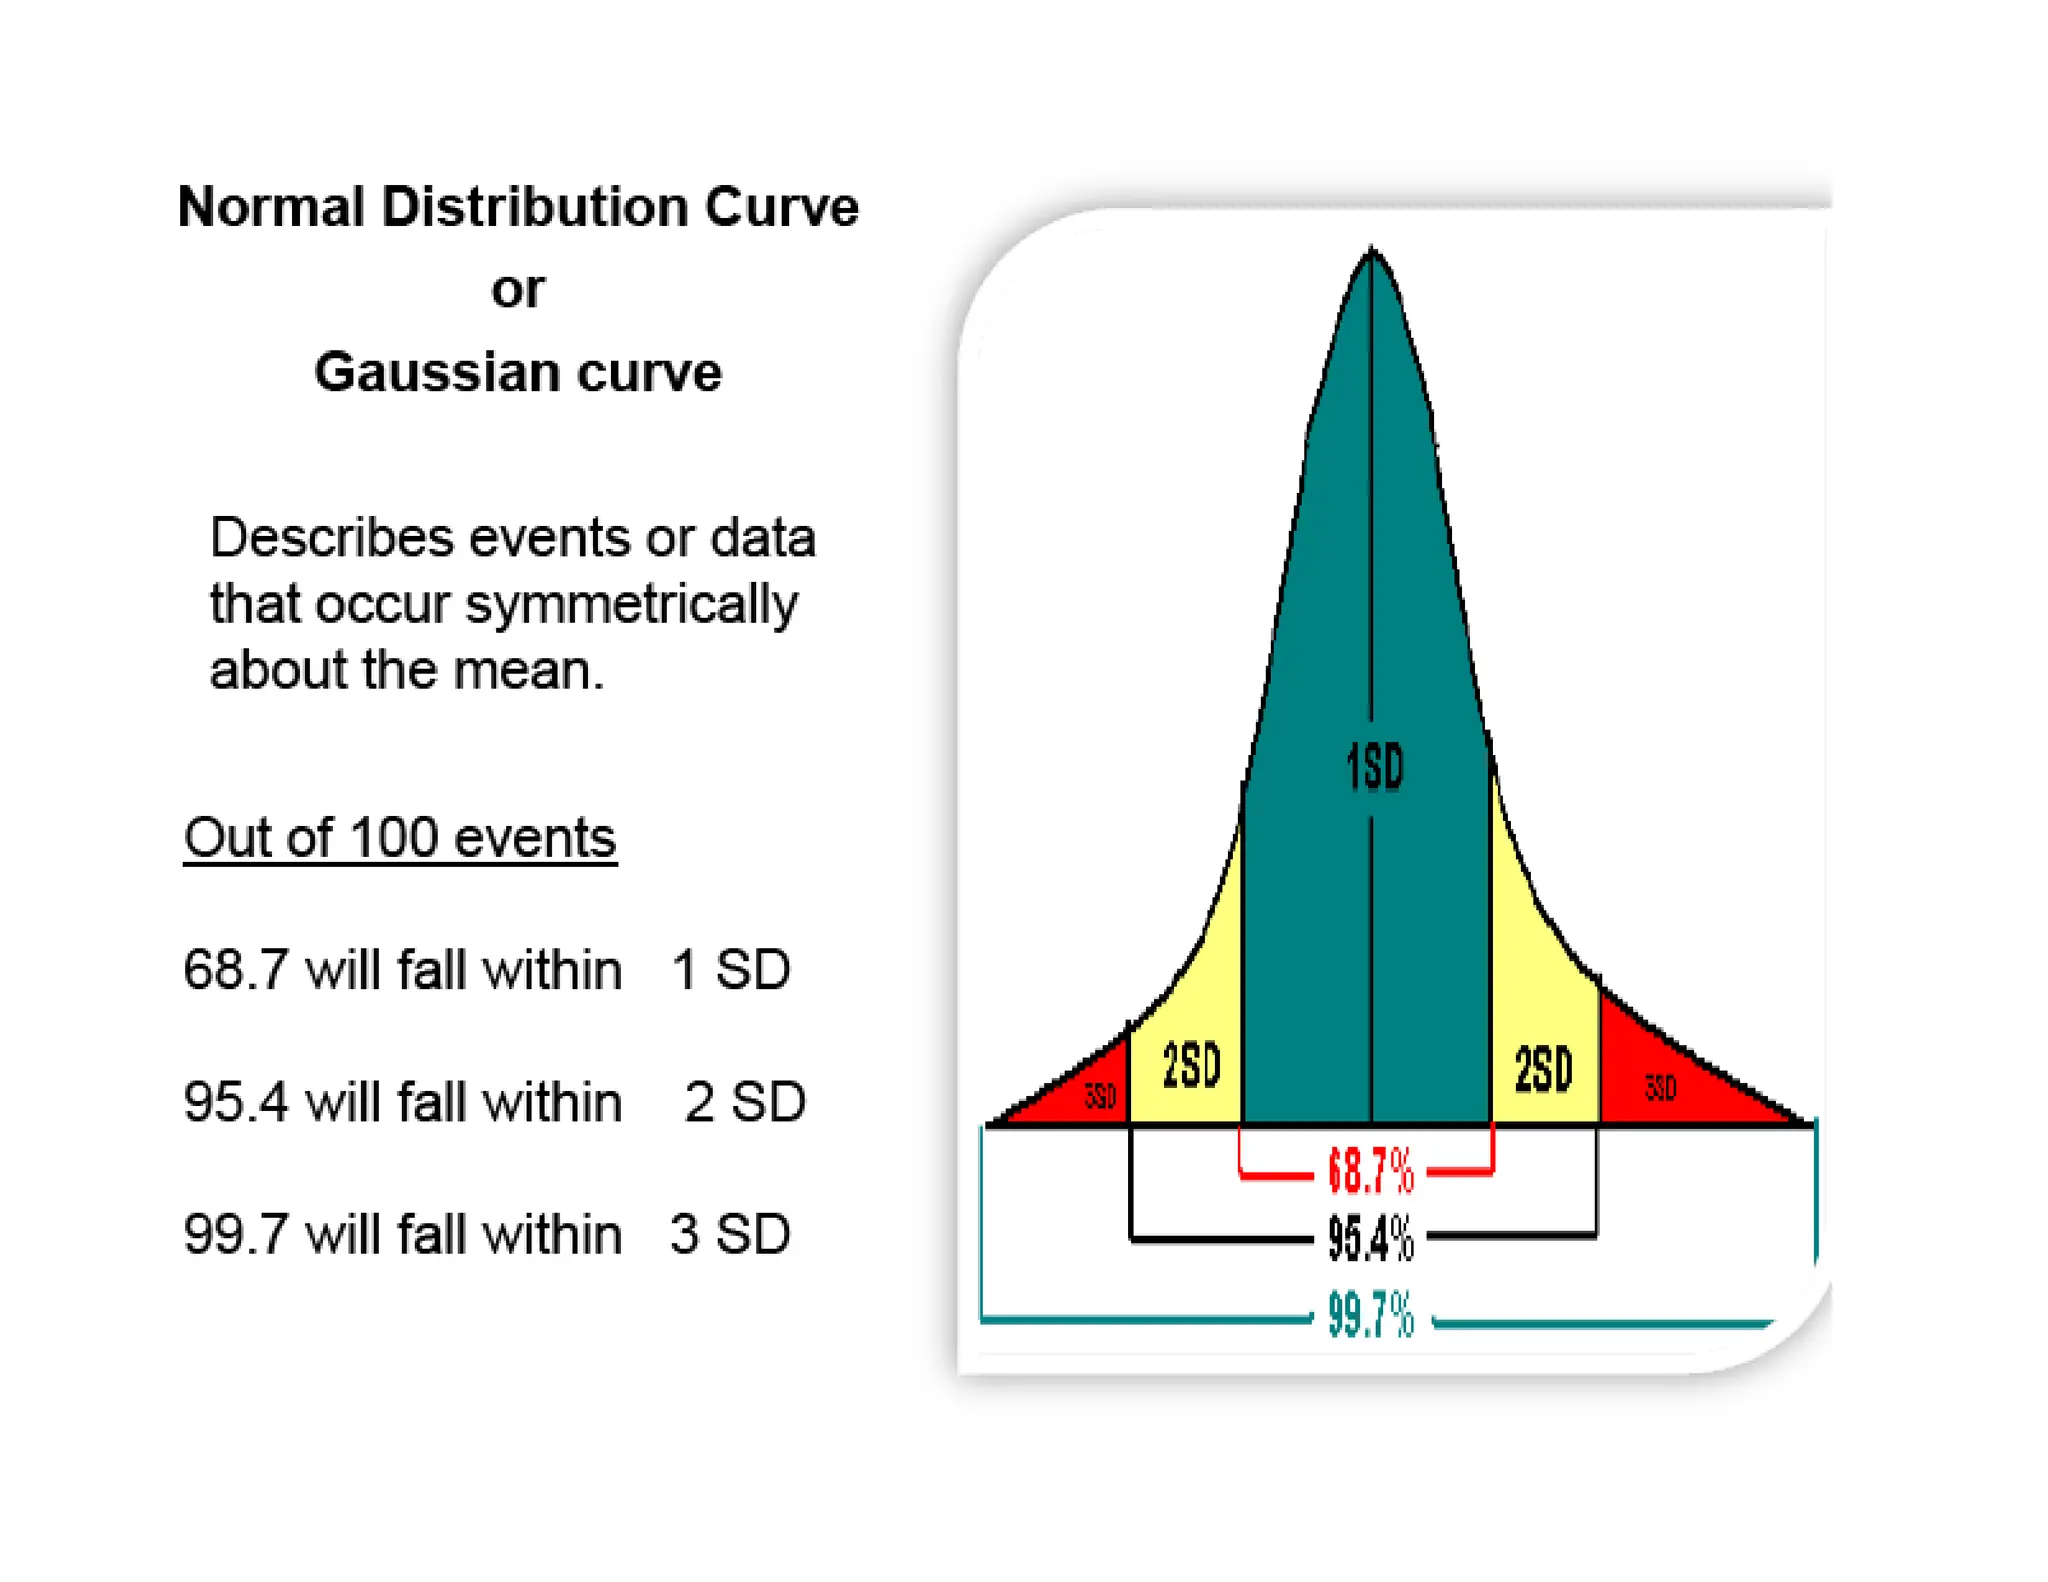
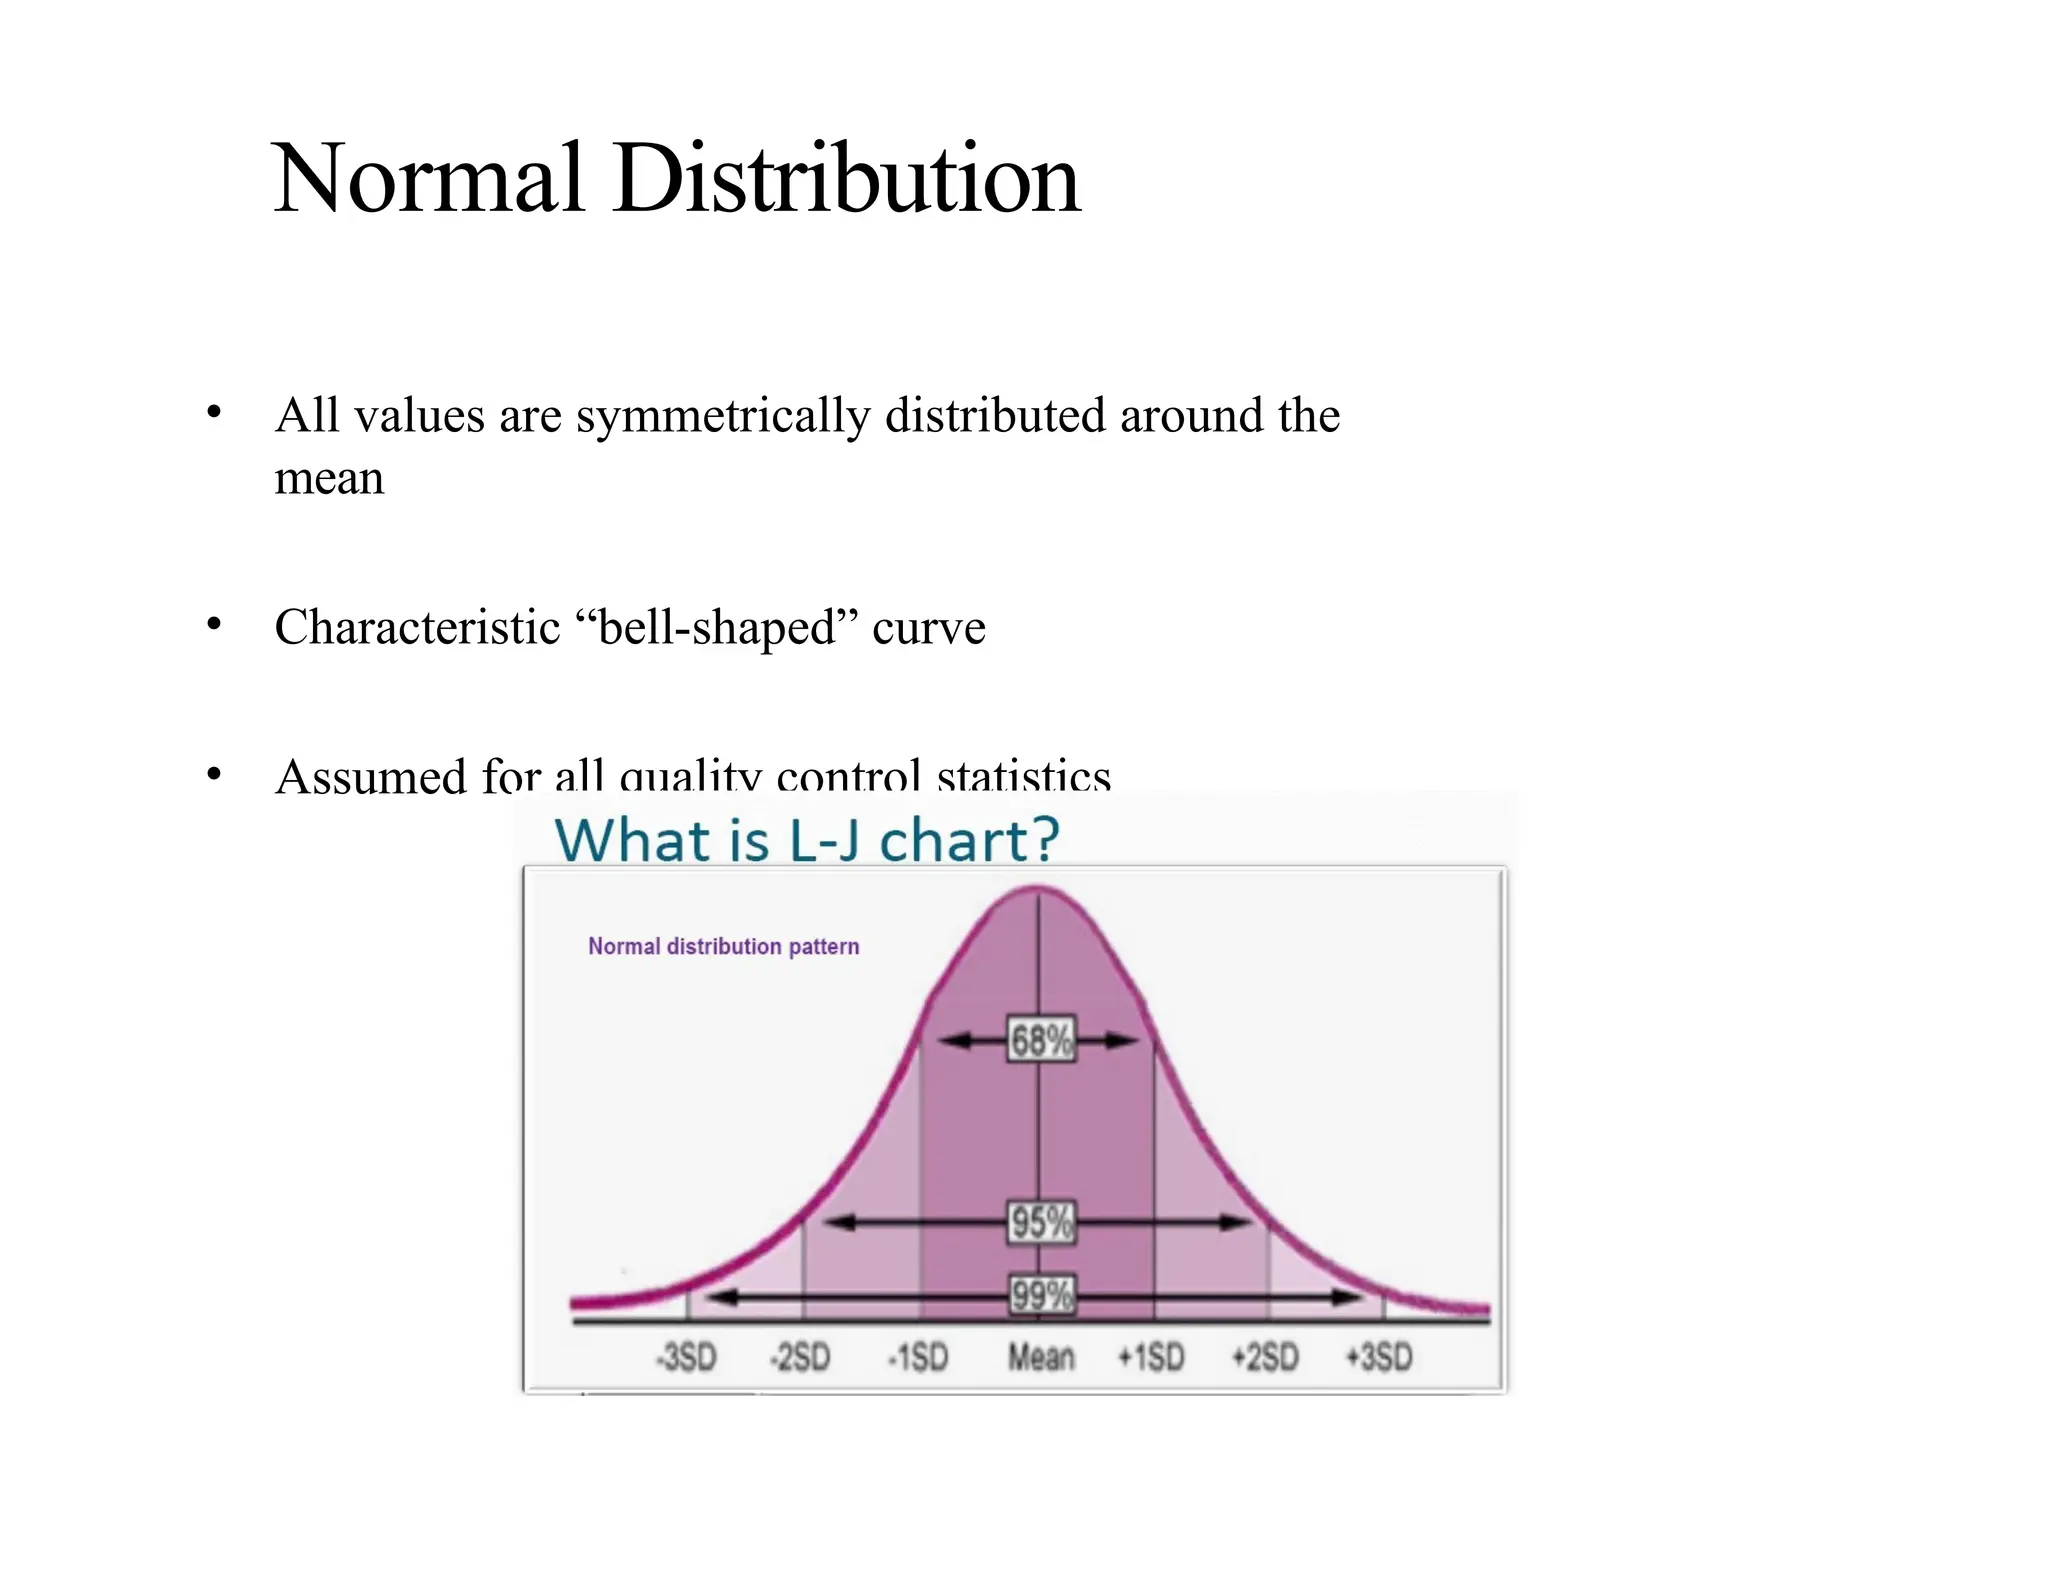
Normal Distribution
• Allvalues are symmetrically distributed around the
mean
• Characteristic “bell-shaped” curve
• Assumed for all quality control statistics
20.
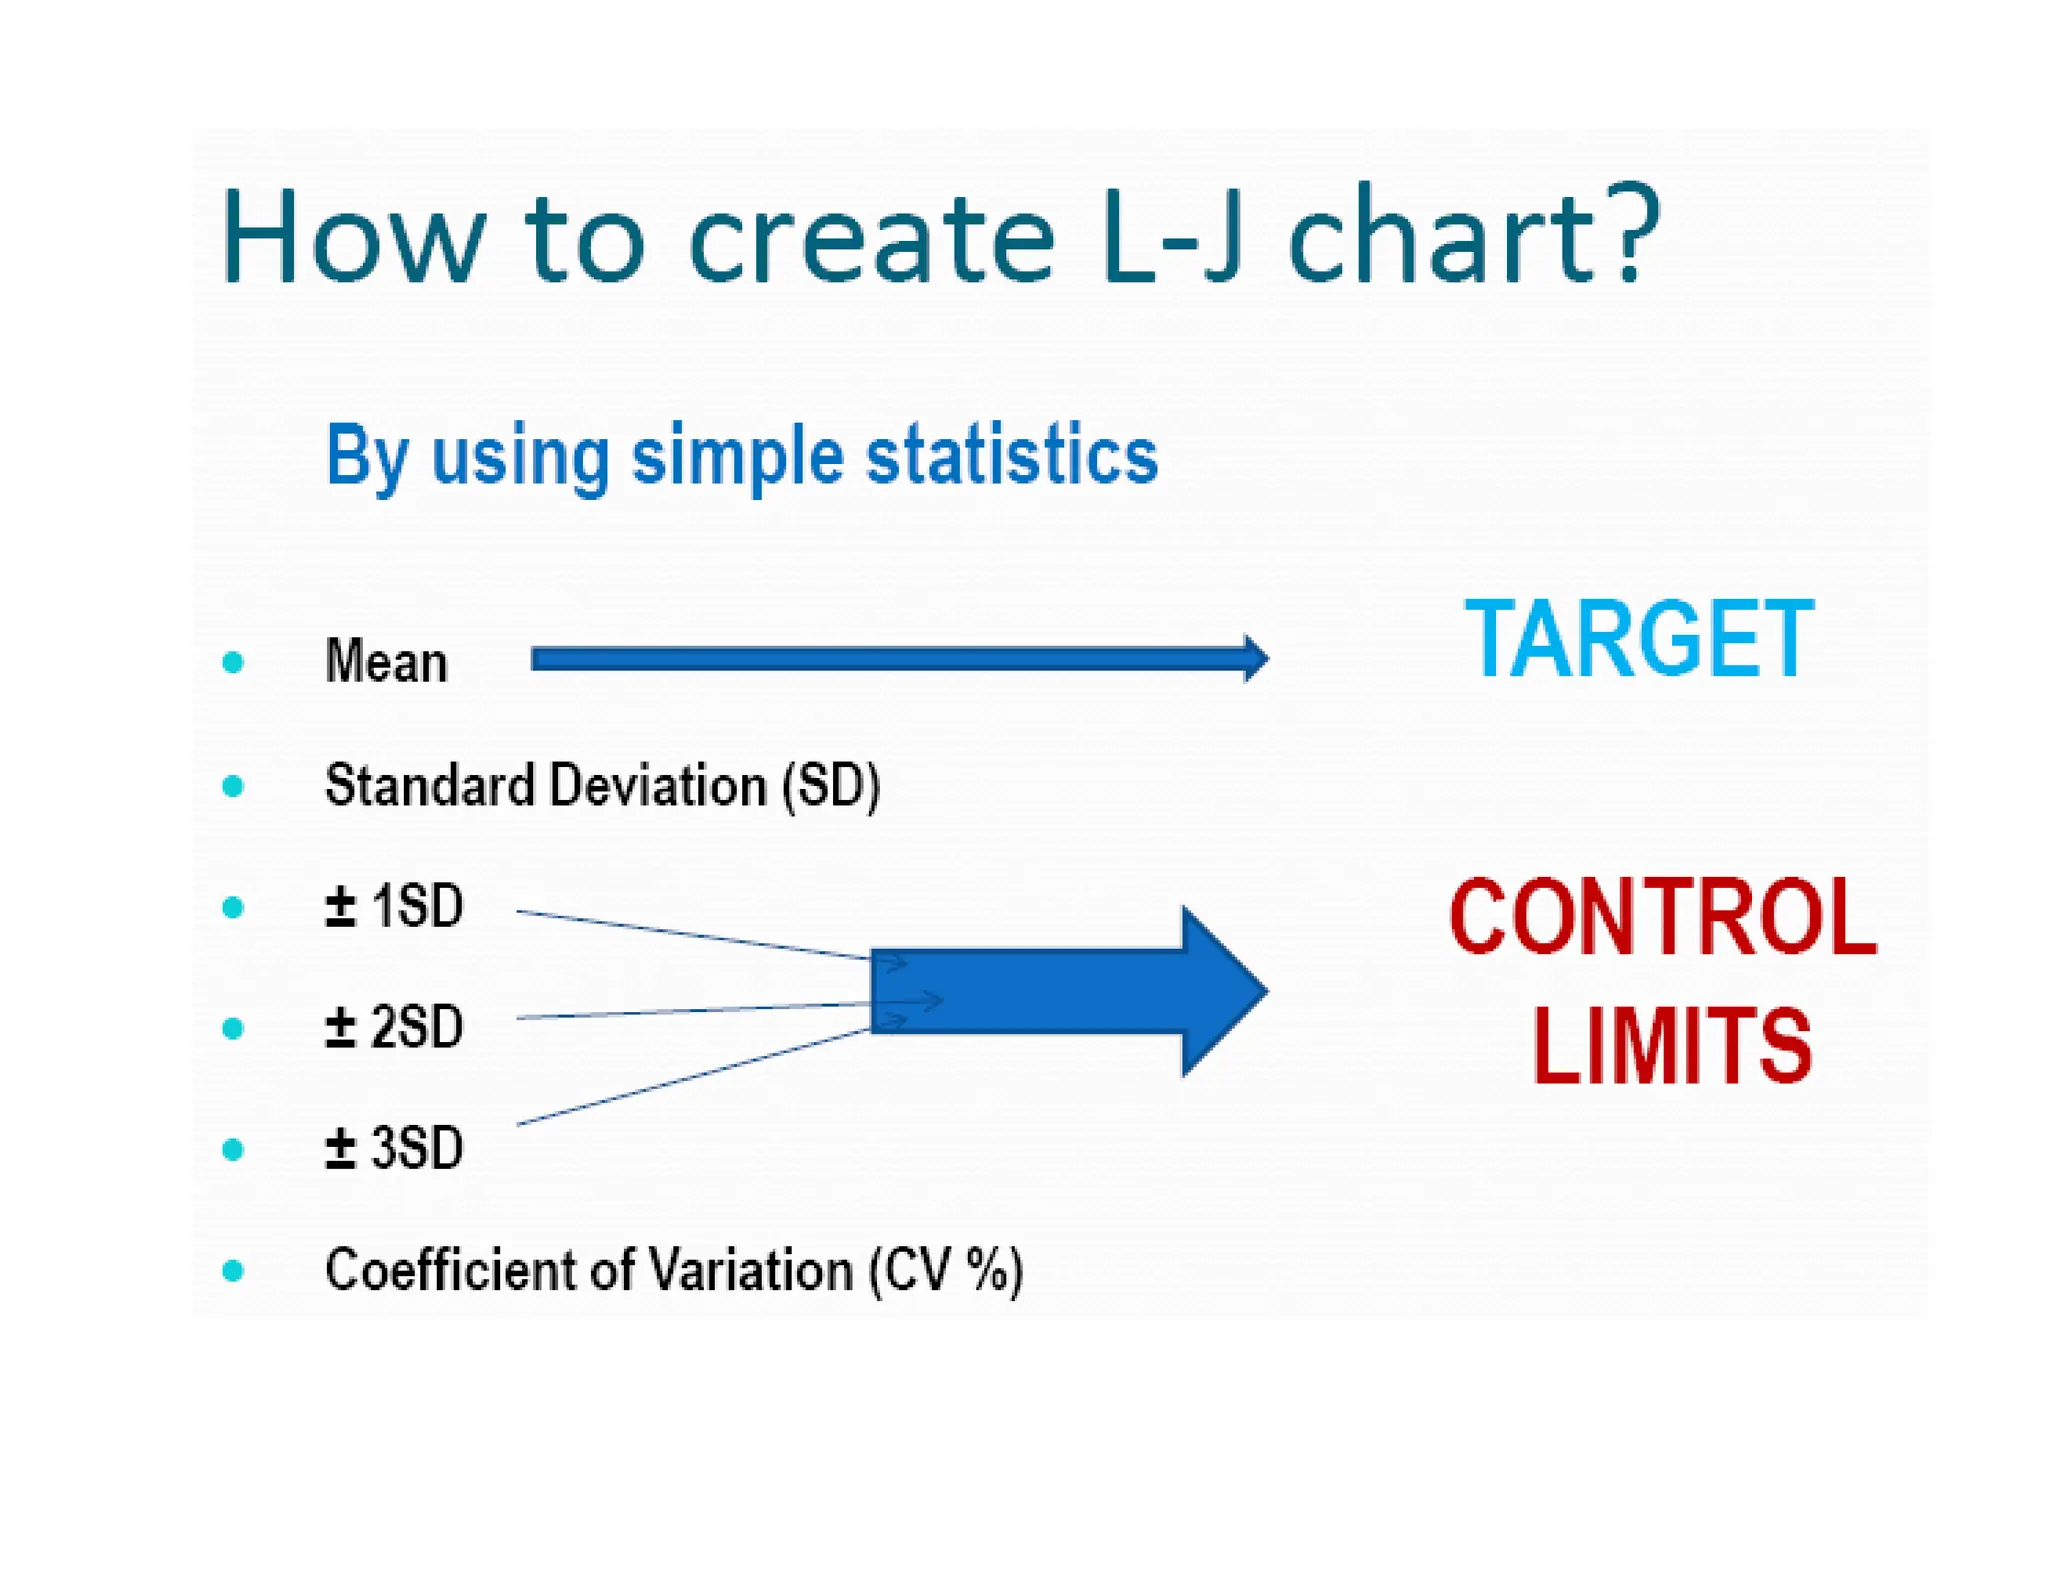
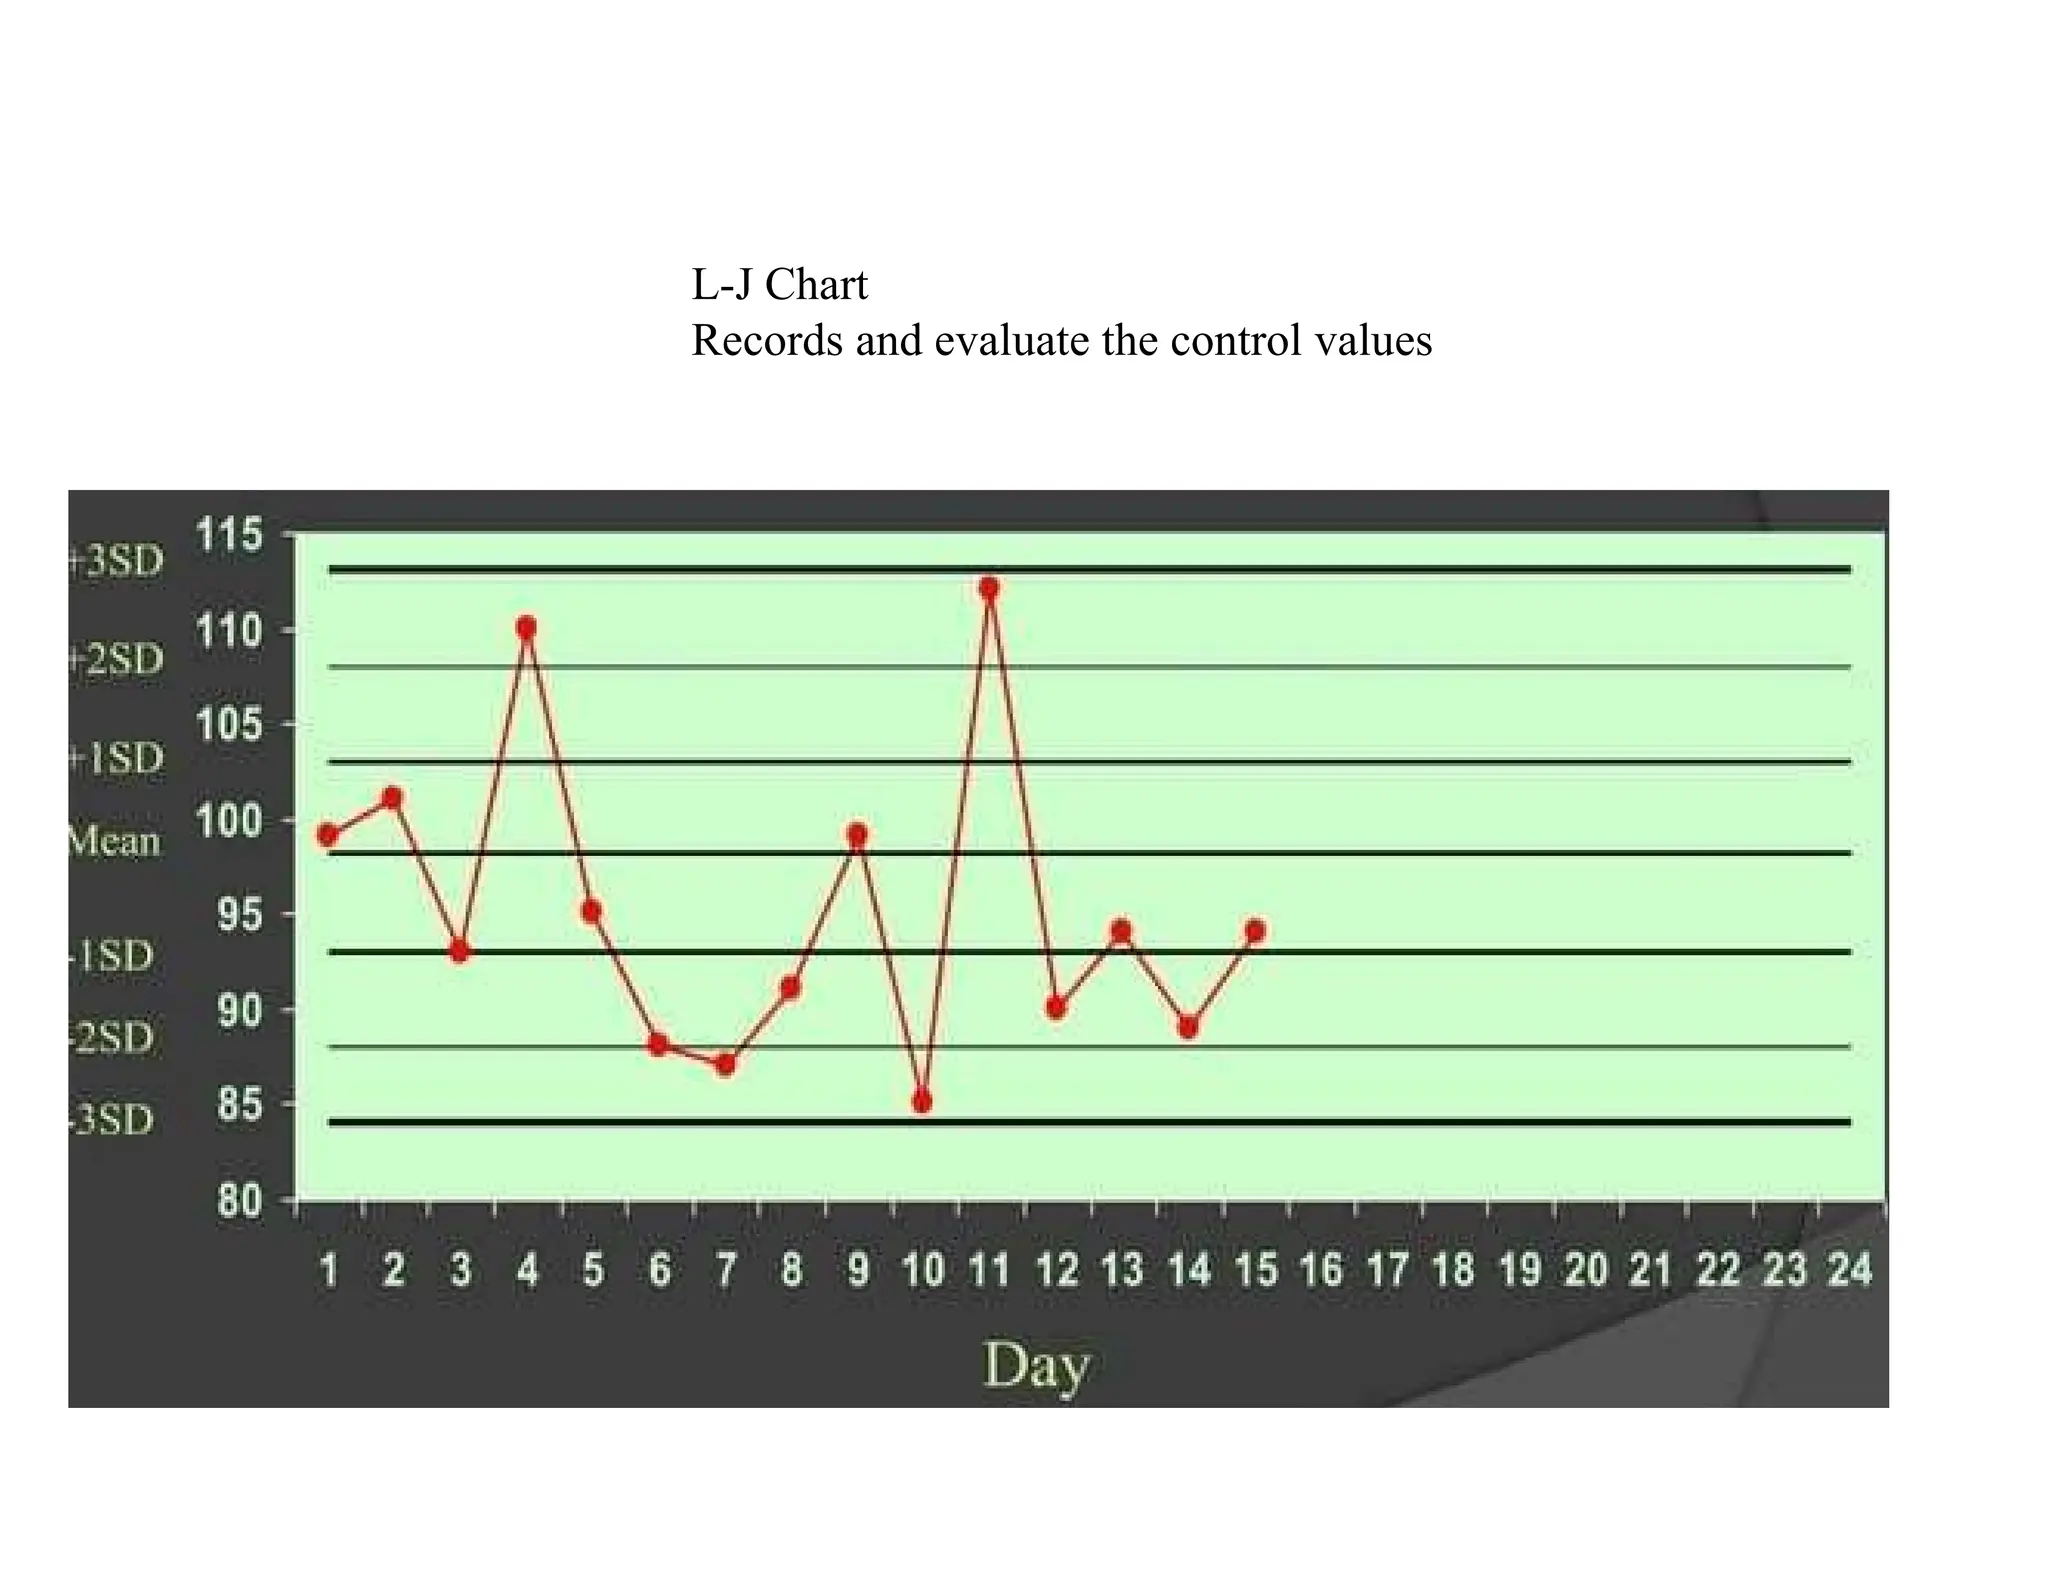
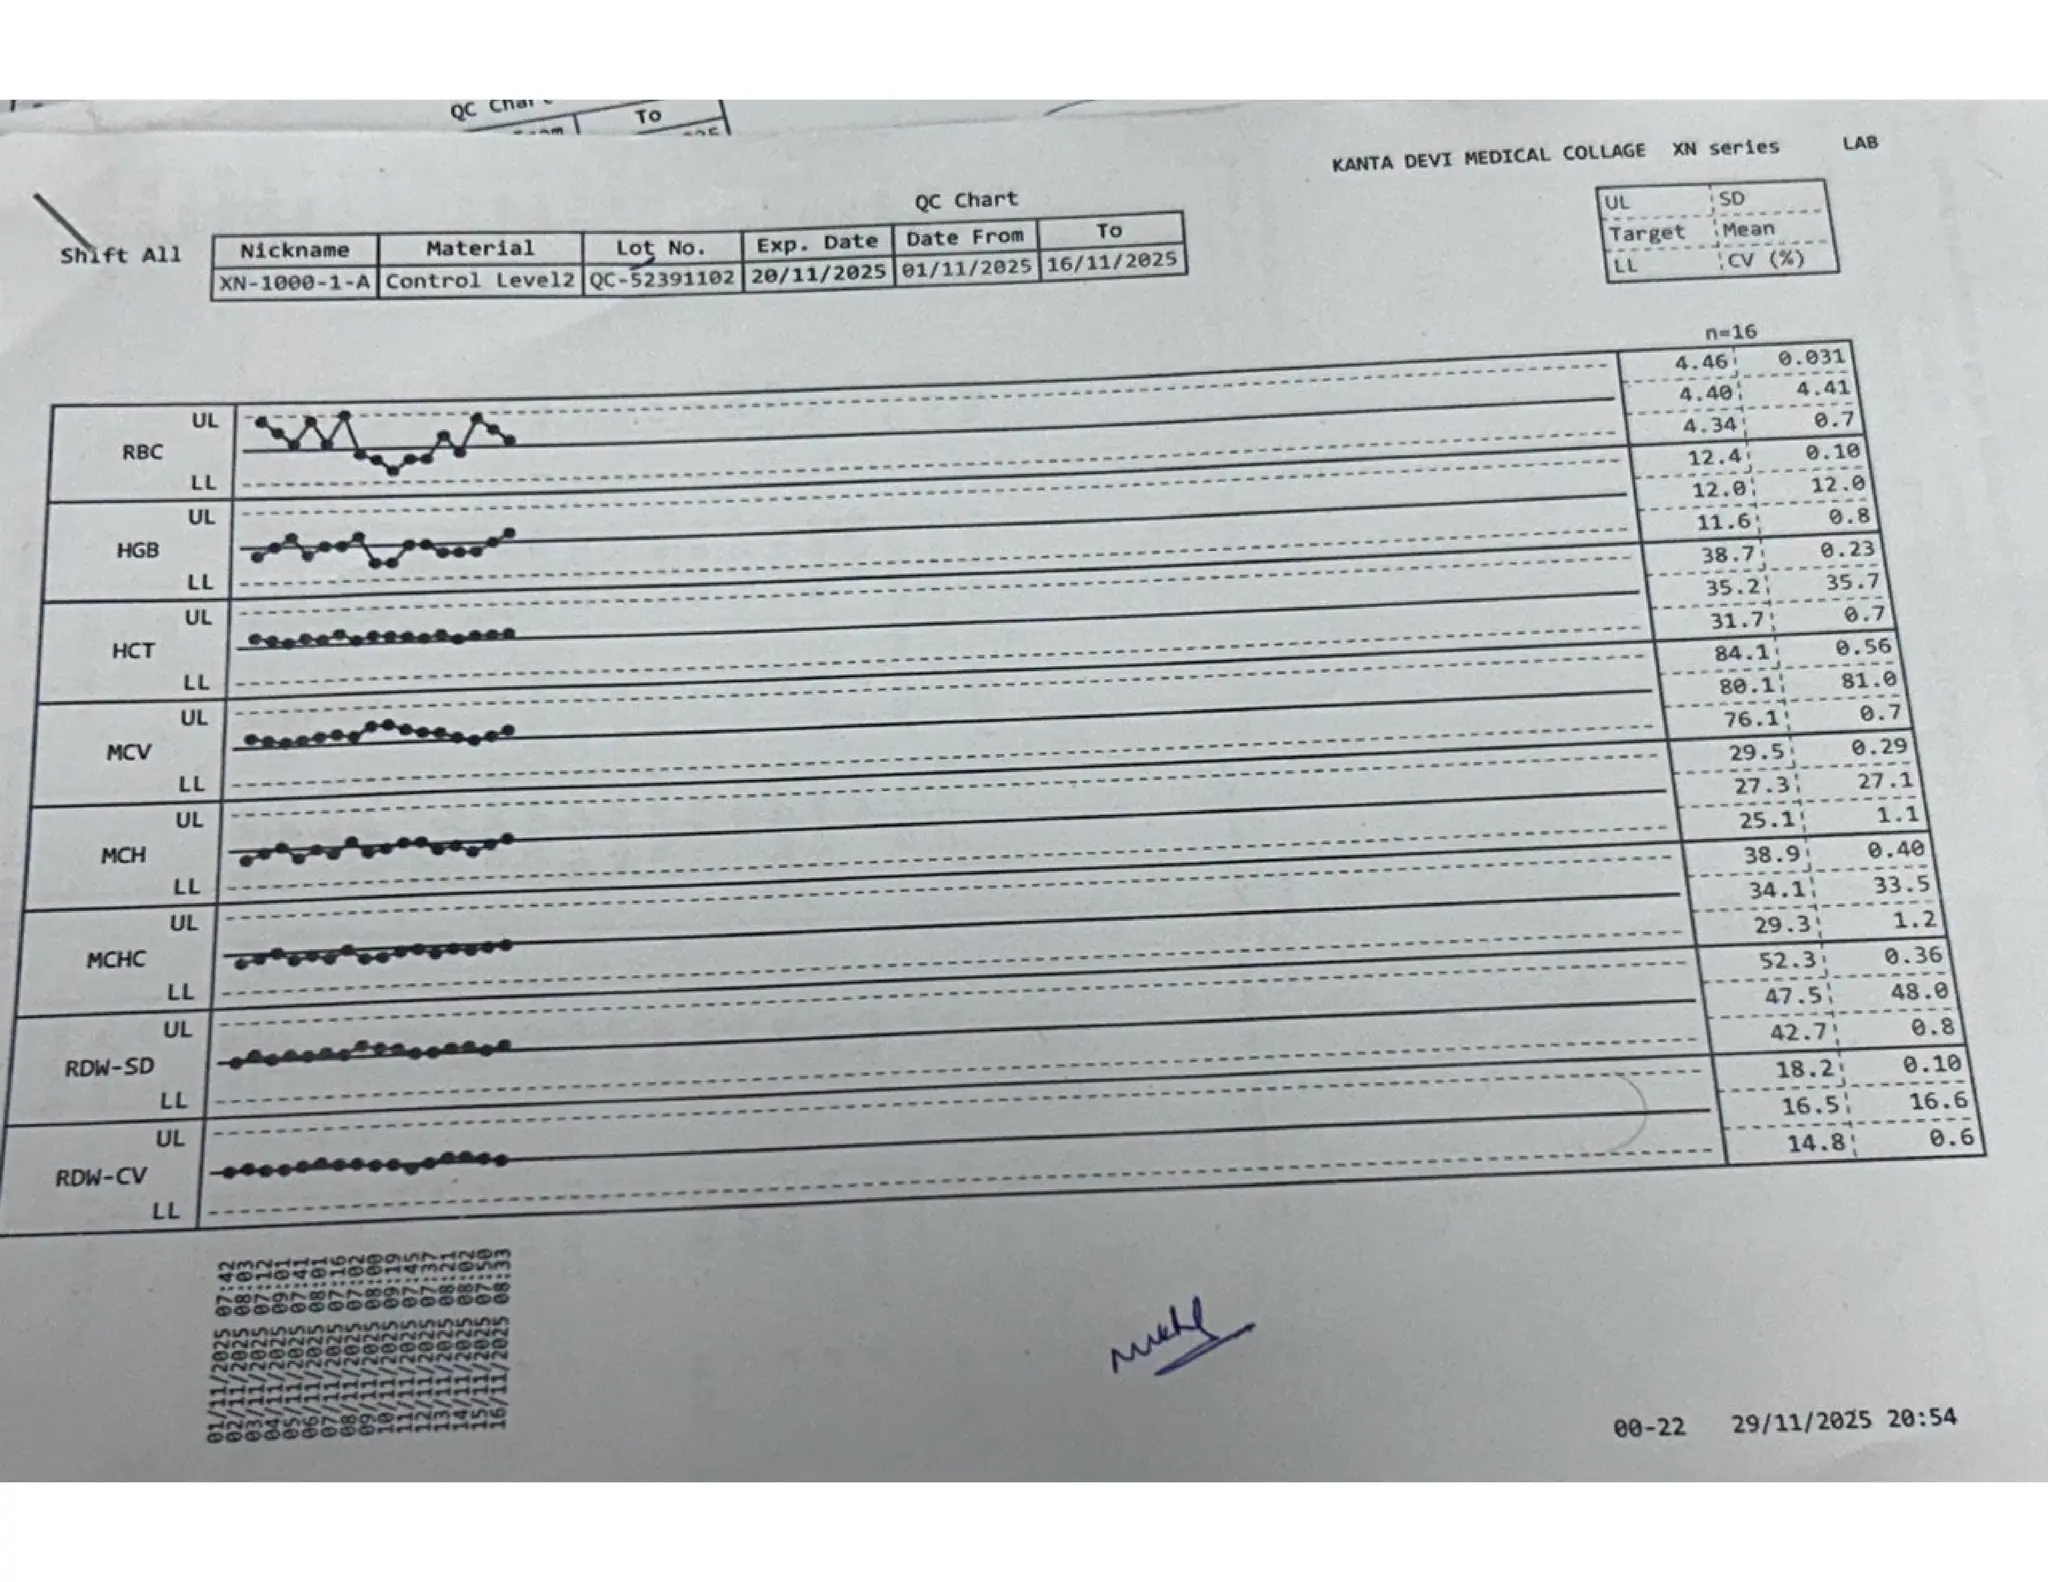
Levey-Jennings CHART
• Agraphical method for displaying control results
and evaluating whether a procedure is in-control
or out-of-control
• It is named after S.LEVEY & E.R.JENNINGS
in 1950.
22.
• Control valuesare plotted versus time
• Lines are drawn from point to point accent, any
trends, shifts or random excursions
Monitoring QC data
•Use Levey-Jennings Chart
• Plot control values each run, make decision
regarding acceptability of run
• Monitor overtime to evaluate the precision and
accuracy of repeated measurements
• Review charts at defined intervals, take
necessary action, and document
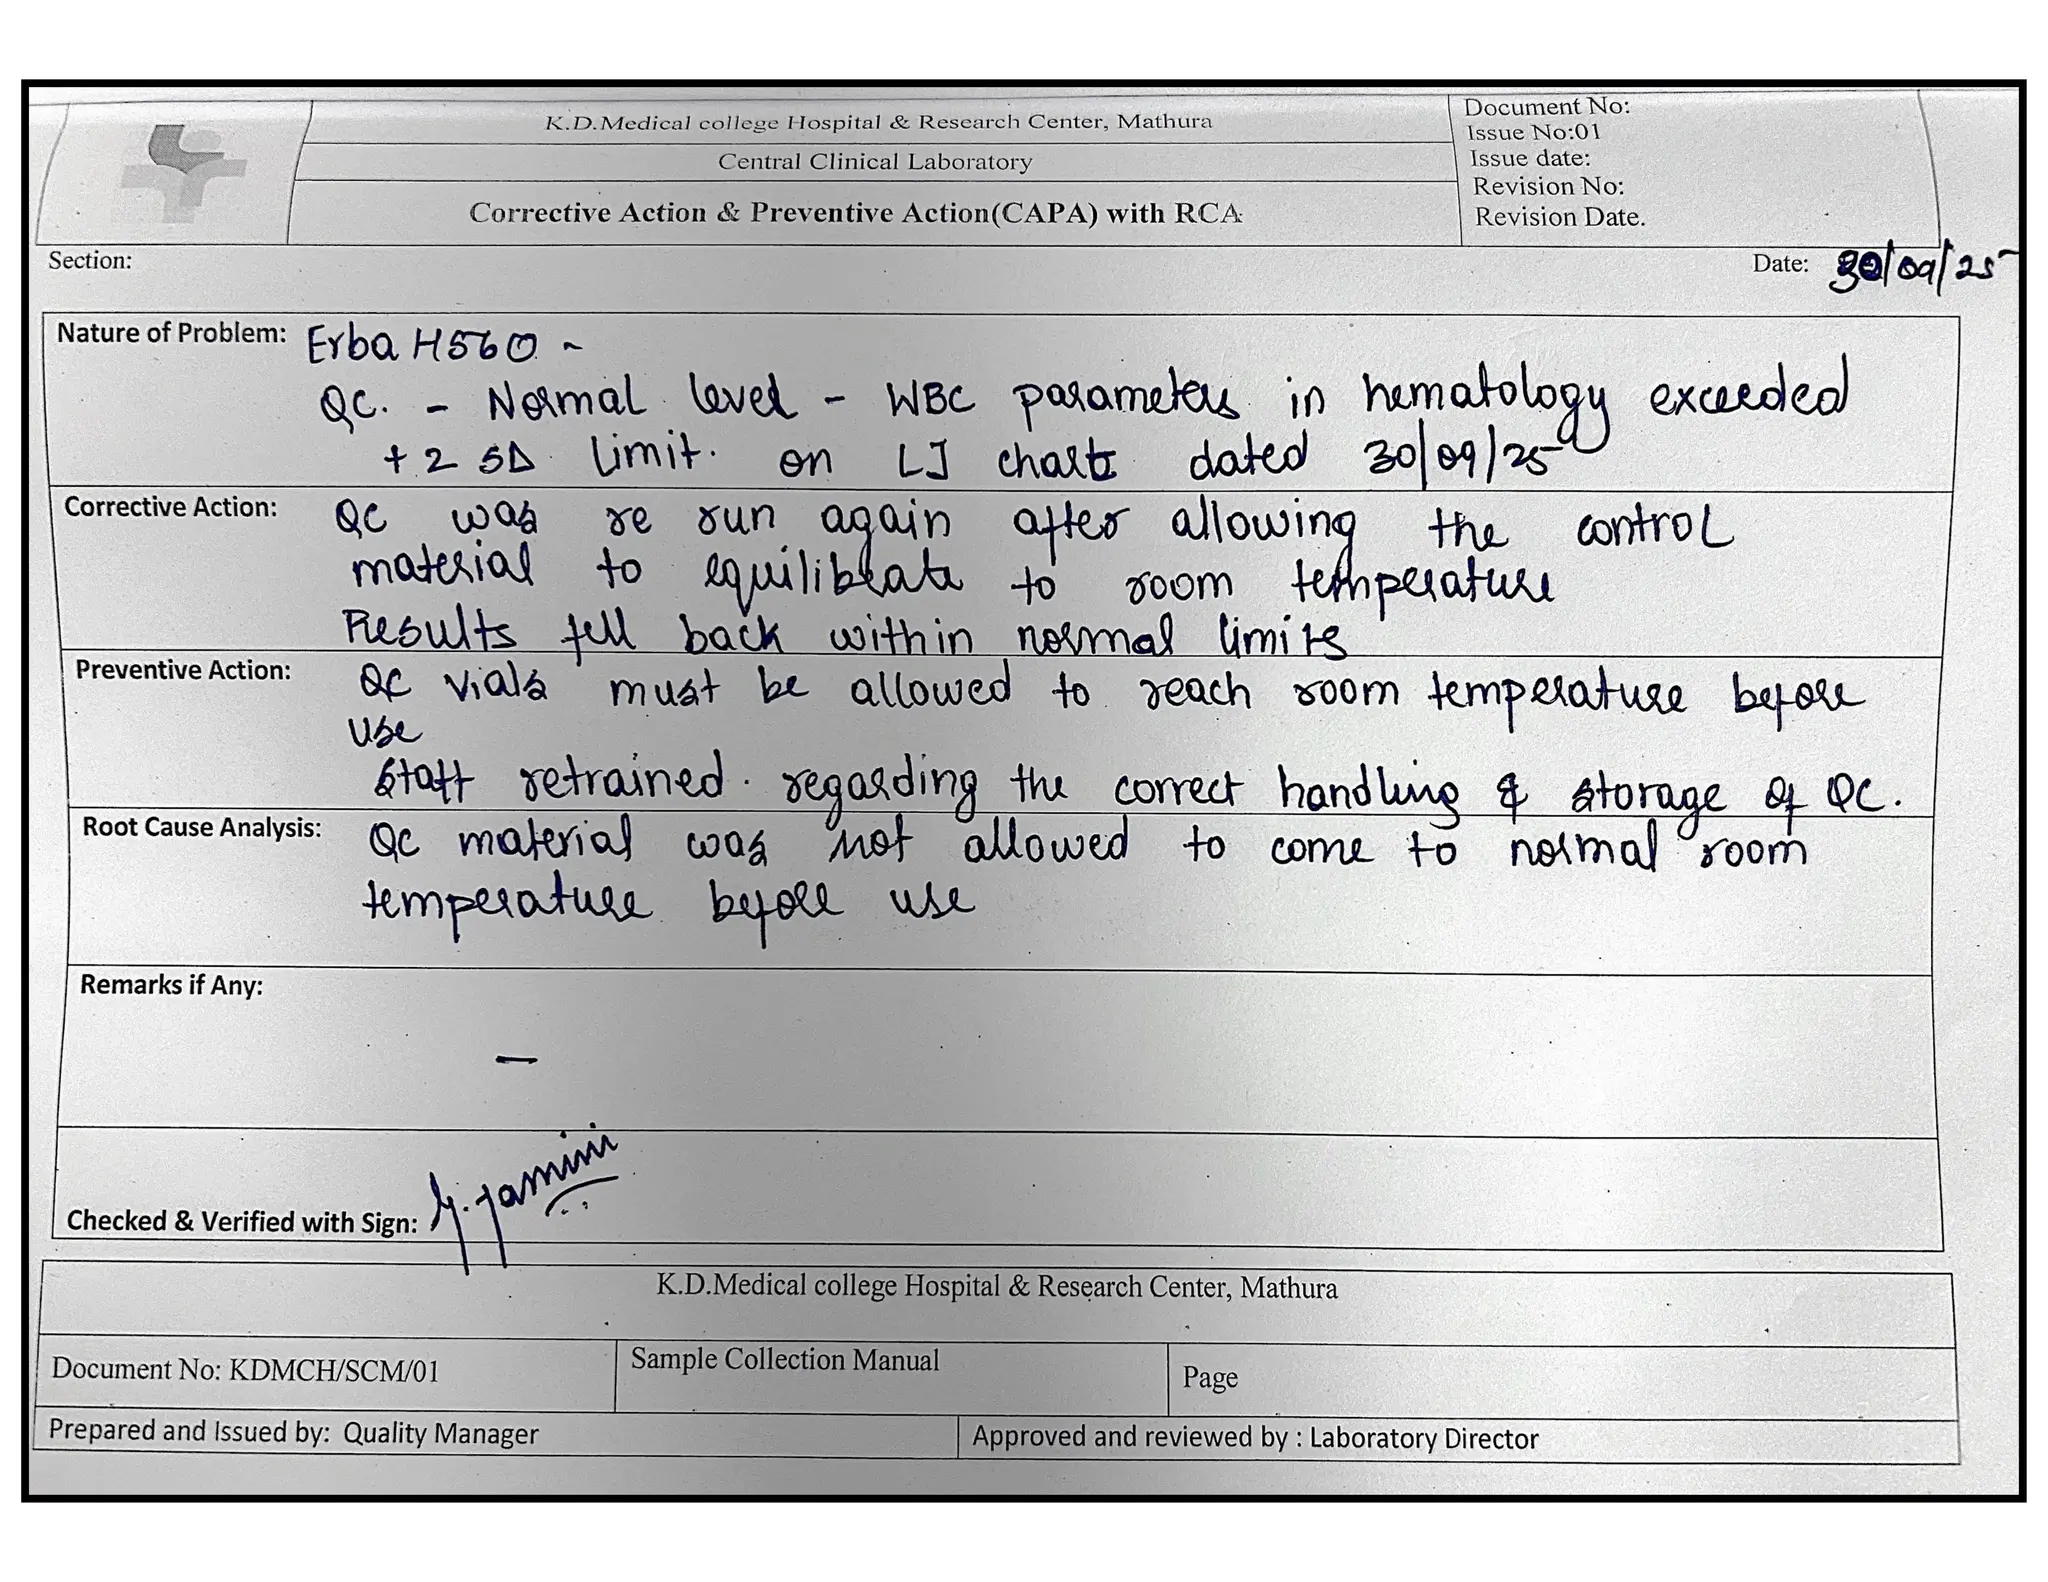
26.
INTERNAL QUALITY CONTROL
•Use of standard reagents & known control
sample
• Well trained staff
• The batch result are accepted if the values
of control sera are within 2 SD.
27.
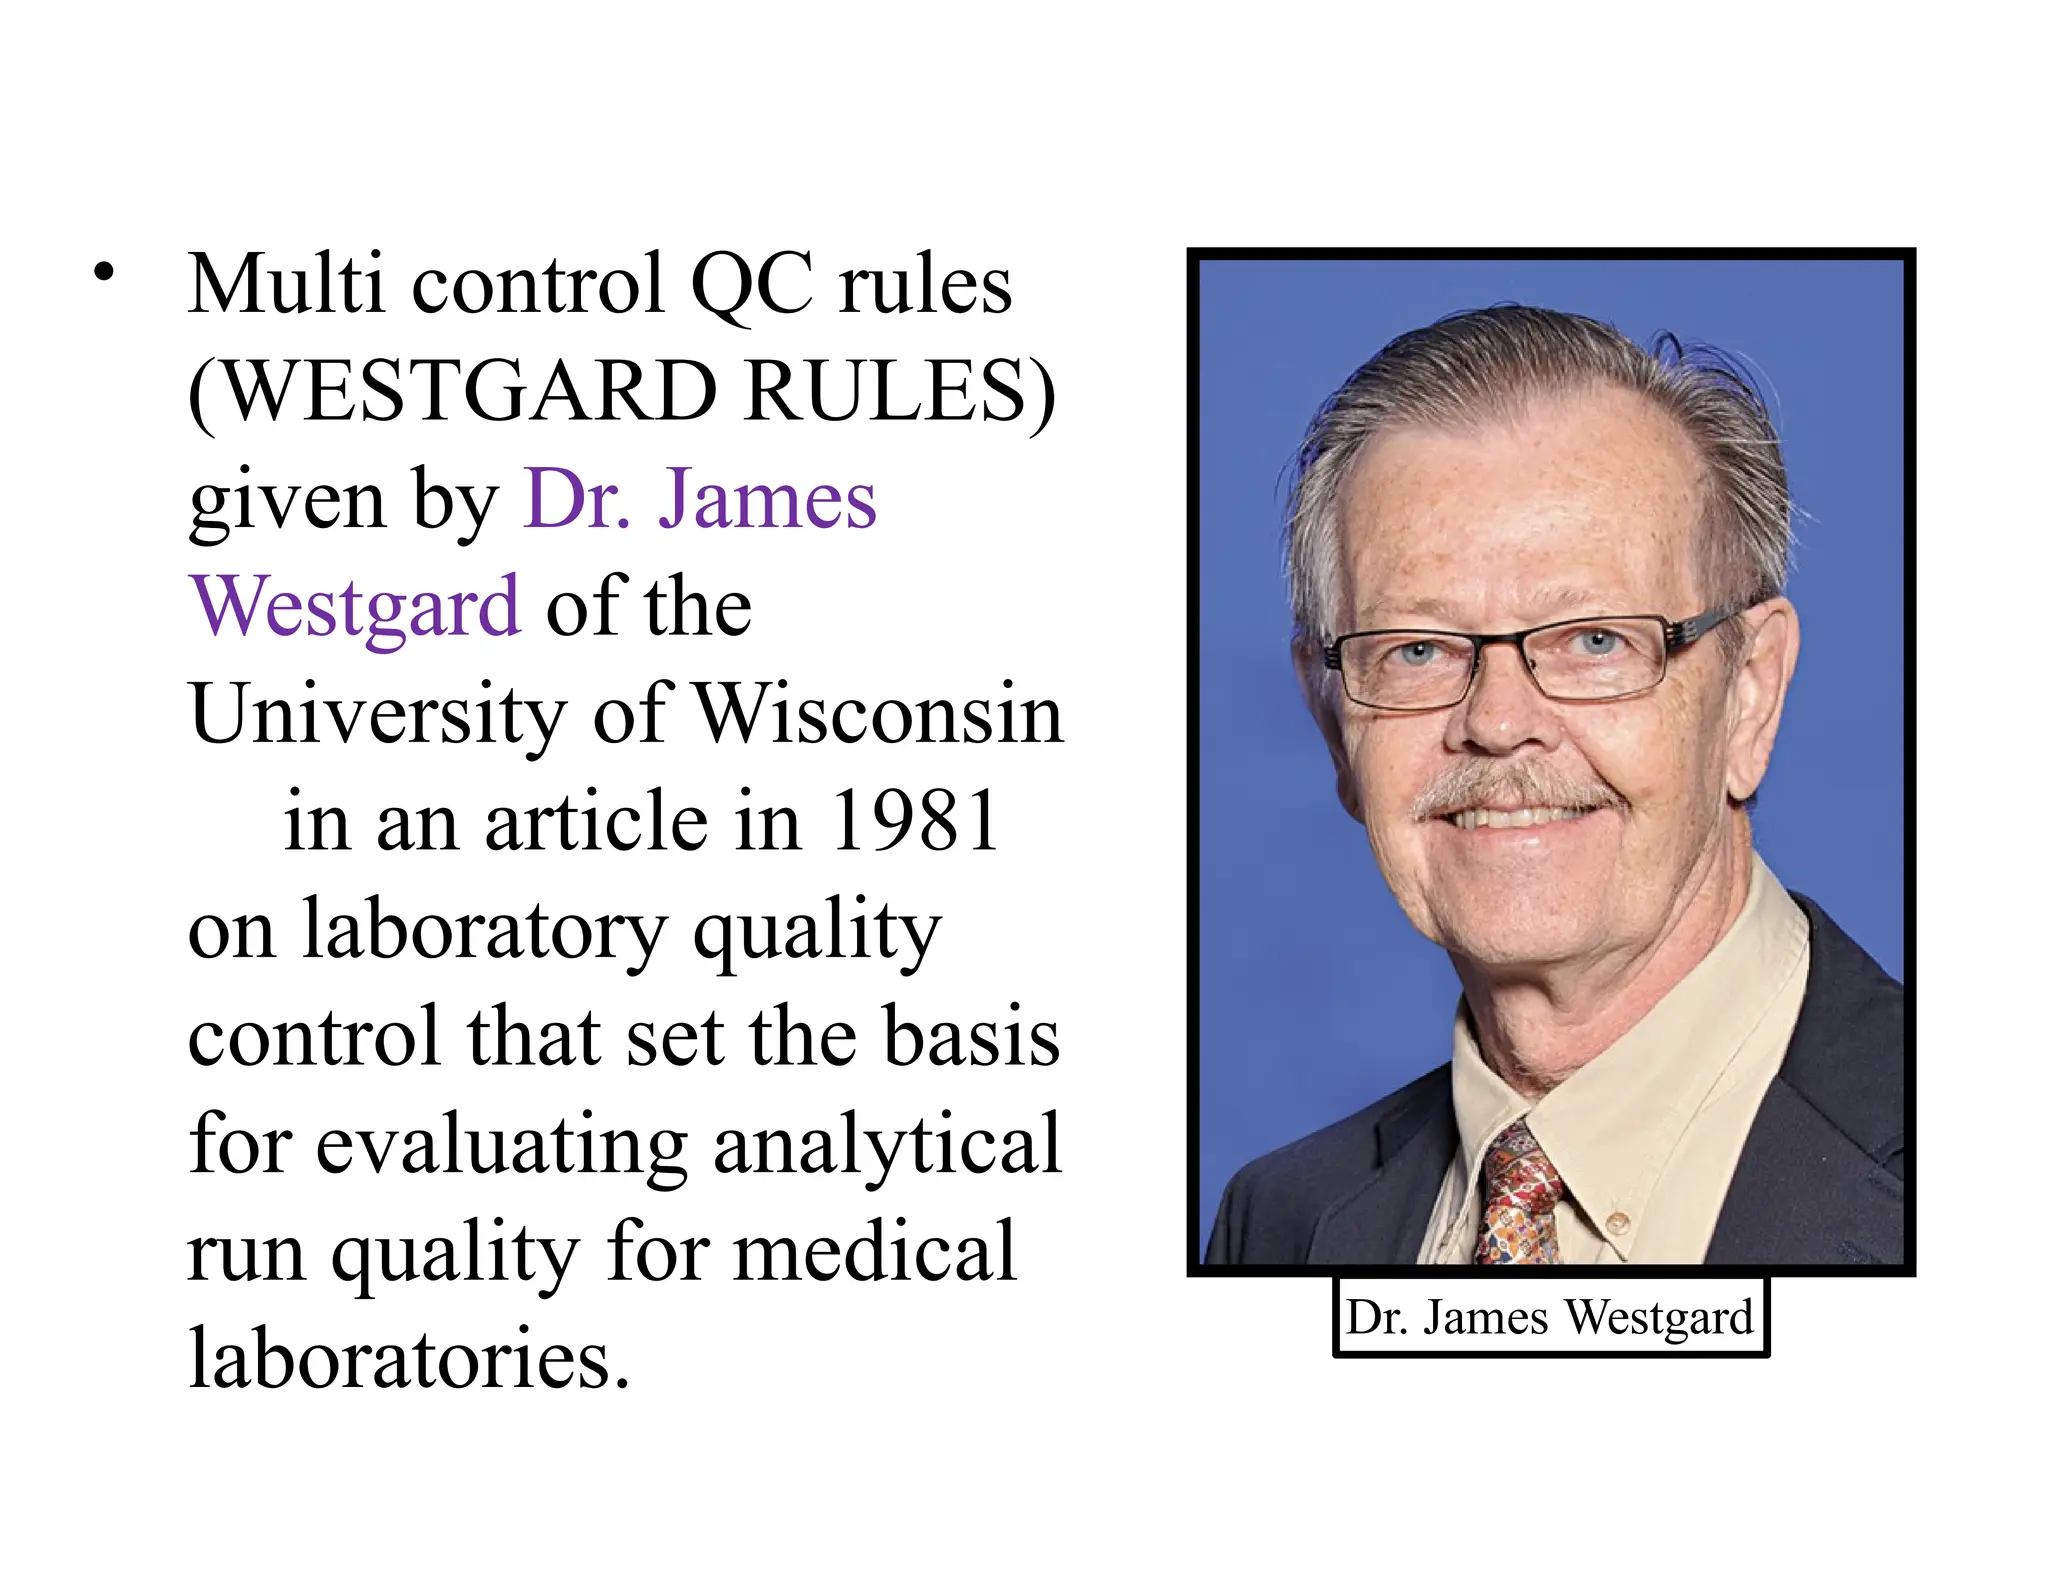
• Multi controlQC rules
(WESTGARD RULES)
given by Dr. James
Westgard of the
University of Wisconsin
in an article in 1981
on laboratory quality
control that set the basis
for evaluating analytical
run quality for medical
laboratories.
Dr. James Westgard
28.
• The Westgardsystem -based on the principles
of statistical process control used in
manufacturing nationwide since the 1950s
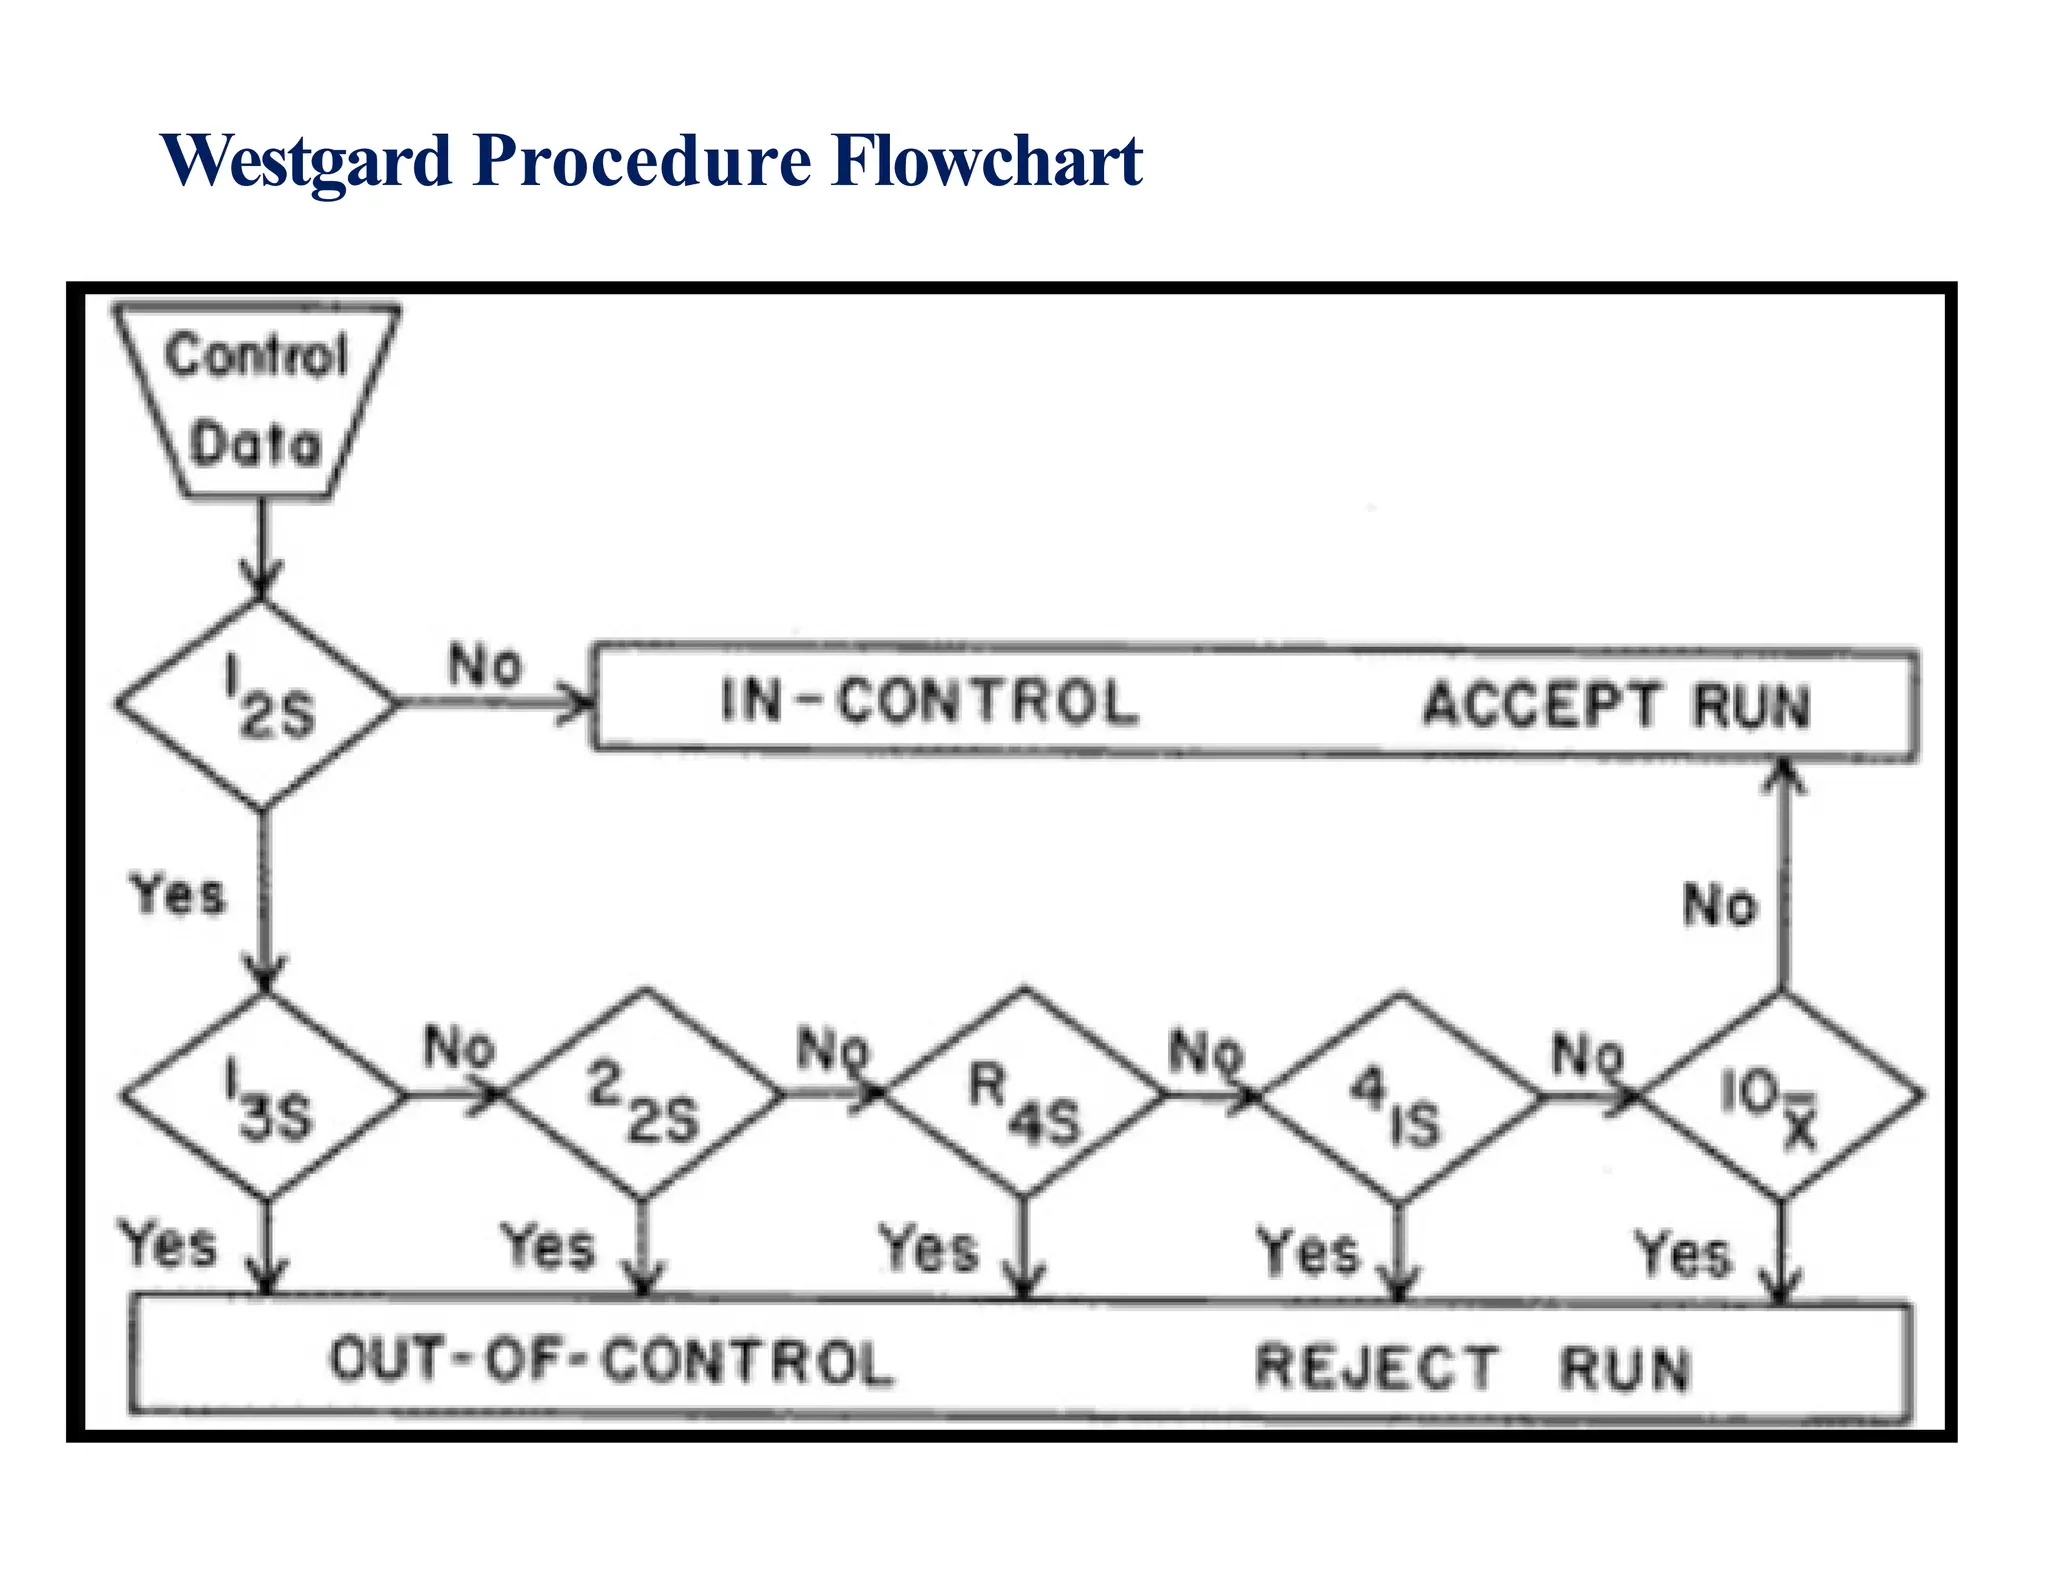
• Six basic rules in the Westgard scheme: 1-3s,
2- 2s, R-4s, 1-2s, 4-1s, and 10x. These rules
are used individually or in combination (multi-
rule) to evaluate the quality of analytical runs.
• Detect random or systematic errors
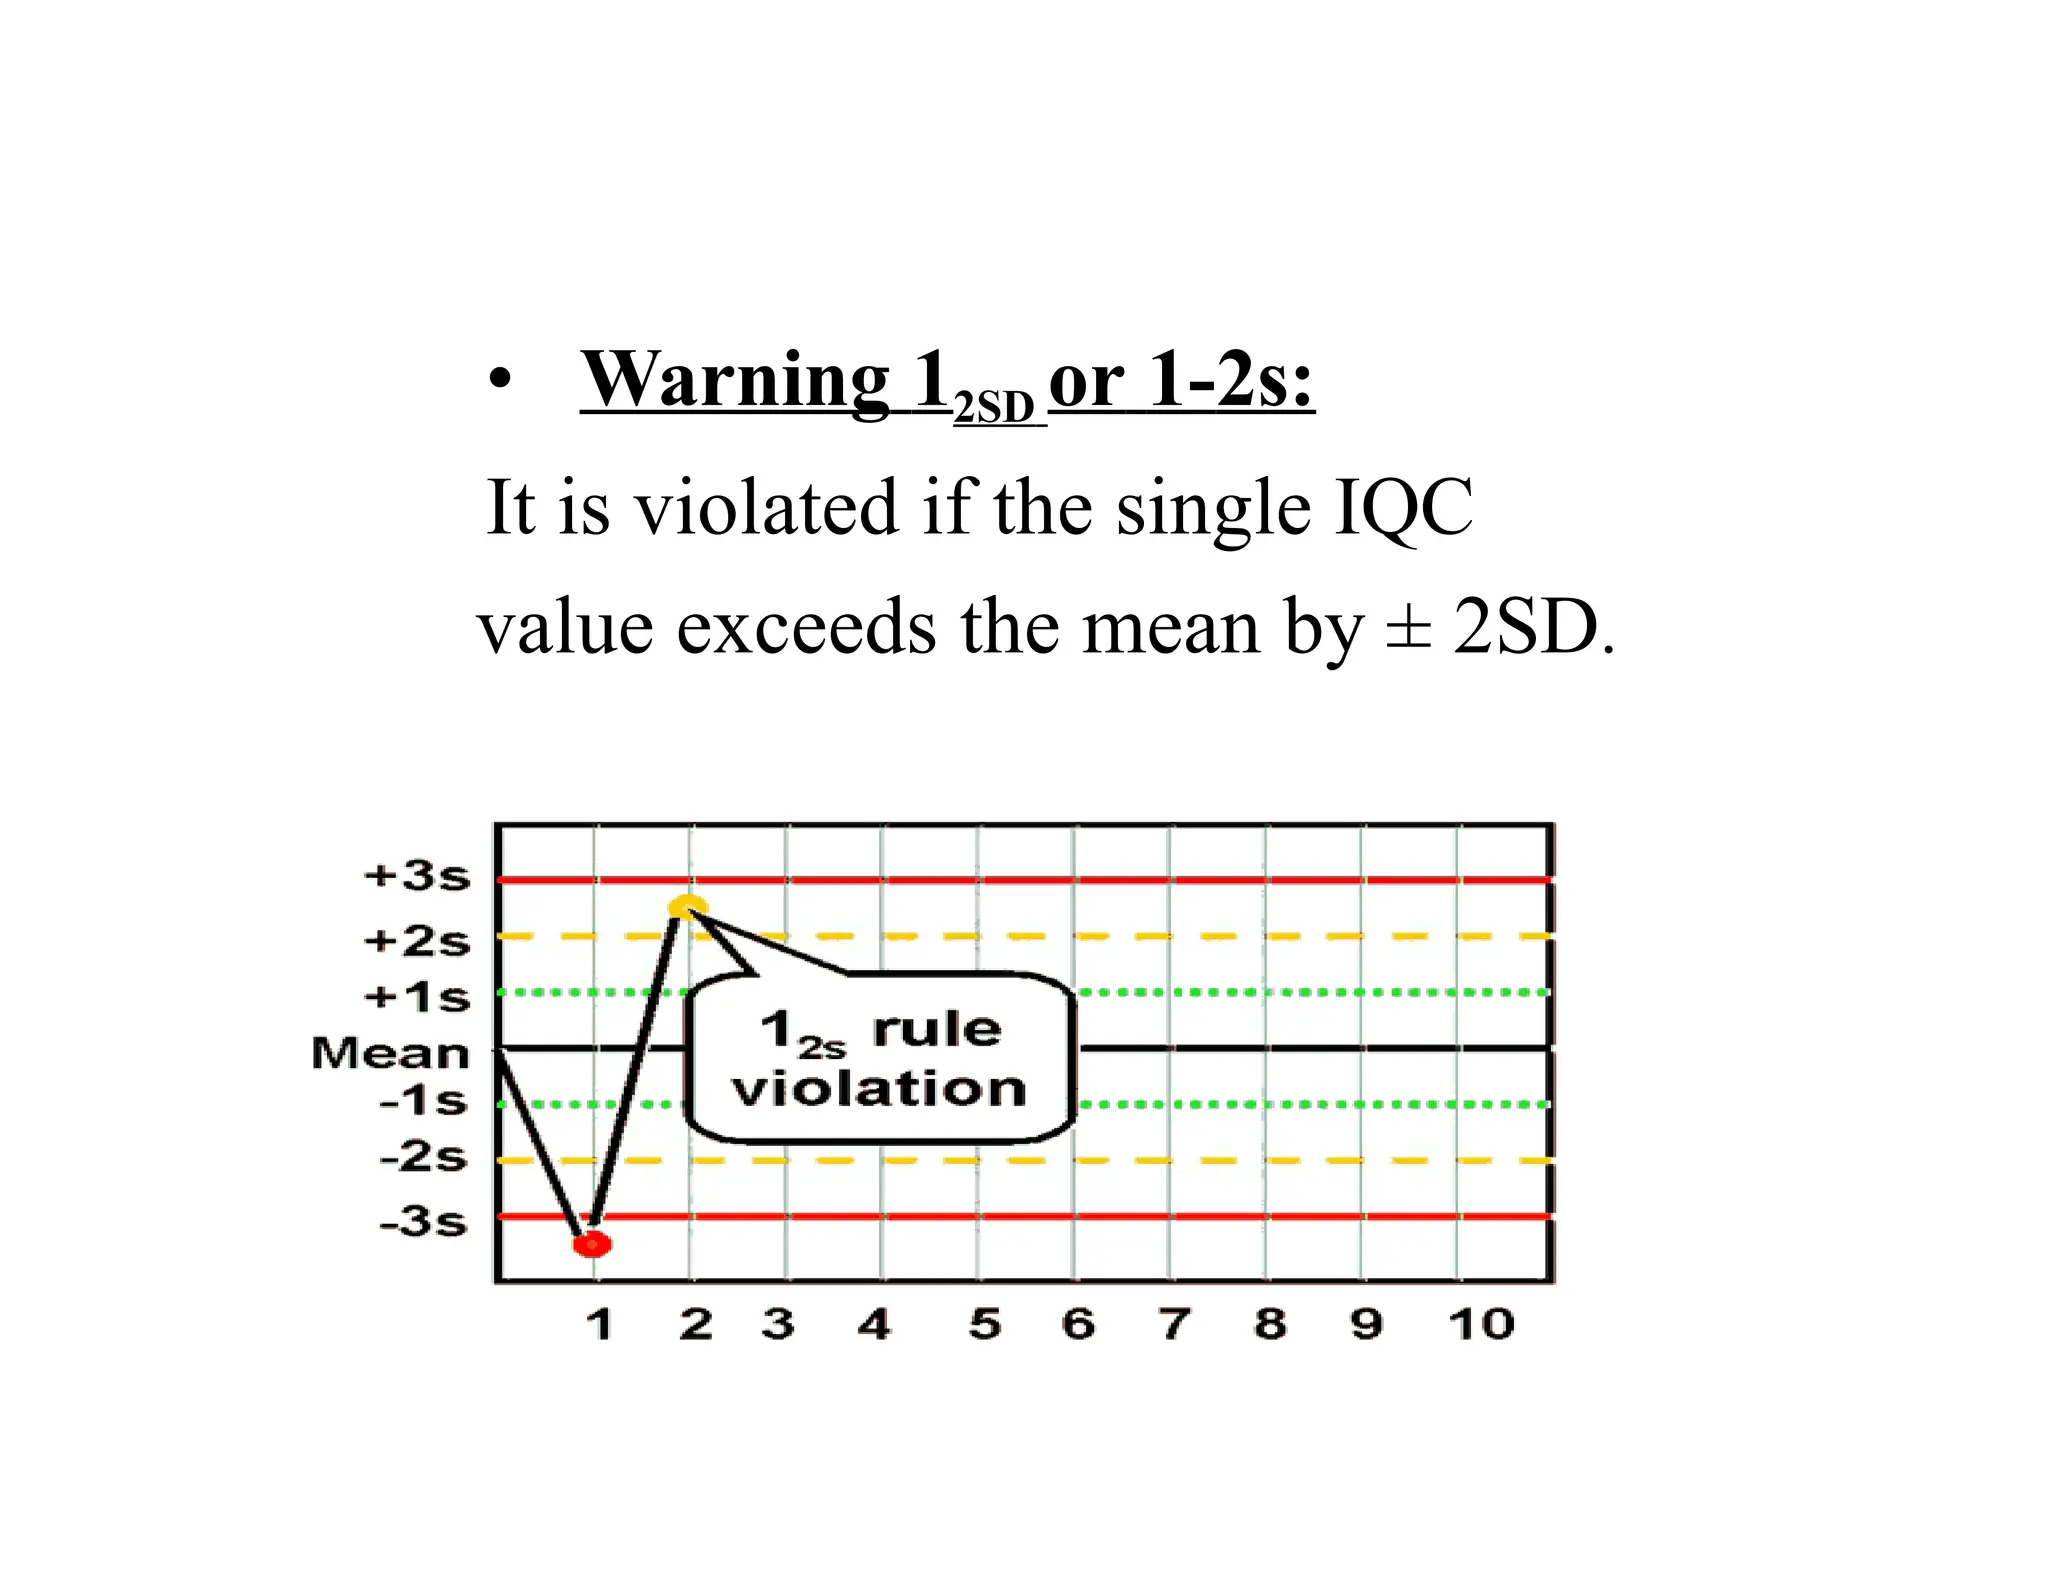
• Warning 12SDor 1-2s:
It is violated if the single IQC
value exceeds the mean by ± 2SD.
31.
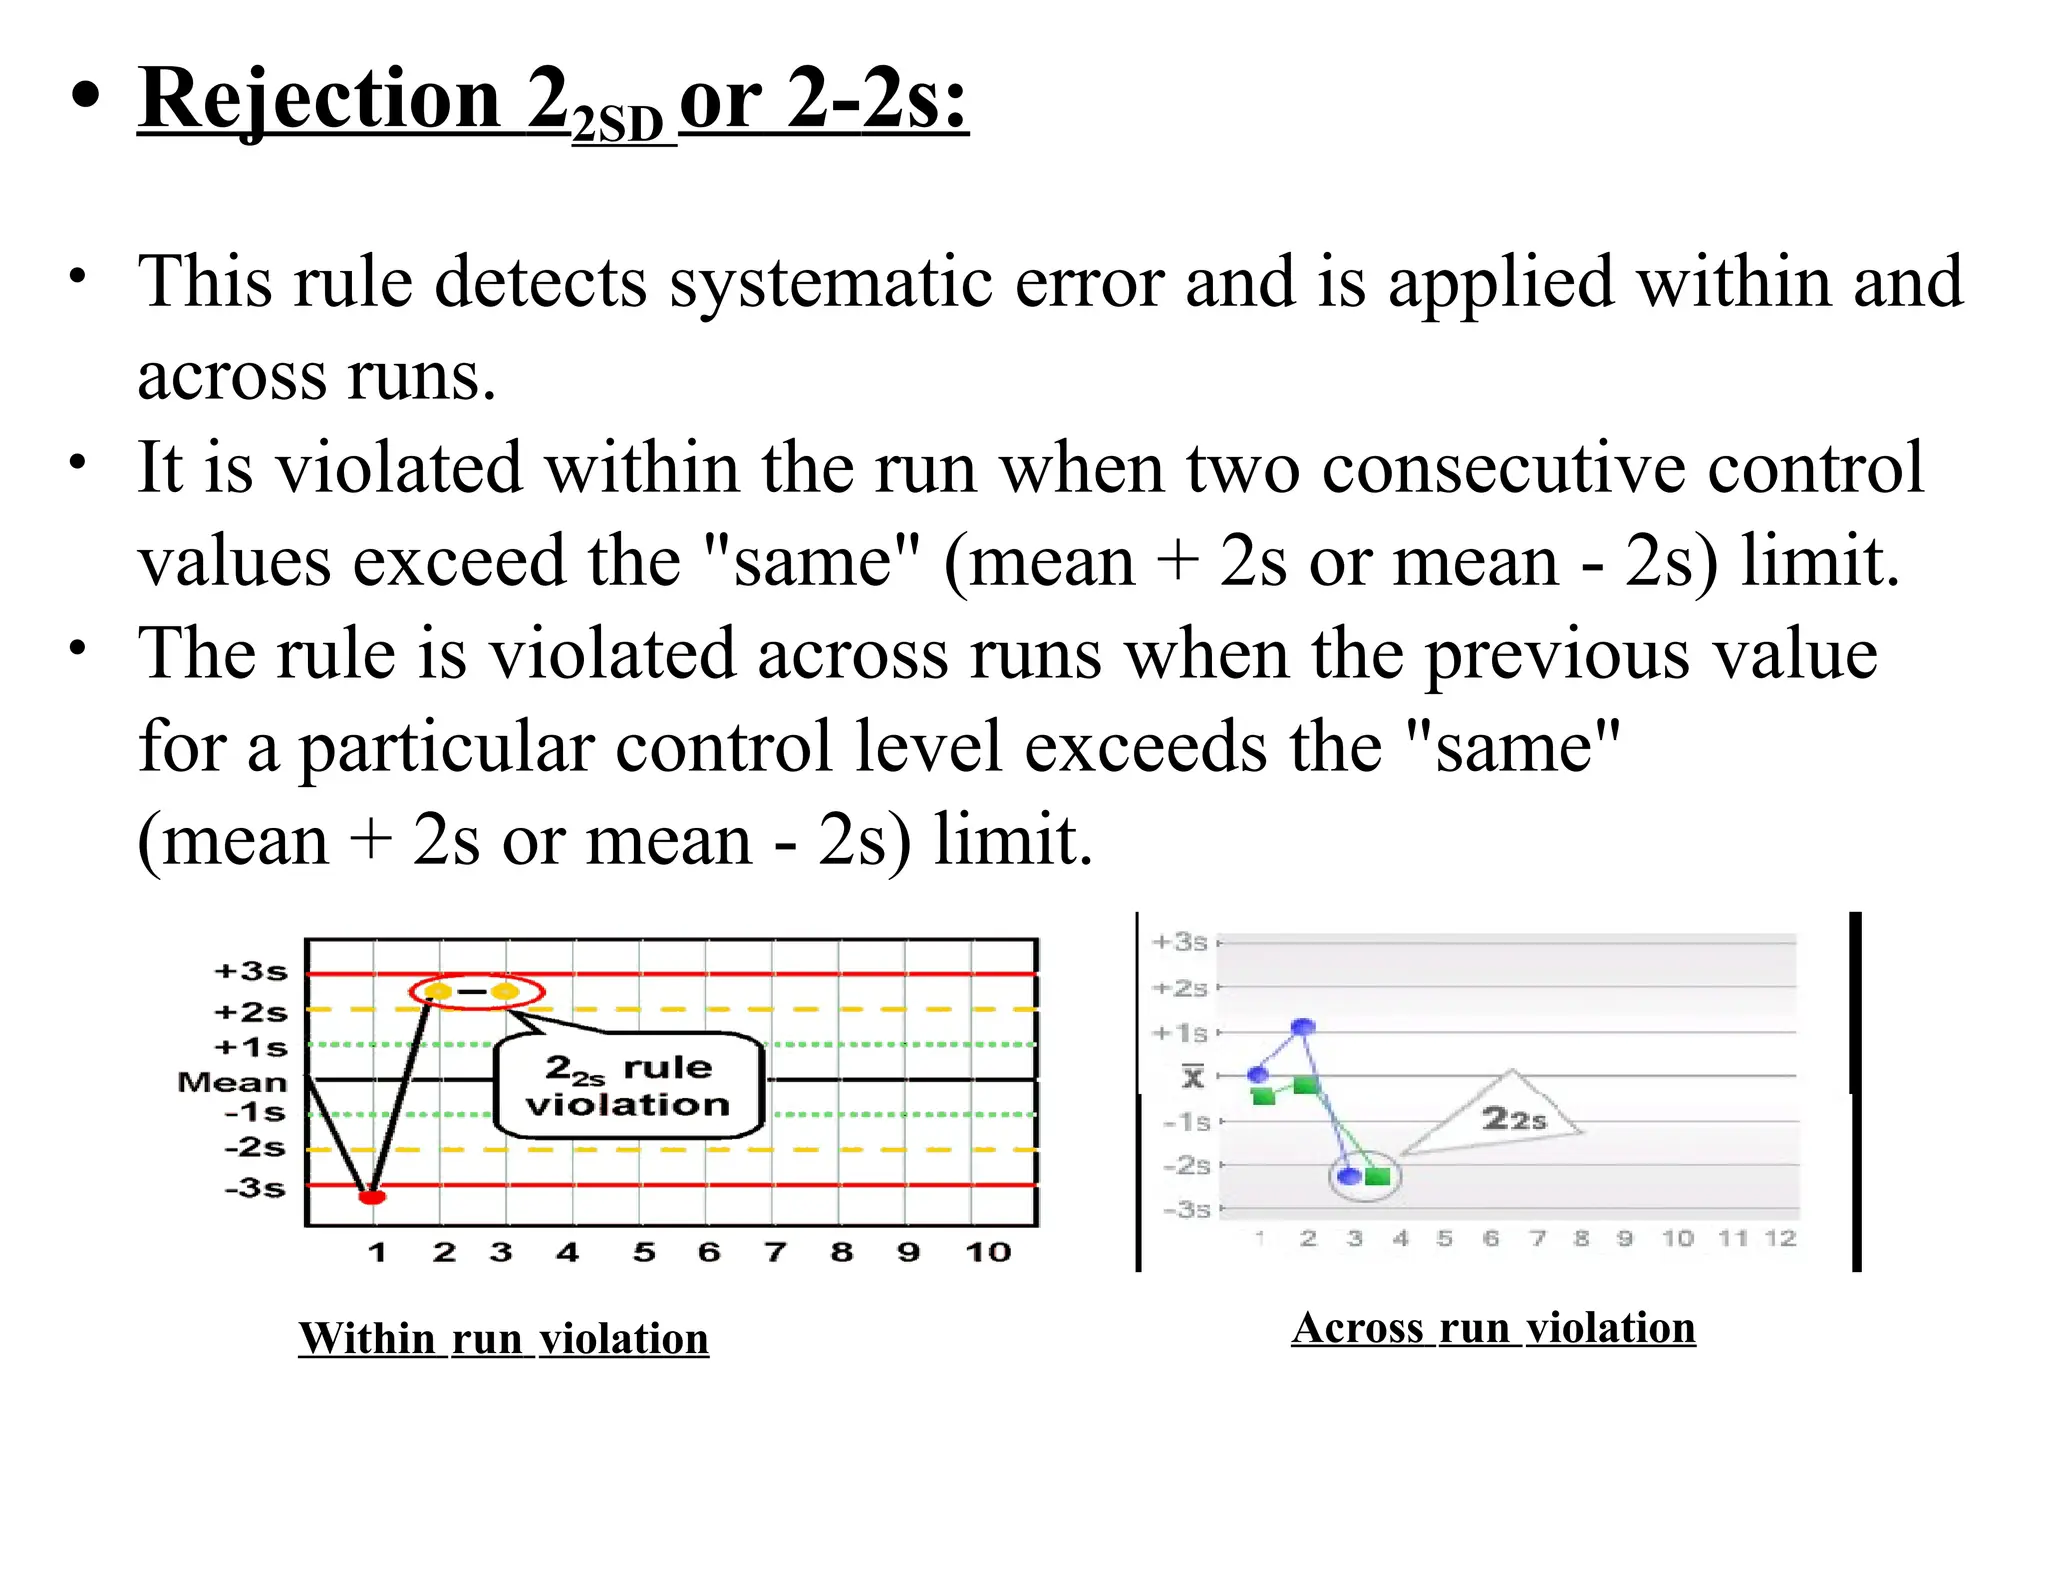
• Rejection 22SDor 2-2s:
• This rule detects systematic error and is applied within and
across runs.
• It is violated within the run when two consecutive control
values exceed the "same" (mean + 2s or mean - 2s) limit.
• The rule is violated across runs when the previous value
for a particular control level exceeds the "same"
(mean + 2s or mean - 2s) limit.
Within run violation Across run violation
32.
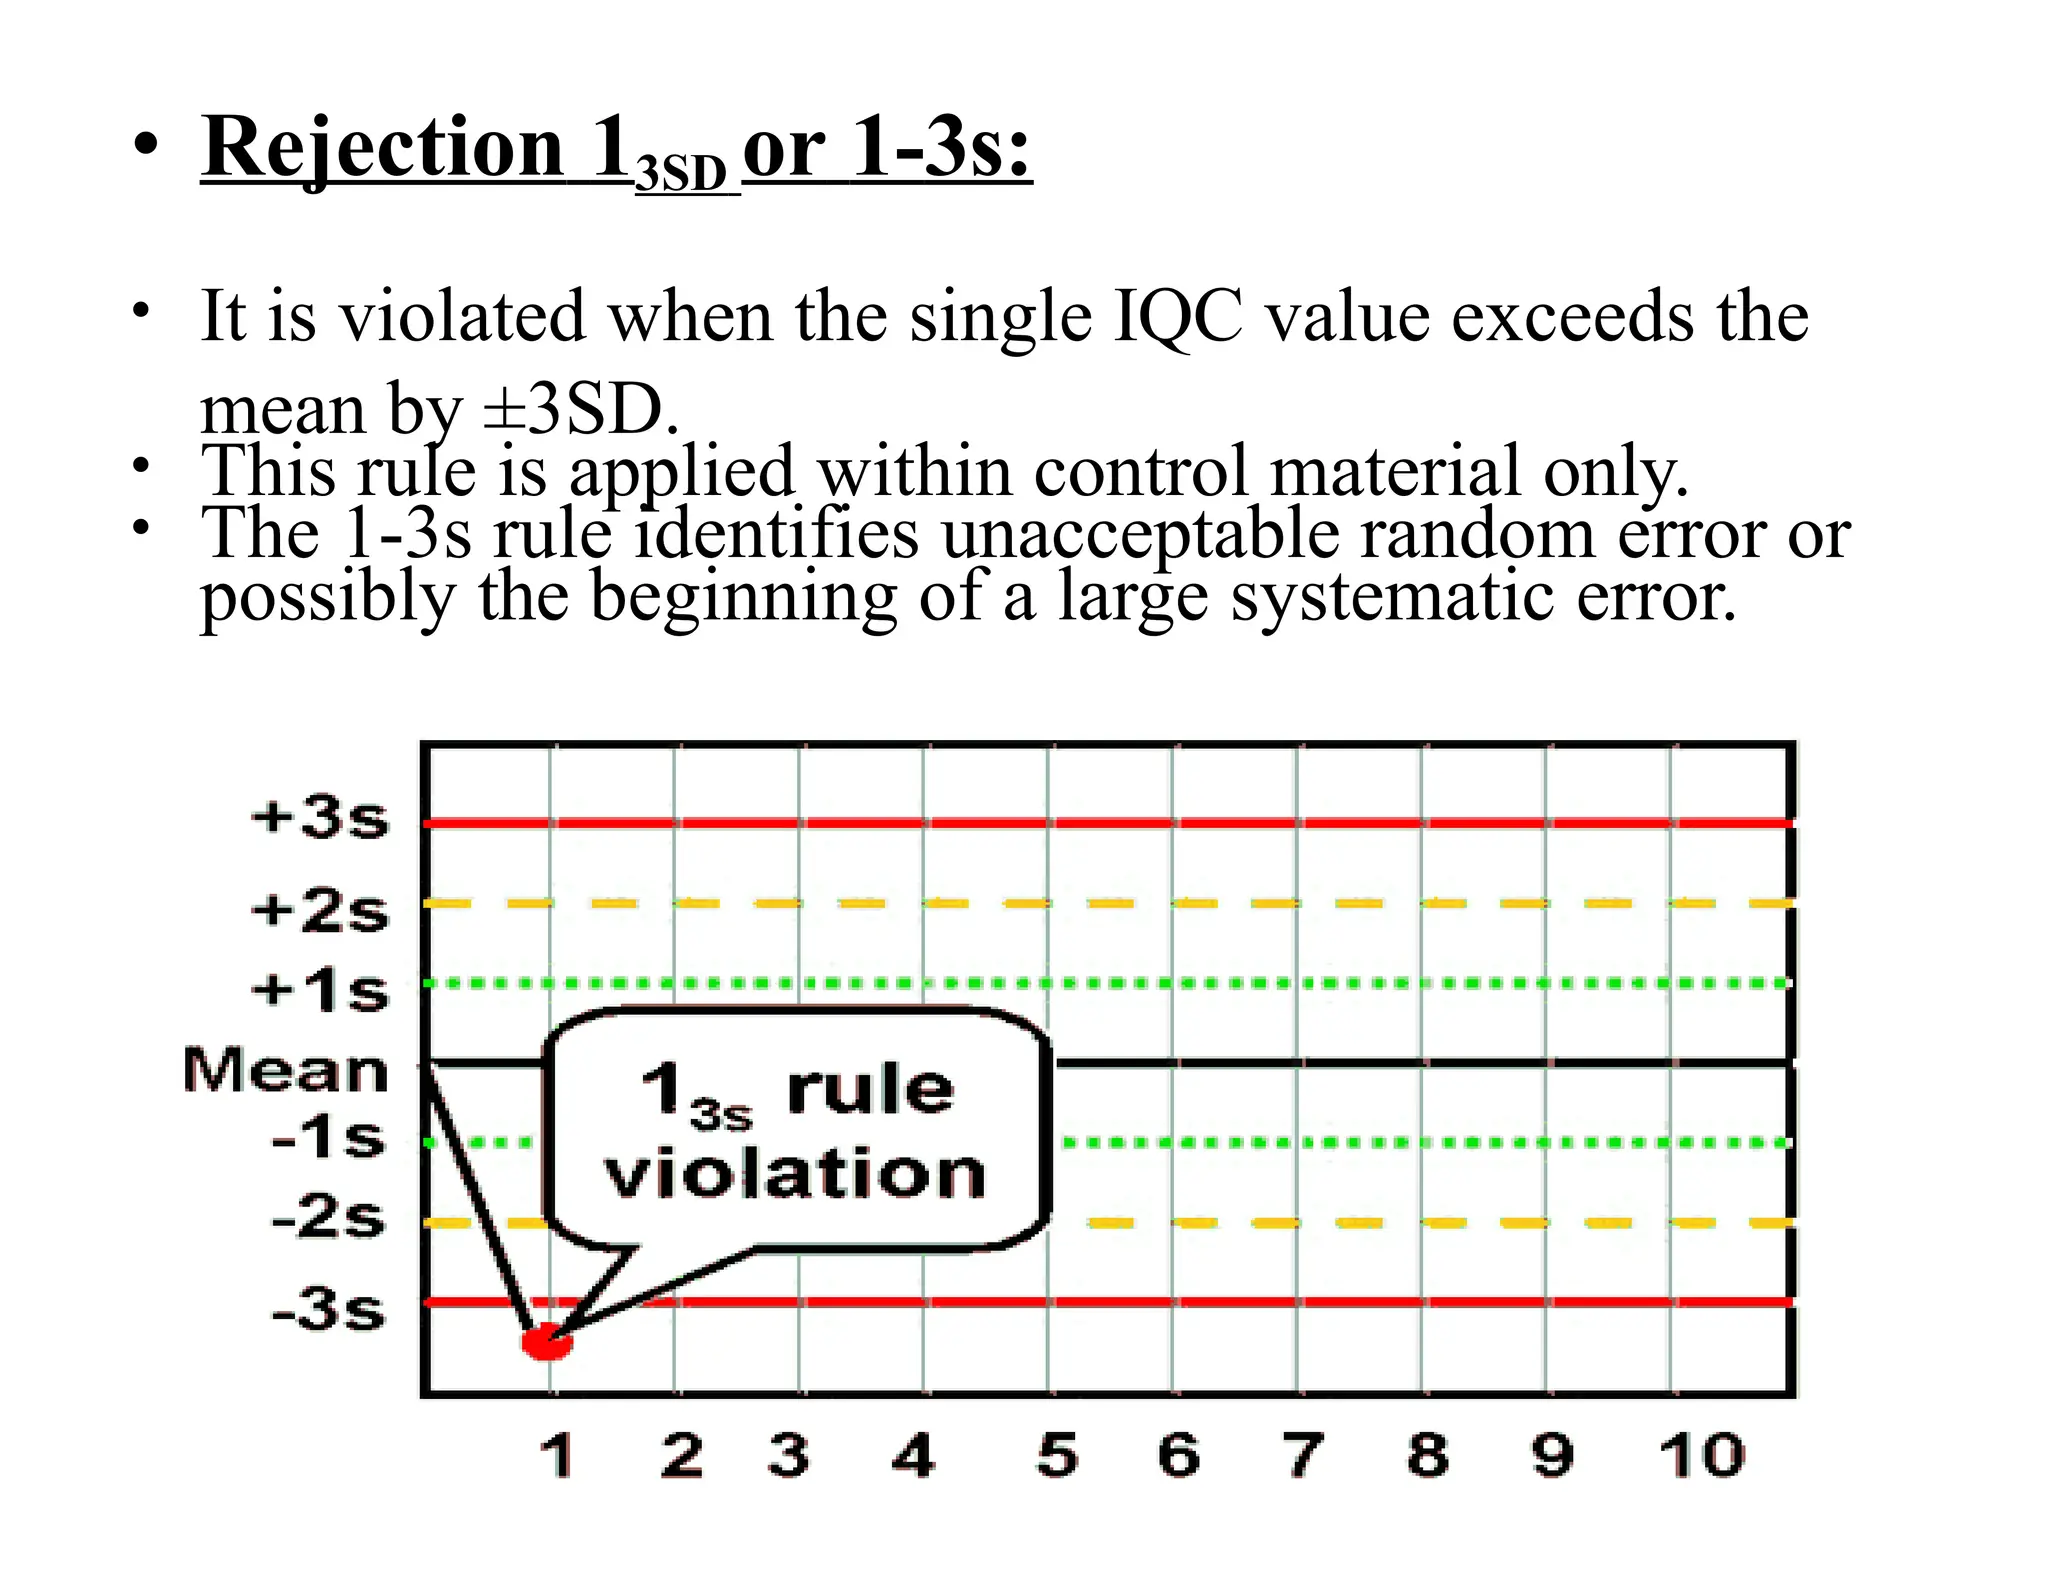
• Rejection 13SDor 1-3s:
• It is violated when the single IQC value exceeds the
mean by ±3SD.
• This rule is applied within control material only.
• The 1-3s rule identifies unacceptable random error or
possibly the beginning of a large systematic error.
33.
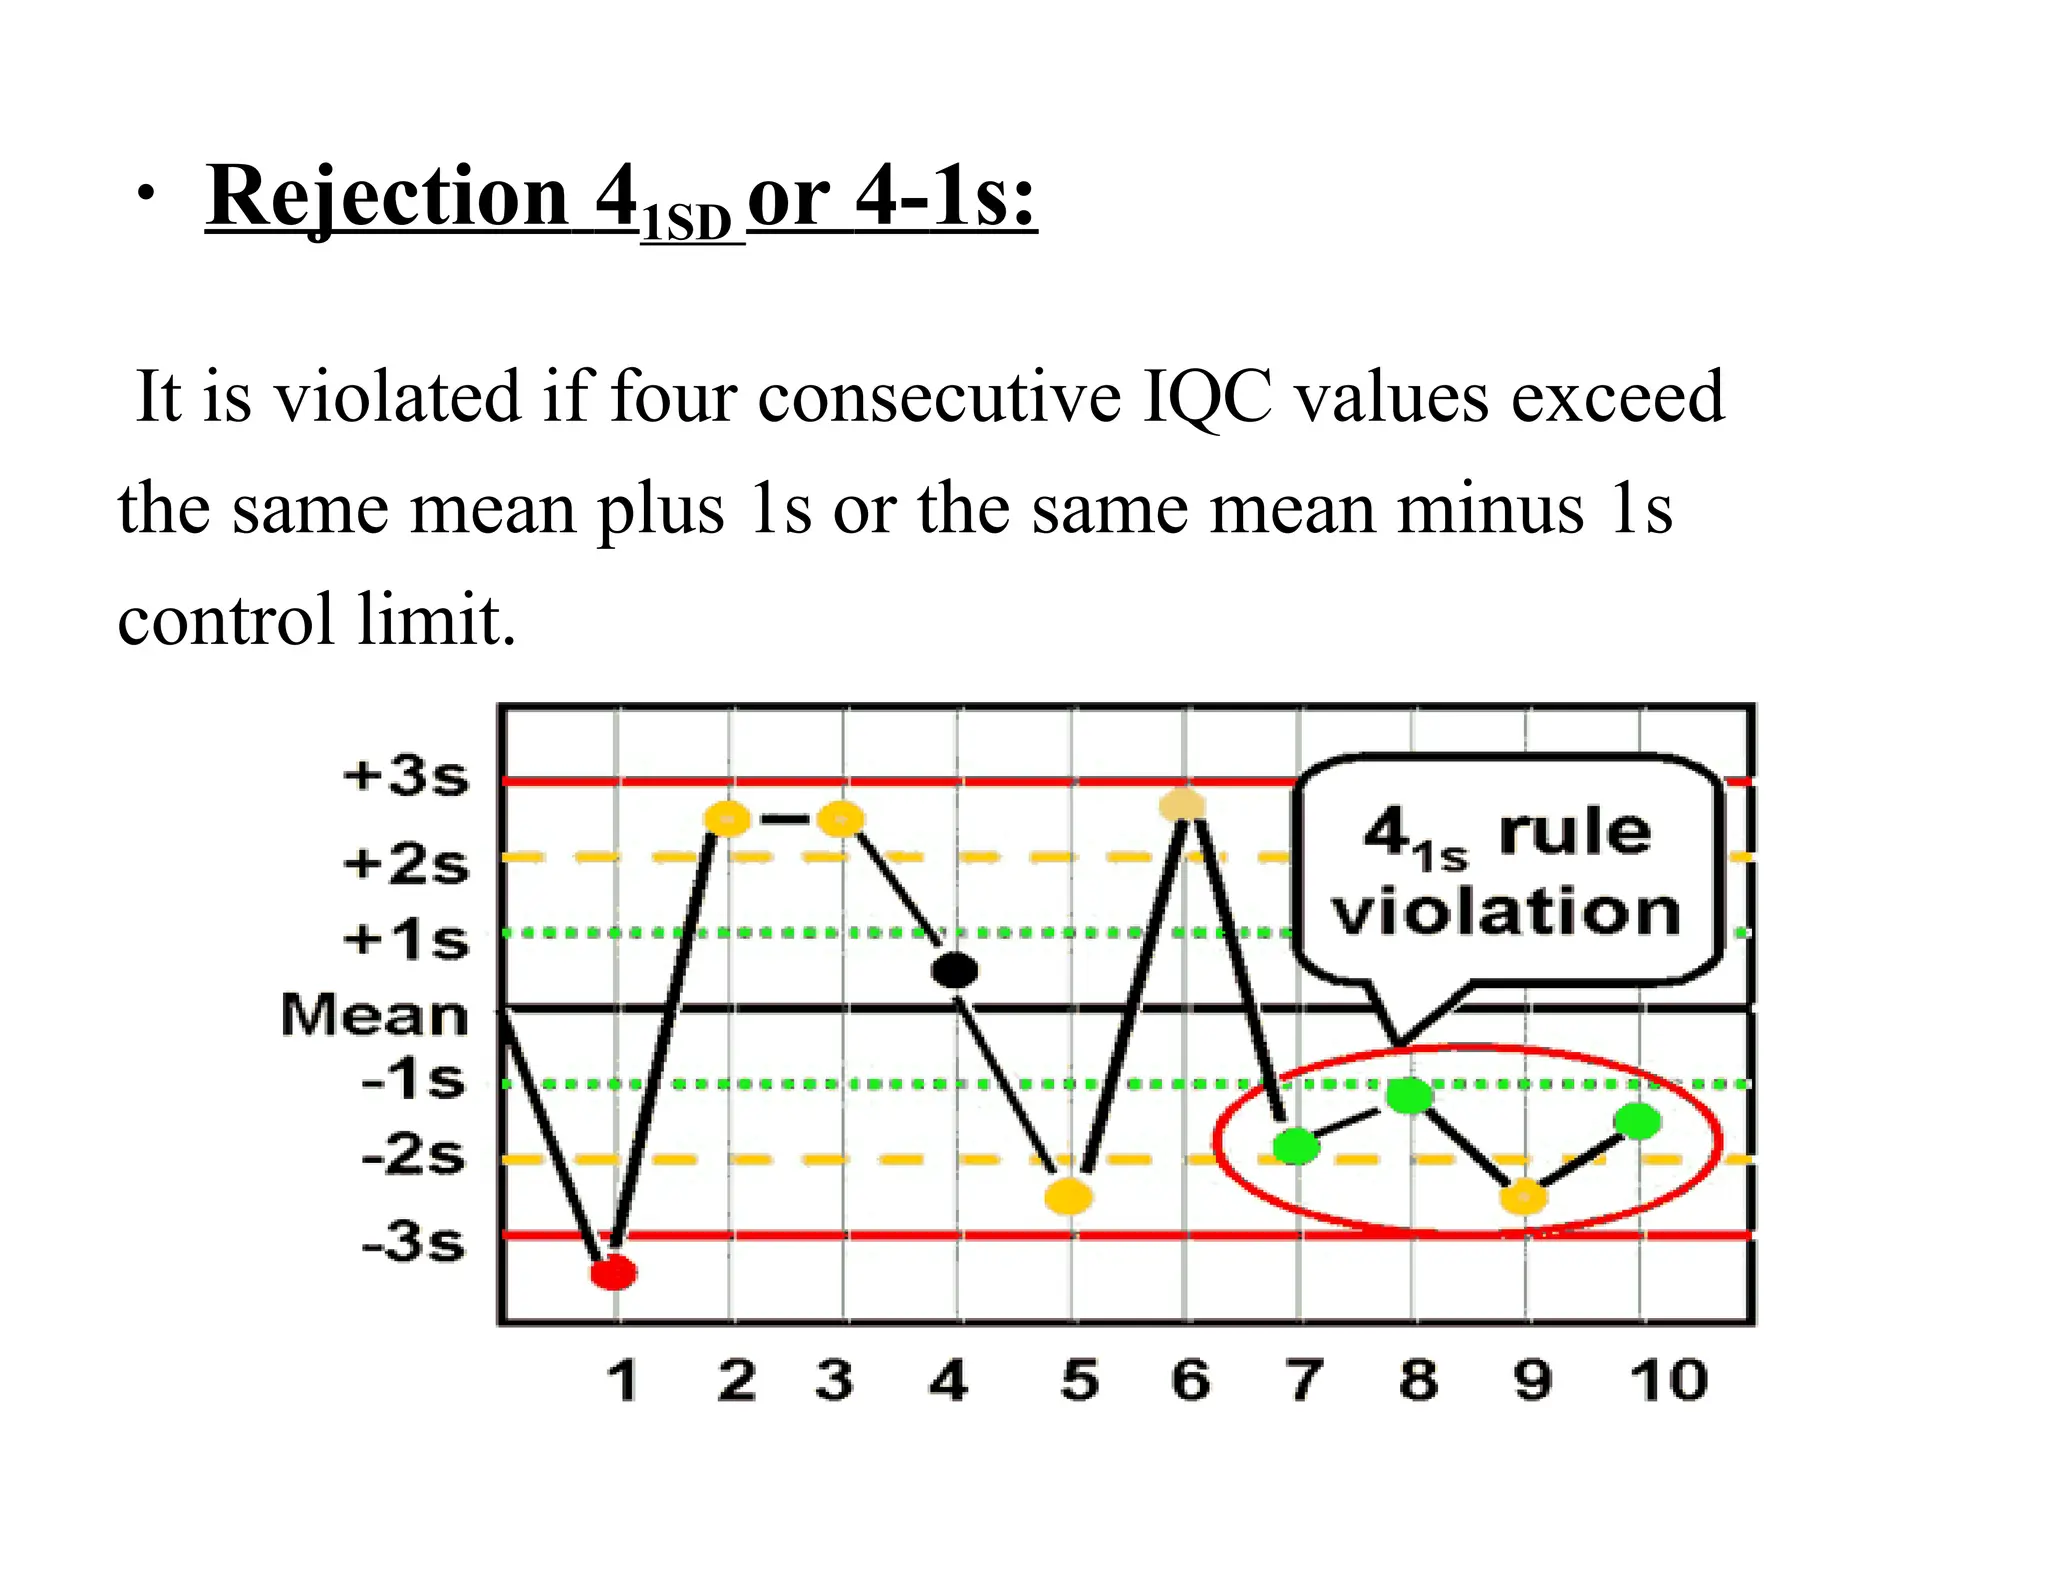
• Rejection 41SDor 4-1s:
It is violated if four consecutive IQC values exceed
the same mean plus 1s or the same mean minus 1s
control limit.
34.
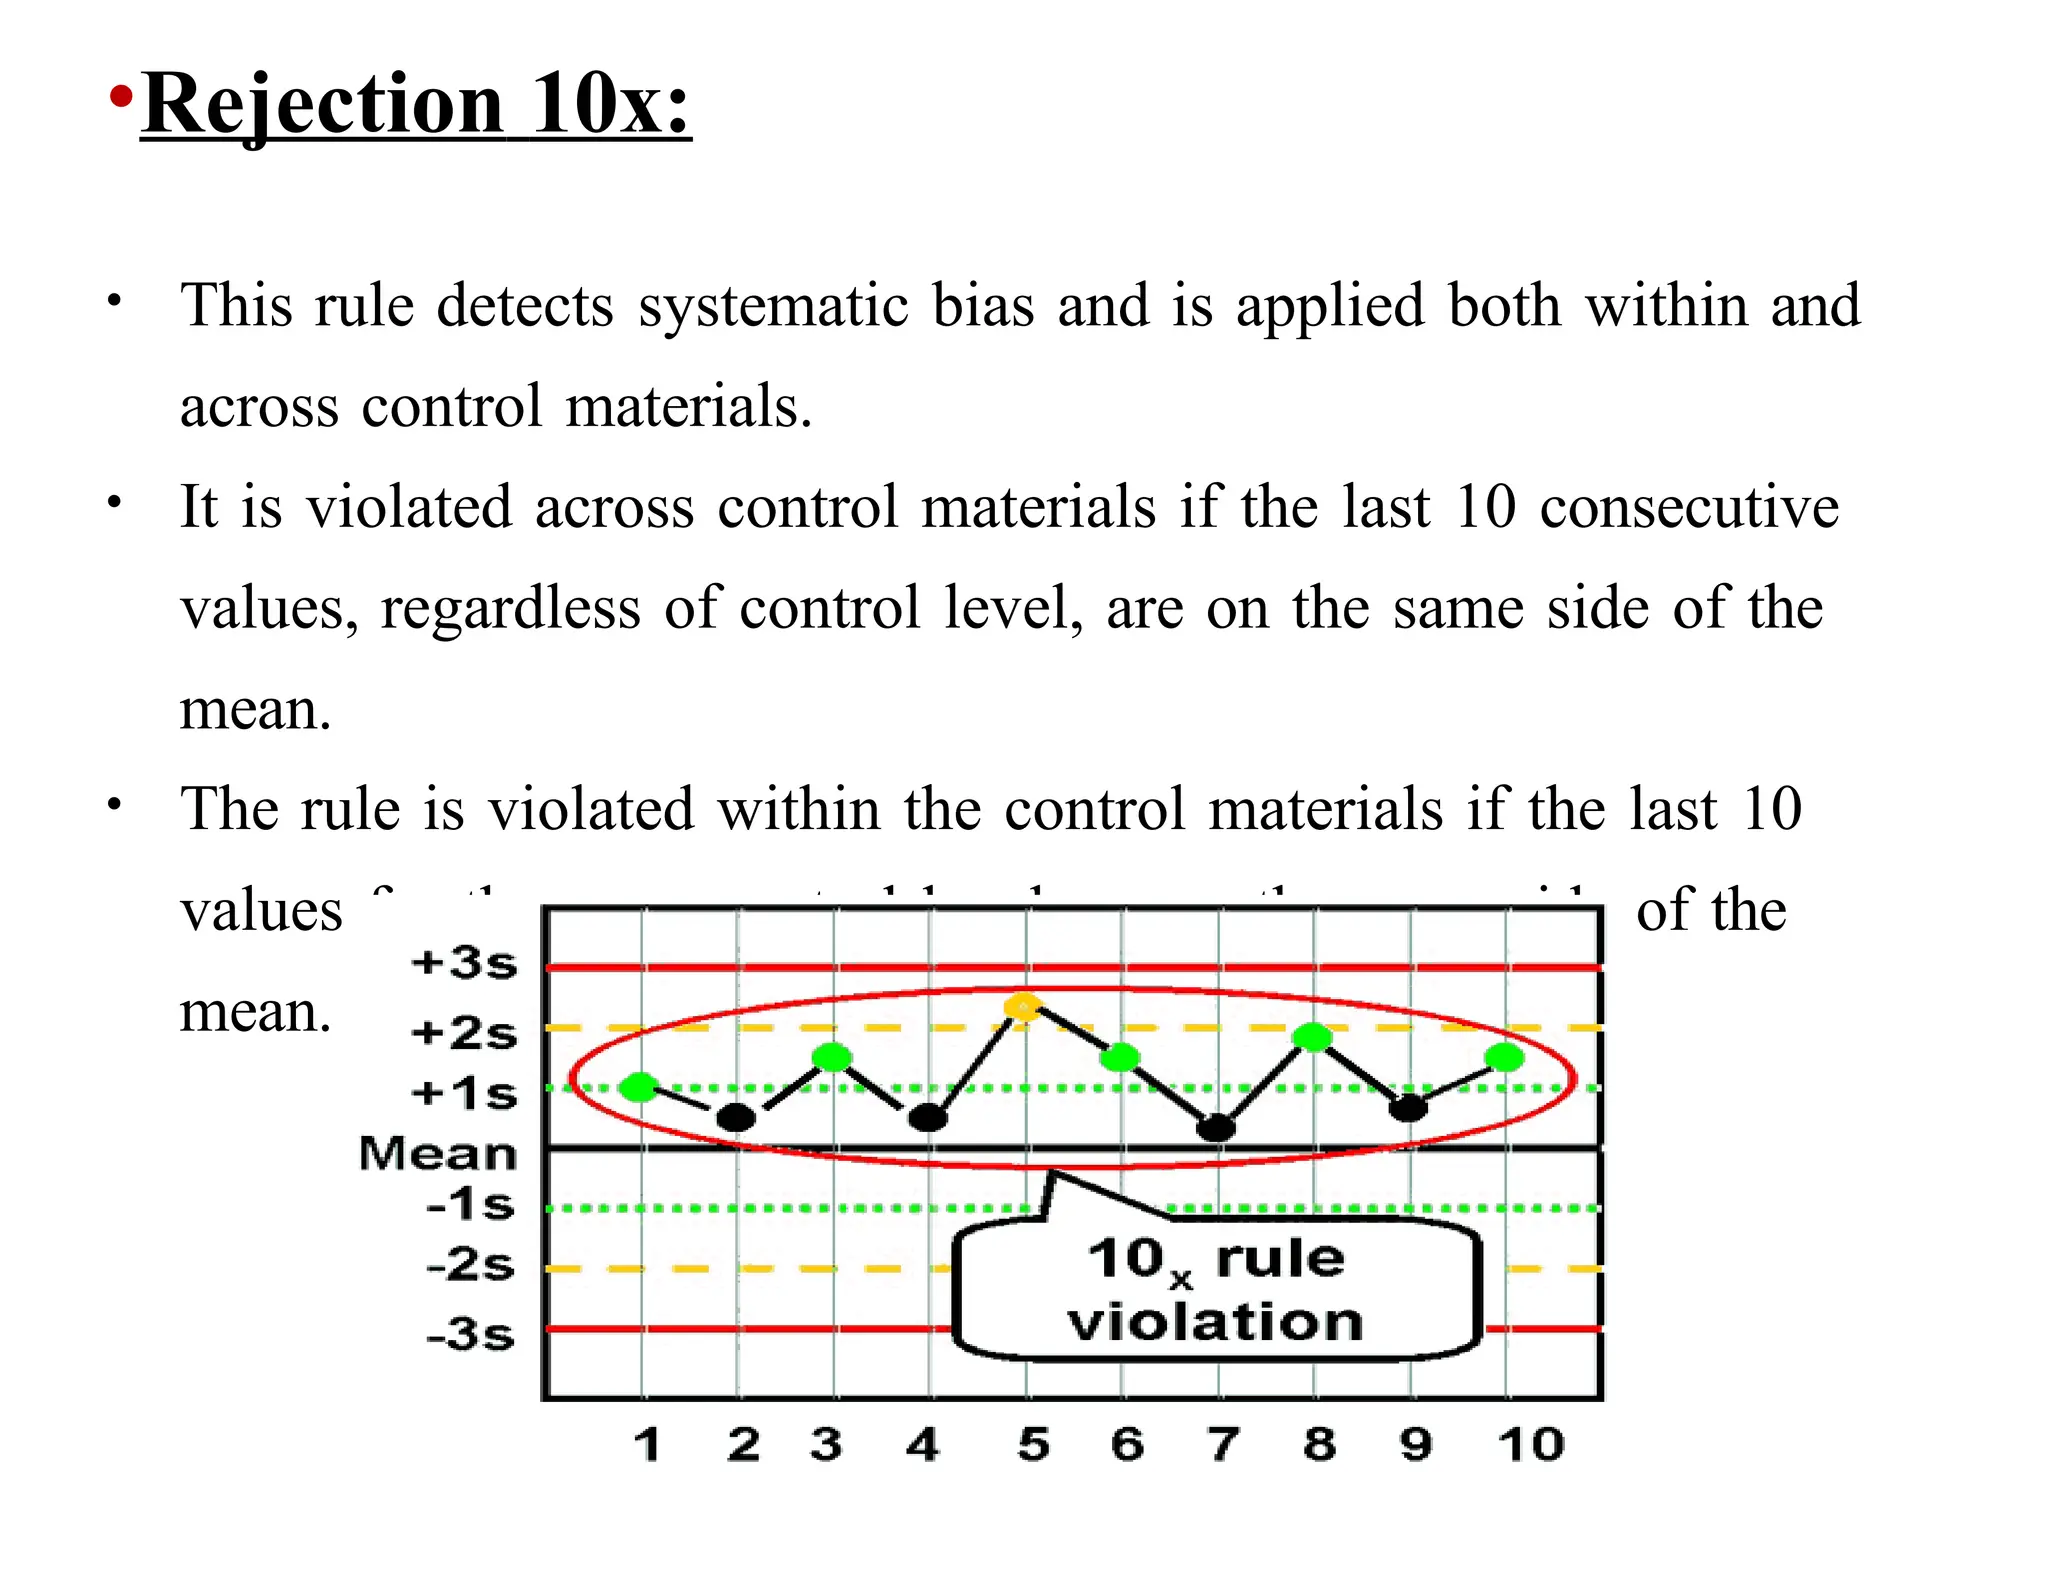
•Rejection 10x:
• Thisrule detects systematic bias and is applied both within and
across control materials.
• It is violated across control materials if the last 10 consecutive
values, regardless of control level, are on the same side of the
mean.
• The rule is violated within the control materials if the last 10
values for the same control level are on the same side of the
mean.
Why use Westgardrules?
We use it to help us reduce costs while
maintaining a high level of certainty that
are analytical process is functioning
properly
In other words to diminish, the false
rejection rate without compromising
quality
39.
EXTERNAL QUALITY
CONTROL
• Allthe participating laboratories daily
analyze the same lot of control material
• The results are tabulated monthly & sent
the sponsoring groups for the data
analysis
• Summary reports are prepared by the
program sponsor & are distributed to all
participating laboratories
40.
• The meanof values of all reference
laboratories is taken as the “ true “ or correct
value & is used for comparison with the
individual laboratory reported values
• If the difference between the reported value &
the true value is statistically significant then
the reporting lab is alerted
Accreditation-
• It isa process of inspection
of laboratories and their
licensing by a third-party
to ensure conformity to
predefined criteria
• Very very long task (it
may take around 2 to 3
years to follow the random
map)