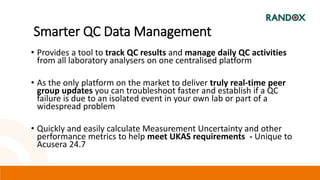
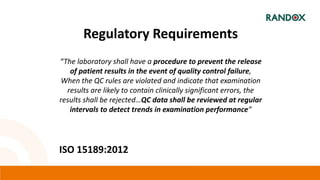
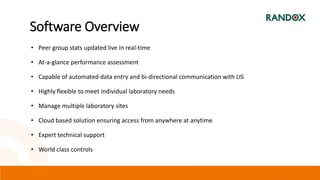
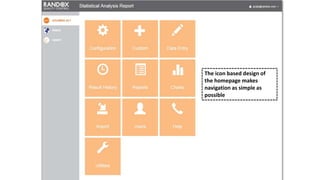
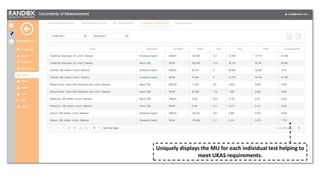
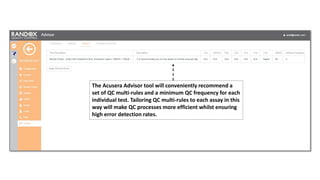
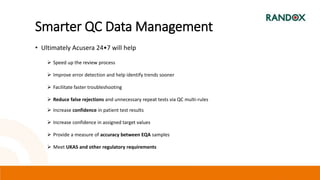
Randox Quality Control
Acusera 24.7
Interlaboratory Data Management
Complete QC solutions for results you can trust
Smarter QC Data Management
• Provides a tool to track QC results and manage daily QC activities
from all laboratory analysers on one centralised platform
• As the only platform on the market to deliver truly real-time peer
group updates you can troubleshoot faster and establish if a QC
failure is due to an isolated event in your own lab or part of a
widespread problem
• Quickly and easily calculate Measurement Uncertainty and other
performance metrics to help meet UKAS requirements - Unique to
Acusera 24.7
Regulatory Requirements
“The laboratory shall have a procedure to prevent the release
of patient results in the event of quality control failure,
When the QC rules are violated and indicate that examination
results are likely to contain clinically significant errors, the
results shall be rejected…QC data shall be reviewed at regular
intervals to detect trends in examination performance”
ISO 15189:2012
Regulatory Requirements
“The laboratory shall determine measurement uncertainty
for each measurement procedure in the examination phases
used to report measured quantity values on patients’ samples.
The laboratory shall define the performance requirements for
the measurement uncertainty of each measurement
procedure and regularly review estimates of measurement
uncertainty.”
ISO 15189:2012
“Randox presents their answer
to What is Six Sigma? Now
they include Sigma-metric
scores as part of their Acusera
24.7 Live Online software.
Automating the Sigma-metric
calculation helps increase the
ease of implementation of this
approach. Kudos for Randox
for including it in their
software.”
Sten Westgard
• Peer group stats updated live in real-time
• At-a-glance performance assessment
• Capable of automated data entry and bi-directional communication with LIS
• Highly flexible to meet individual laboratory needs
• Manage multiple laboratory sites
• Cloud based solution ensuring access from anywhere at anytime
• Expert technical support
• World class controls
Software Overview
The icon based design of
the homepage makes
navigation as simple as
possible
Instantly and conveniently flags any QC
failures from the last 7 days, reducing the
time spent analysing QC data.
Alerts you to control lots approaching
expiry eliminating the risk of using expired
QC material
Any result that triggers one of the pre-configured multi-rules
will be highlighted, ‘Rejects’ in red and ‘Alerts’ in orange
By clicking on the drop down menu next to the result
of interest more information is displayed
The result history may also be filtered to
display only alerts or only rejects
By selecting the edit button you can change a result or
add a comment
Monthly and Cumulative statistics are displayed for each lot of control in use.
Combine multiple data sets
on a single chart for better
review of trends
Rejects are highlighted in
red and alerts in orange
By hovering over any of the
points more info is displayed
Add events to a Levey-Jennings chart to quickly see if the
event has impacted performance.
Charts can be quickly and
easily generated at the touch
of a button for a user-defined
date range
The performance summary chart provides
a visual representation of both accuracy
and precision in relation to the chosen peer
group.
Displays individual laboratory statistics compared to the
chosen peer group
Displays Sigma Scores, % Bias and Total Error compared to
the chosen peer group
Uniquely displays the MU for each individual test helping to
meet UKAS requirements.
The Acusera Advisor tool will conveniently recommend a
set of QC multi-rules and a minimum QC frequency for each
individual test. Tailoring QC multi-rules to each assay in this
way will make QC processes more efficient whilst ensuring
high error detection rates.
The audit trail provides a secure electronic record
relating to the creation, deletion and modification of
data ensuring complete traceability
Smarter QC Data Management
• Ultimately Acusera 24•7 will help
 Speed up the review process
 Improve error detection and help identify trends sooner
 Facilitate faster troubleshooting
 Reduce false rejections and unnecessary repeat tests via QC multi-rules
 Increase confidence in patient test results
 Increase confidence in assigned target values
 Provide a measure of accuracy between EQA samples
 Meet UKAS and other regulatory requirements
Thank You

Acusera 24.7 QC Data Management

  • 1.
    Randox Quality Control Acusera24.7 Interlaboratory Data Management
  • 2.
    Complete QC solutionsfor results you can trust
  • 3.
    Smarter QC DataManagement • Provides a tool to track QC results and manage daily QC activities from all laboratory analysers on one centralised platform • As the only platform on the market to deliver truly real-time peer group updates you can troubleshoot faster and establish if a QC failure is due to an isolated event in your own lab or part of a widespread problem • Quickly and easily calculate Measurement Uncertainty and other performance metrics to help meet UKAS requirements - Unique to Acusera 24.7
  • 4.
    Regulatory Requirements “The laboratoryshall have a procedure to prevent the release of patient results in the event of quality control failure, When the QC rules are violated and indicate that examination results are likely to contain clinically significant errors, the results shall be rejected…QC data shall be reviewed at regular intervals to detect trends in examination performance” ISO 15189:2012
  • 5.
    Regulatory Requirements “The laboratoryshall determine measurement uncertainty for each measurement procedure in the examination phases used to report measured quantity values on patients’ samples. The laboratory shall define the performance requirements for the measurement uncertainty of each measurement procedure and regularly review estimates of measurement uncertainty.” ISO 15189:2012
  • 6.
    “Randox presents theiranswer to What is Six Sigma? Now they include Sigma-metric scores as part of their Acusera 24.7 Live Online software. Automating the Sigma-metric calculation helps increase the ease of implementation of this approach. Kudos for Randox for including it in their software.” Sten Westgard
  • 8.
    • Peer groupstats updated live in real-time • At-a-glance performance assessment • Capable of automated data entry and bi-directional communication with LIS • Highly flexible to meet individual laboratory needs • Manage multiple laboratory sites • Cloud based solution ensuring access from anywhere at anytime • Expert technical support • World class controls Software Overview
  • 9.
    The icon baseddesign of the homepage makes navigation as simple as possible
  • 10.
    Instantly and convenientlyflags any QC failures from the last 7 days, reducing the time spent analysing QC data. Alerts you to control lots approaching expiry eliminating the risk of using expired QC material
  • 12.
    Any result thattriggers one of the pre-configured multi-rules will be highlighted, ‘Rejects’ in red and ‘Alerts’ in orange By clicking on the drop down menu next to the result of interest more information is displayed The result history may also be filtered to display only alerts or only rejects By selecting the edit button you can change a result or add a comment
  • 13.
    Monthly and Cumulativestatistics are displayed for each lot of control in use.
  • 14.
    Combine multiple datasets on a single chart for better review of trends Rejects are highlighted in red and alerts in orange By hovering over any of the points more info is displayed
  • 15.
    Add events toa Levey-Jennings chart to quickly see if the event has impacted performance.
  • 16.
    Charts can bequickly and easily generated at the touch of a button for a user-defined date range
  • 17.
    The performance summarychart provides a visual representation of both accuracy and precision in relation to the chosen peer group.
  • 18.
    Displays individual laboratorystatistics compared to the chosen peer group
  • 19.
    Displays Sigma Scores,% Bias and Total Error compared to the chosen peer group
  • 20.
    Uniquely displays theMU for each individual test helping to meet UKAS requirements.
  • 21.
    The Acusera Advisortool will conveniently recommend a set of QC multi-rules and a minimum QC frequency for each individual test. Tailoring QC multi-rules to each assay in this way will make QC processes more efficient whilst ensuring high error detection rates.
  • 22.
    The audit trailprovides a secure electronic record relating to the creation, deletion and modification of data ensuring complete traceability
  • 23.
    Smarter QC DataManagement • Ultimately Acusera 24•7 will help  Speed up the review process  Improve error detection and help identify trends sooner  Facilitate faster troubleshooting  Reduce false rejections and unnecessary repeat tests via QC multi-rules  Increase confidence in patient test results  Increase confidence in assigned target values  Provide a measure of accuracy between EQA samples  Meet UKAS and other regulatory requirements
  • 24.

Editor's Notes

  • #5 ISO 15189 requires labs to have a procedure in place to review QC data at regular intervals in order to detect trends in performance.
  • #6 In addition as Margaret has already mentioned during her presentation, ISO also requires laboratories to determine measurement uncertainty. Acusera 24.7 is the only QC platform on the market to incorporate the automatic calculation of measurement uncertainty as well as other performance metrics including Sigma Scores and Total Error.