Downloaded 16 times


![The Rise of the GPU Early GPUs [C. J. Thompson et al. 2002] Fixed-function processors Highly optimized, fixed rendering path Non-programmable Shaders [P. Hanrahan, J. Lawson 1990] More flexibility Per-surface shading Modern GPUs [C. J. Thompson et al. 2002] Innovation fueled by game development More transistors than a CPU 240+ stream processors Early S3 graphics card NVidia GTX 285 & 295](https://image.slidesharecdn.com/infovis09-gpuvis-final-100128084232-phpapp02/85/Towards-Utilizing-GPUs-in-Information-Visualization-4-320.jpg)
![General Purpose GPU computing Exploit the GPU's programmability [C. J. Thompson et al. 2002] Highly parallel and efficient computing Offload computation from the CPU Functional mismatch GPUs deal with graphics primitives Adaptive libraries [I. Buck et al. 2004] NVidia's CUDA, ATI's Stream Computing SDK Make GPGPU programming more accessible](https://image.slidesharecdn.com/infovis09-gpuvis-final-100128084232-phpapp02/85/Towards-Utilizing-GPUs-in-Information-Visualization-5-320.jpg)
![GPUs for Scientific Visualization Performance increases [K. Engel et al. 2006] Real-time volumetric rendering Scout Data easily expressed as primitives 2D or 3D mapping Still problems Shader expertise Conceptual mismatch Scout: A Hardware-Accelerated System for Quantitatively Driven Visualization and Analysis – McCormick et al. 2004](https://image.slidesharecdn.com/infovis09-gpuvis-final-100128084232-phpapp02/85/Towards-Utilizing-GPUs-in-Information-Visualization-6-320.jpg)
![GPUs for Information Visualization Few utilize the GPU's programmable pipeline Data stored as floating-point OpenGL textures [J. Johansson et al. 2006] Use graphics hardware to improve rendering [M. Florek, M. Novotný 2006] Usage is opportunistic Still no general approach Revealing structure in visualizations of dense 2D and 3D parallel coordinates – J. Johansson et al. 2006](https://image.slidesharecdn.com/infovis09-gpuvis-final-100128084232-phpapp02/85/Towards-Utilizing-GPUs-in-Information-Visualization-7-320.jpg)

![GPU Shader Programming Model Stream programming model [A. Fournier and D. Fussell] Transform input streams to output streams Shaders (kernels) Kernel program invoked by a stream processor Called for each element in the input stream Executed independently of all other kernels Large number of parallel kernels provides extreme performance Kernel types Vertex – operates on a single 3D vertex in the stream Fragment (pixel) – invoked for every pixel to be drawn Geometry – generate new primitives](https://image.slidesharecdn.com/infovis09-gpuvis-final-100128084232-phpapp02/85/Towards-Utilizing-GPUs-in-Information-Visualization-14-320.jpg)
![Questions? [email_address] [email_address]](https://image.slidesharecdn.com/infovis09-gpuvis-final-100128084232-phpapp02/85/Towards-Utilizing-GPUs-in-Information-Visualization-22-320.jpg)

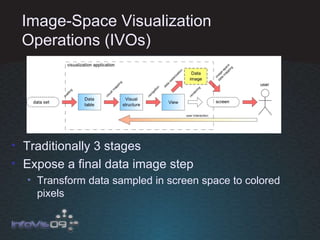
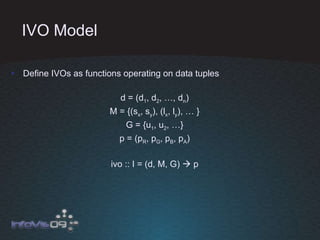
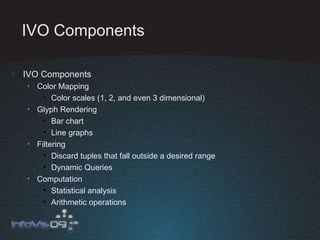
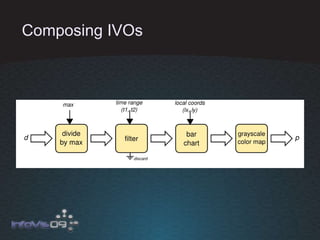
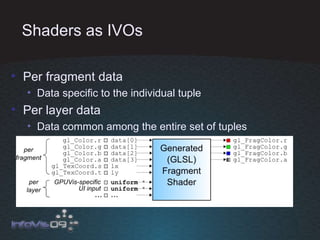
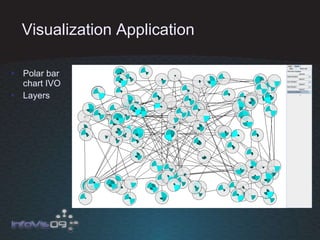
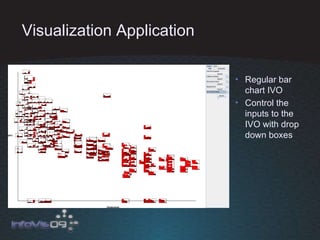
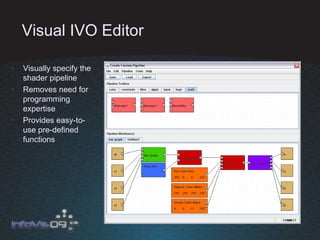
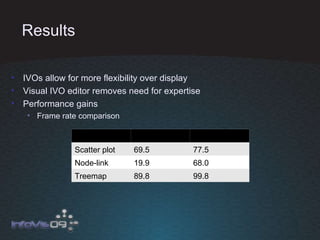
The document proposes GPUVis, a model and implementation for utilizing GPUs in information visualization. GPUVis defines image-space operations (IVOs) that transform data tuples into colored pixels. IVOs can perform tasks like color mapping, glyph rendering, filtering, and statistical analysis. GPUVis implements IVOs as shader programs and provides a visual editor to compose IVOs without programming. A demo of GPUVis shows performance gains over OpenGL for visualizations like scatter plots, node-link diagrams, and treemaps. Future work aims to improve control flow, optimization, and transition to CUDA/OpenCL.


![[SIGGRAPH 2016] Automatic Image Colorization](https://cdn.slidesharecdn.com/ss_thumbnails/iizukasiggraph2016slide-170809084052-thumbnail.jpg?width=640&height=640&fit=bounds)


![Getting Started with Apache Spark: Big Data Made Simple [Free Meetup]](https://cdn.slidesharecdn.com/ss_thumbnails/apachesparkgettingstarted-260203175547-8361bcc3-thumbnail.jpg?width=640&height=640&fit=bounds)


