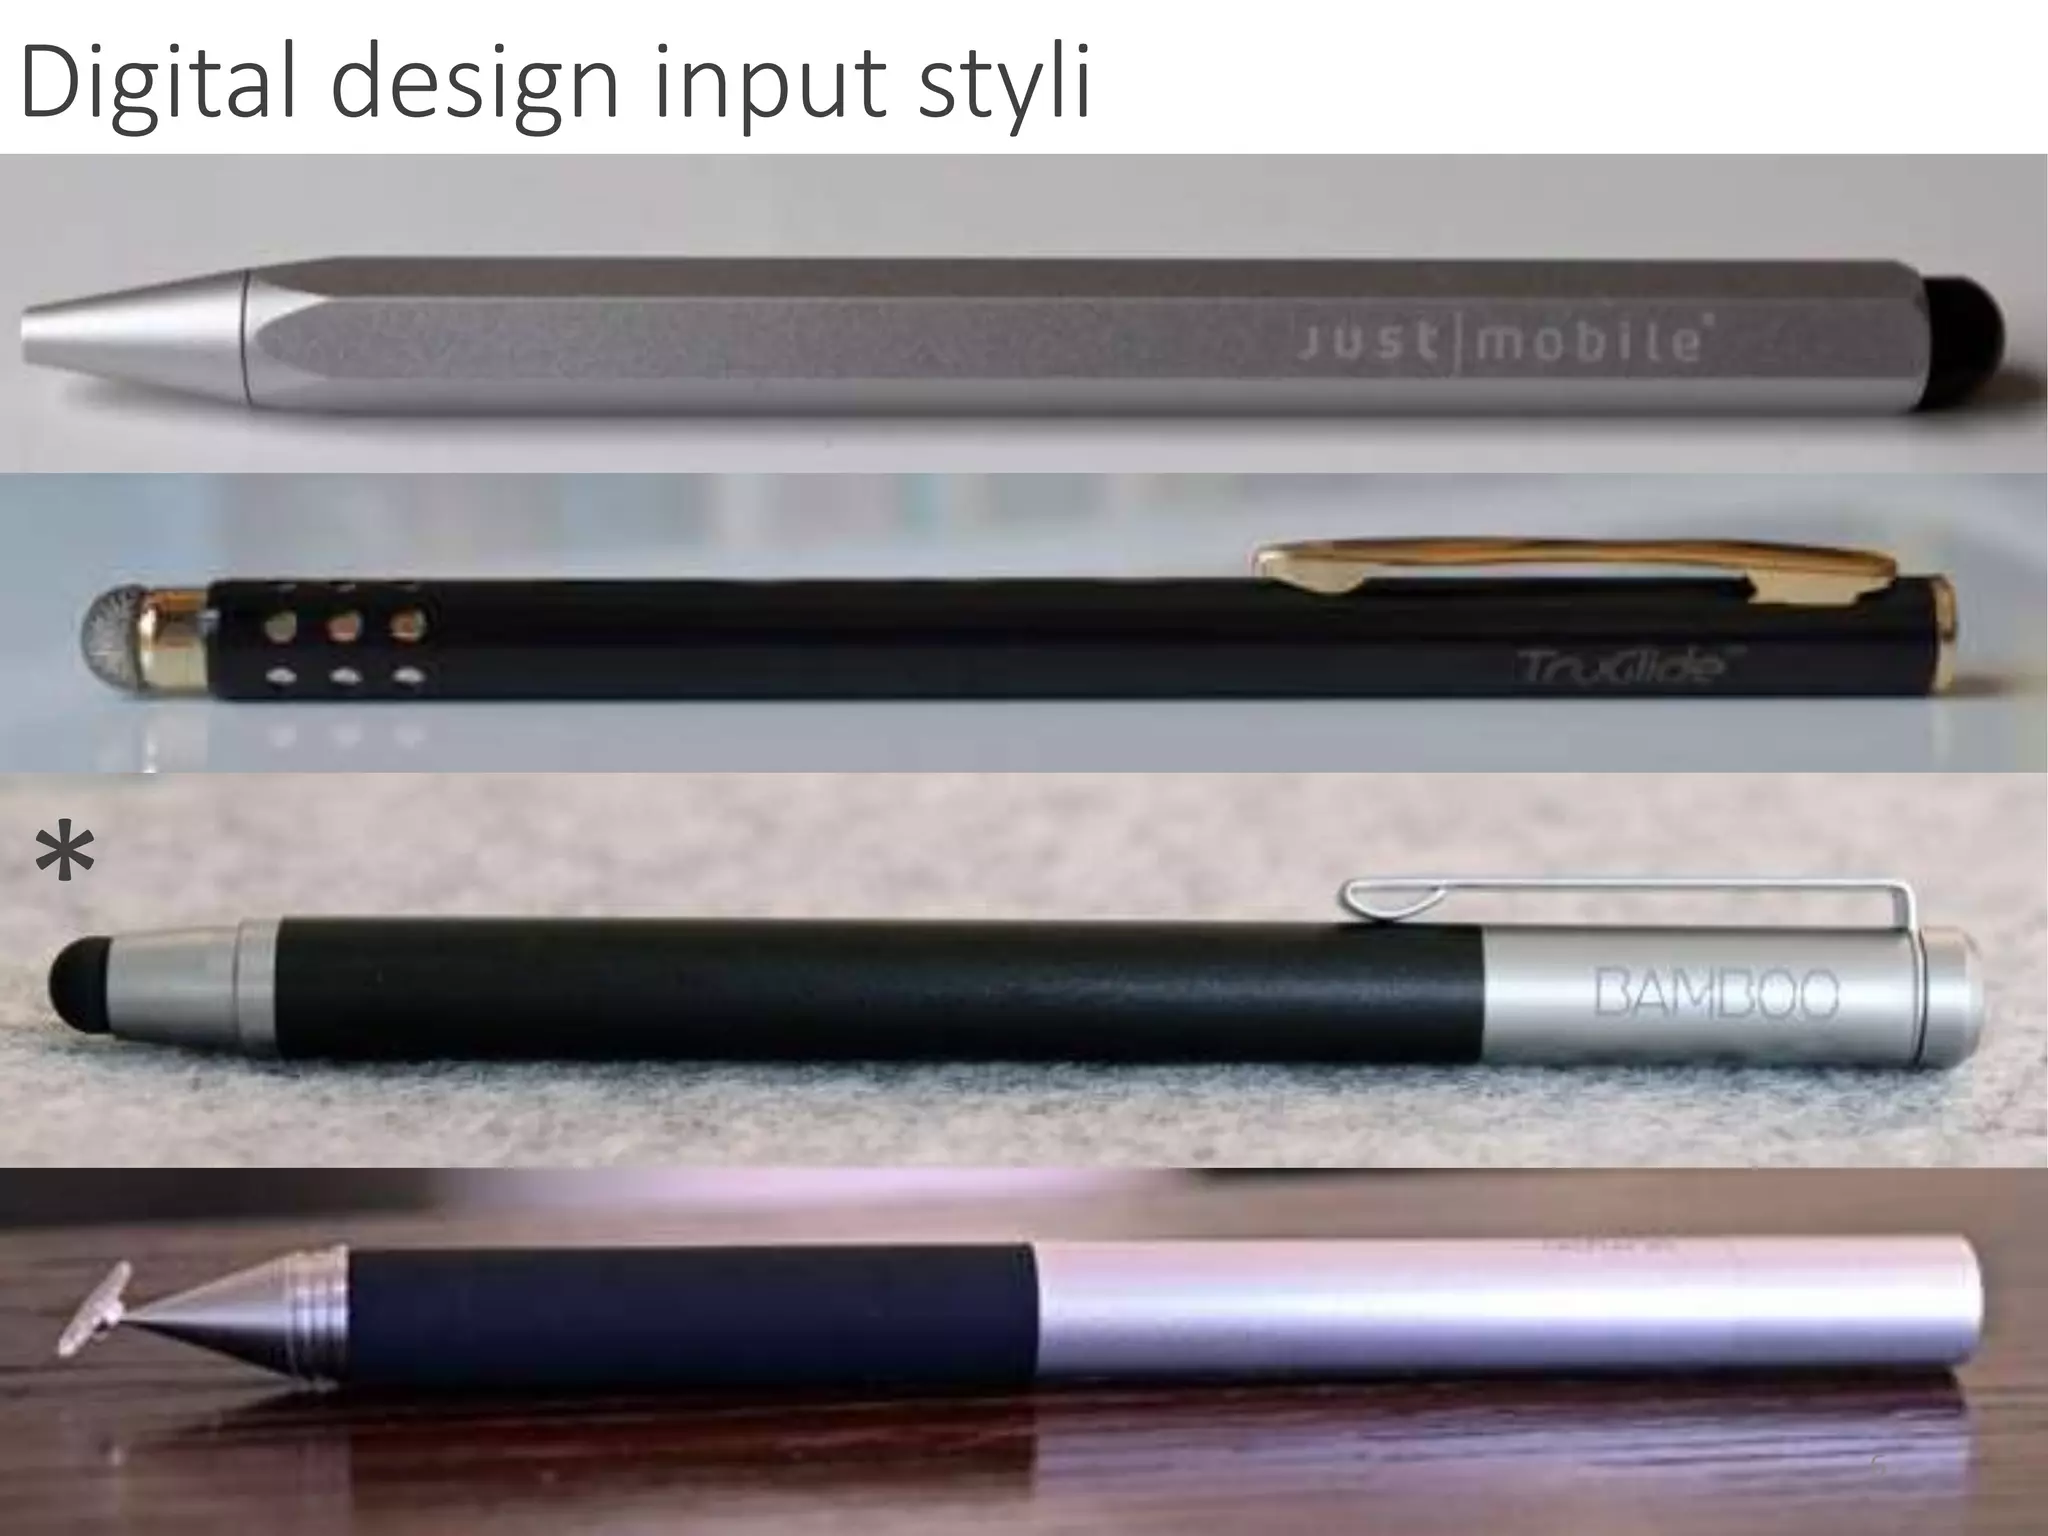
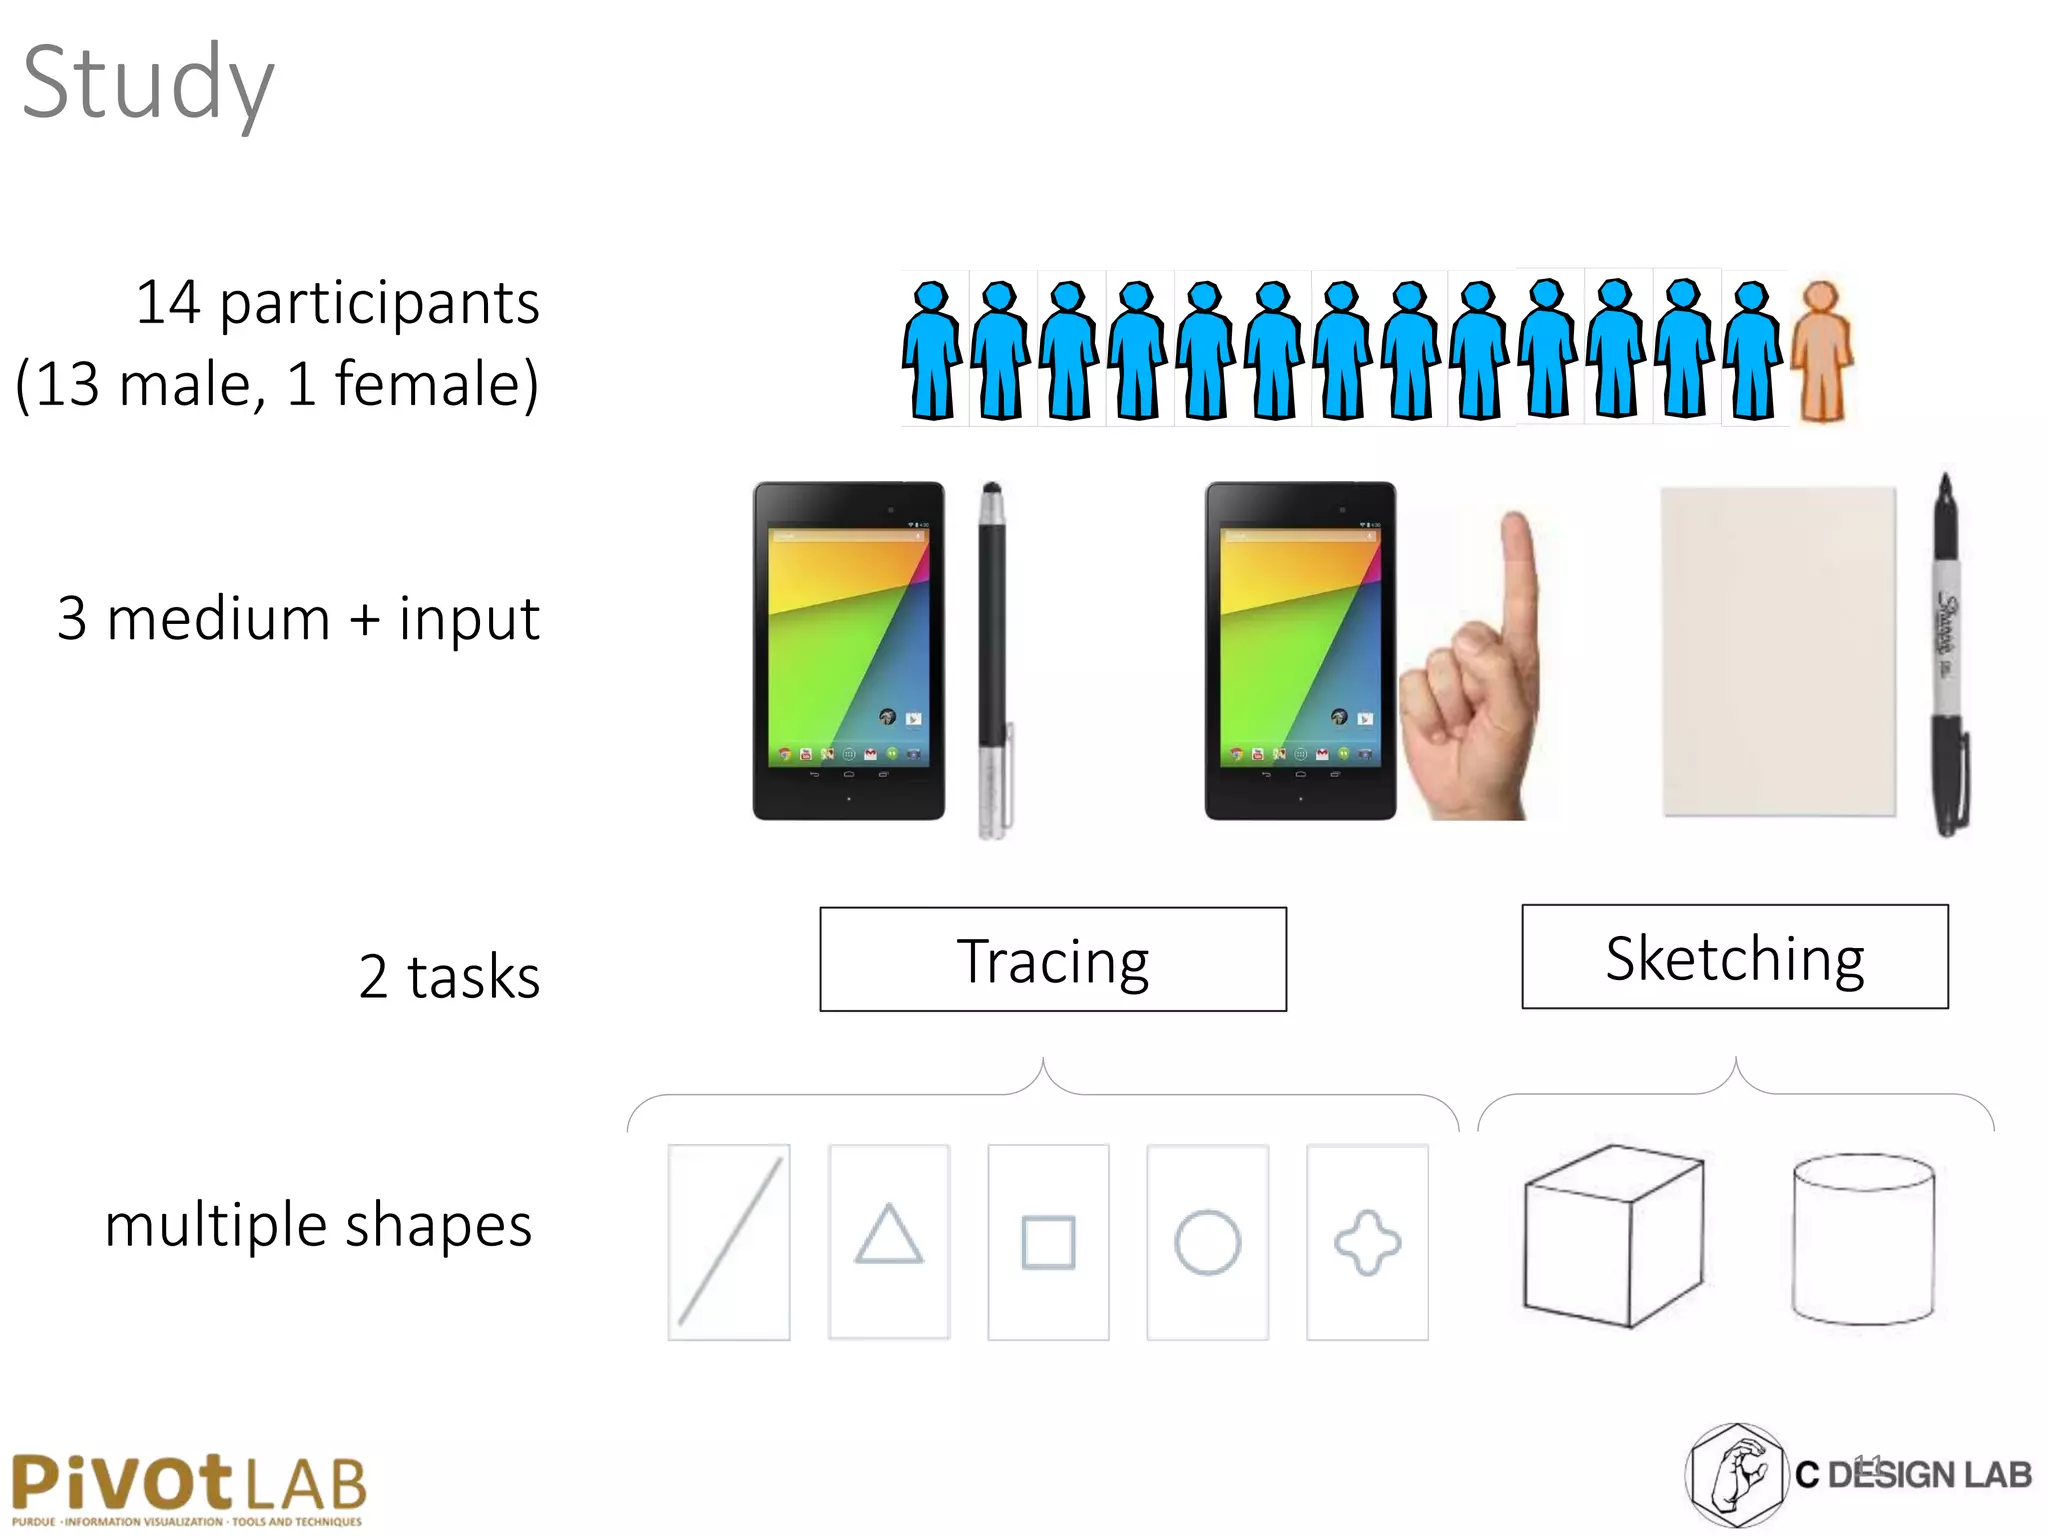
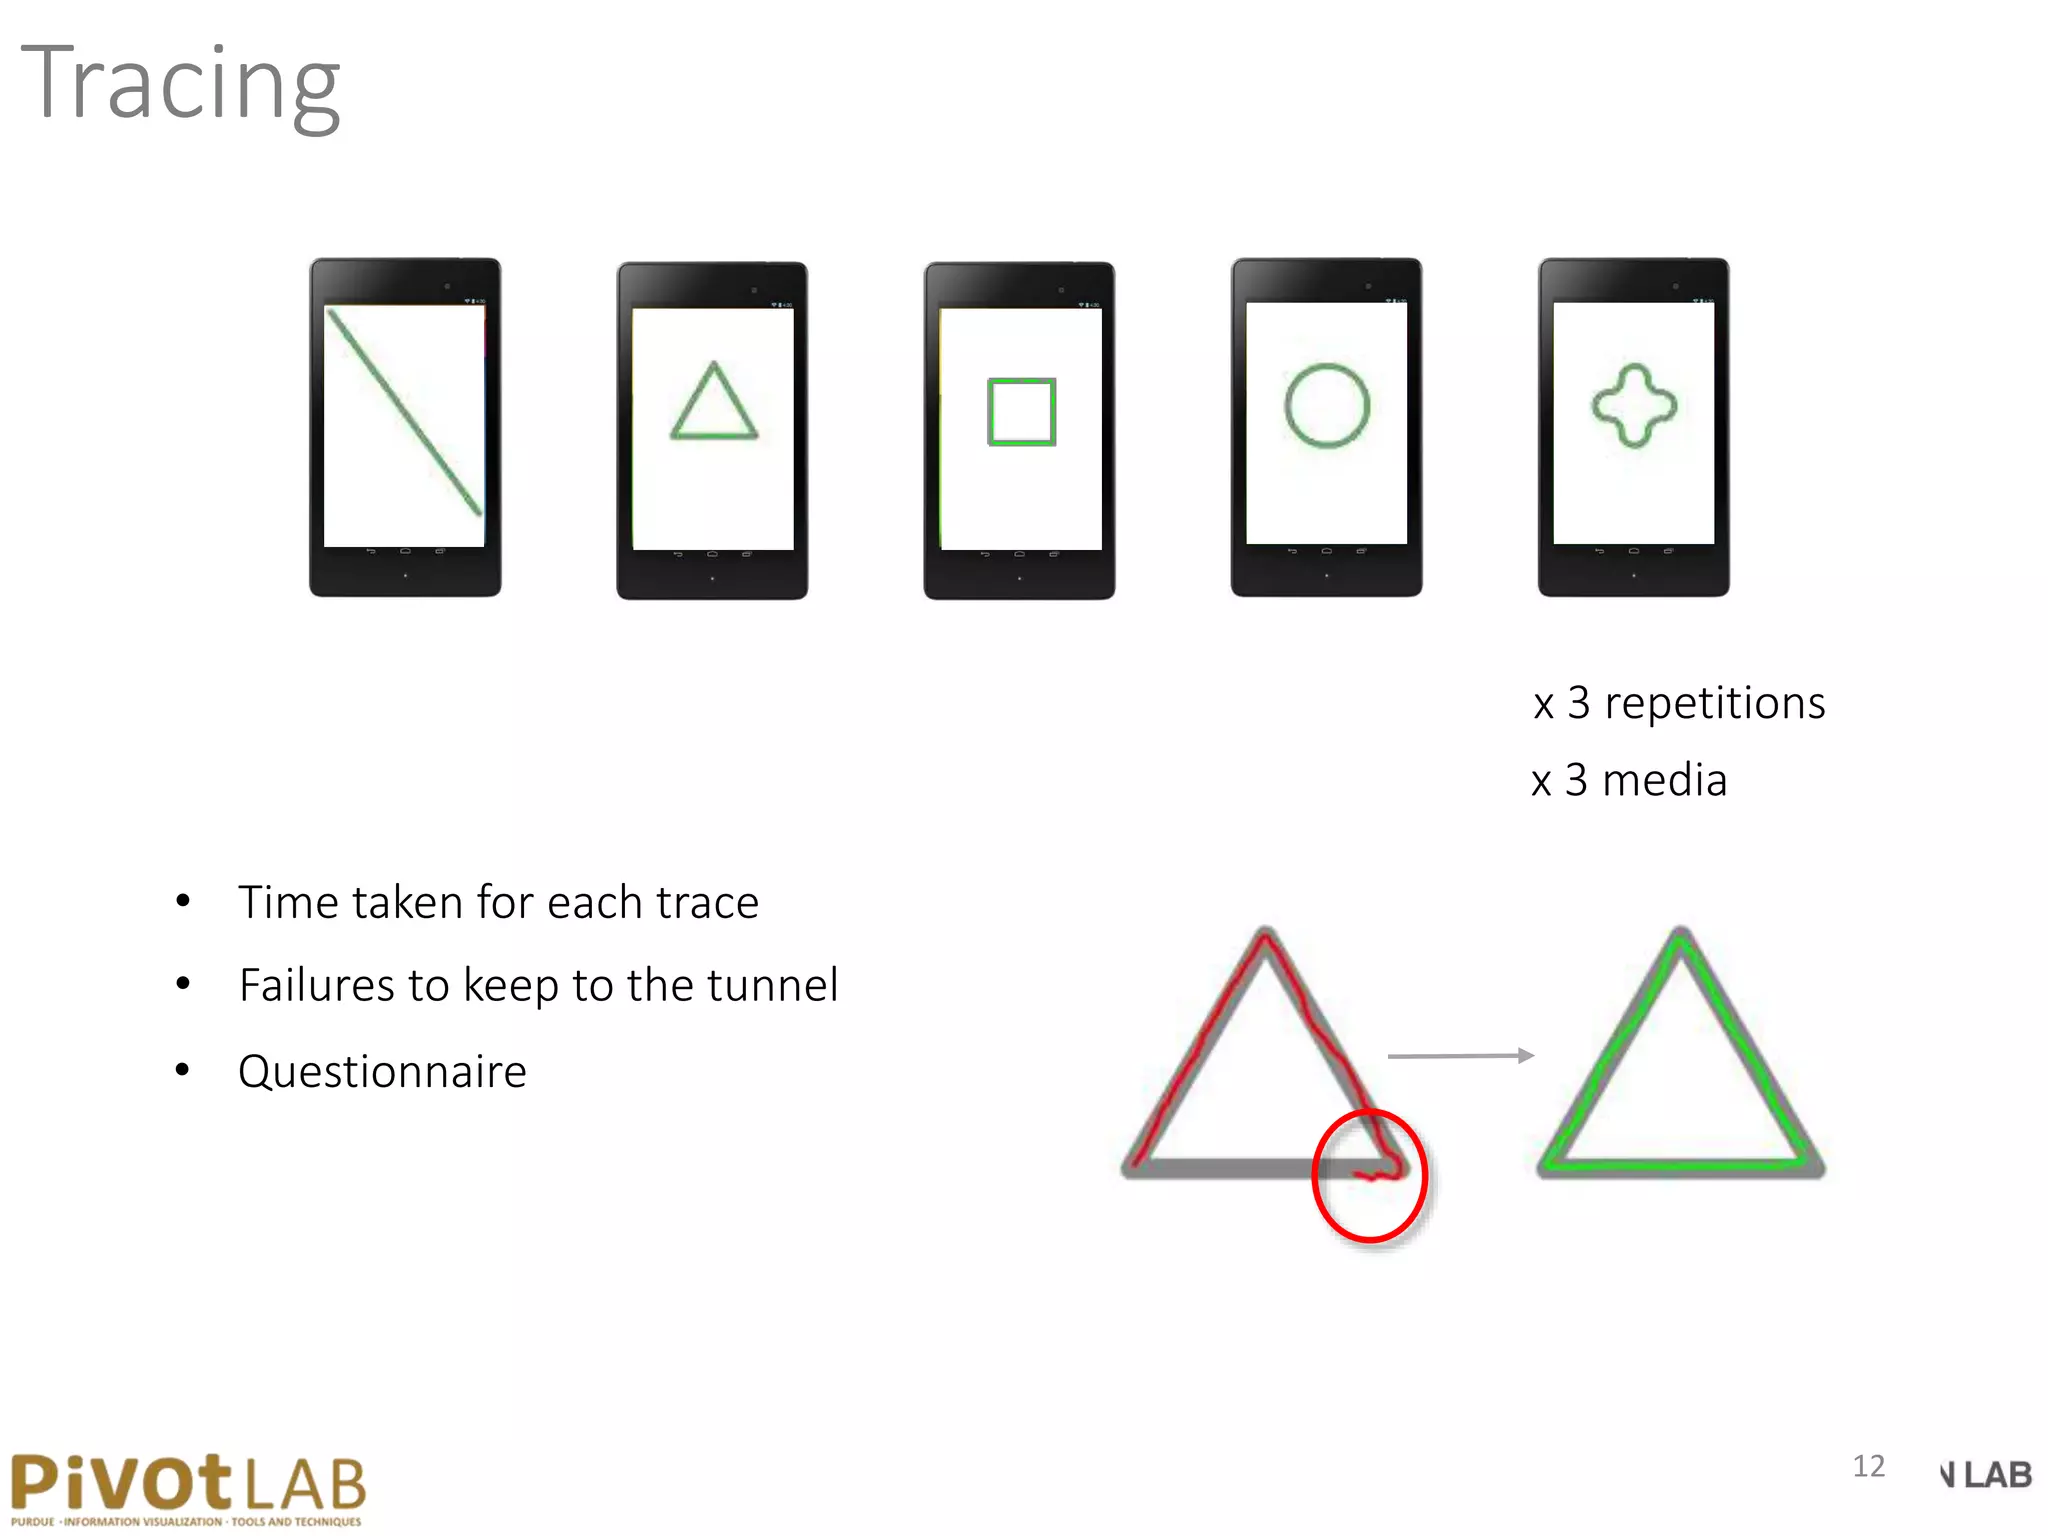
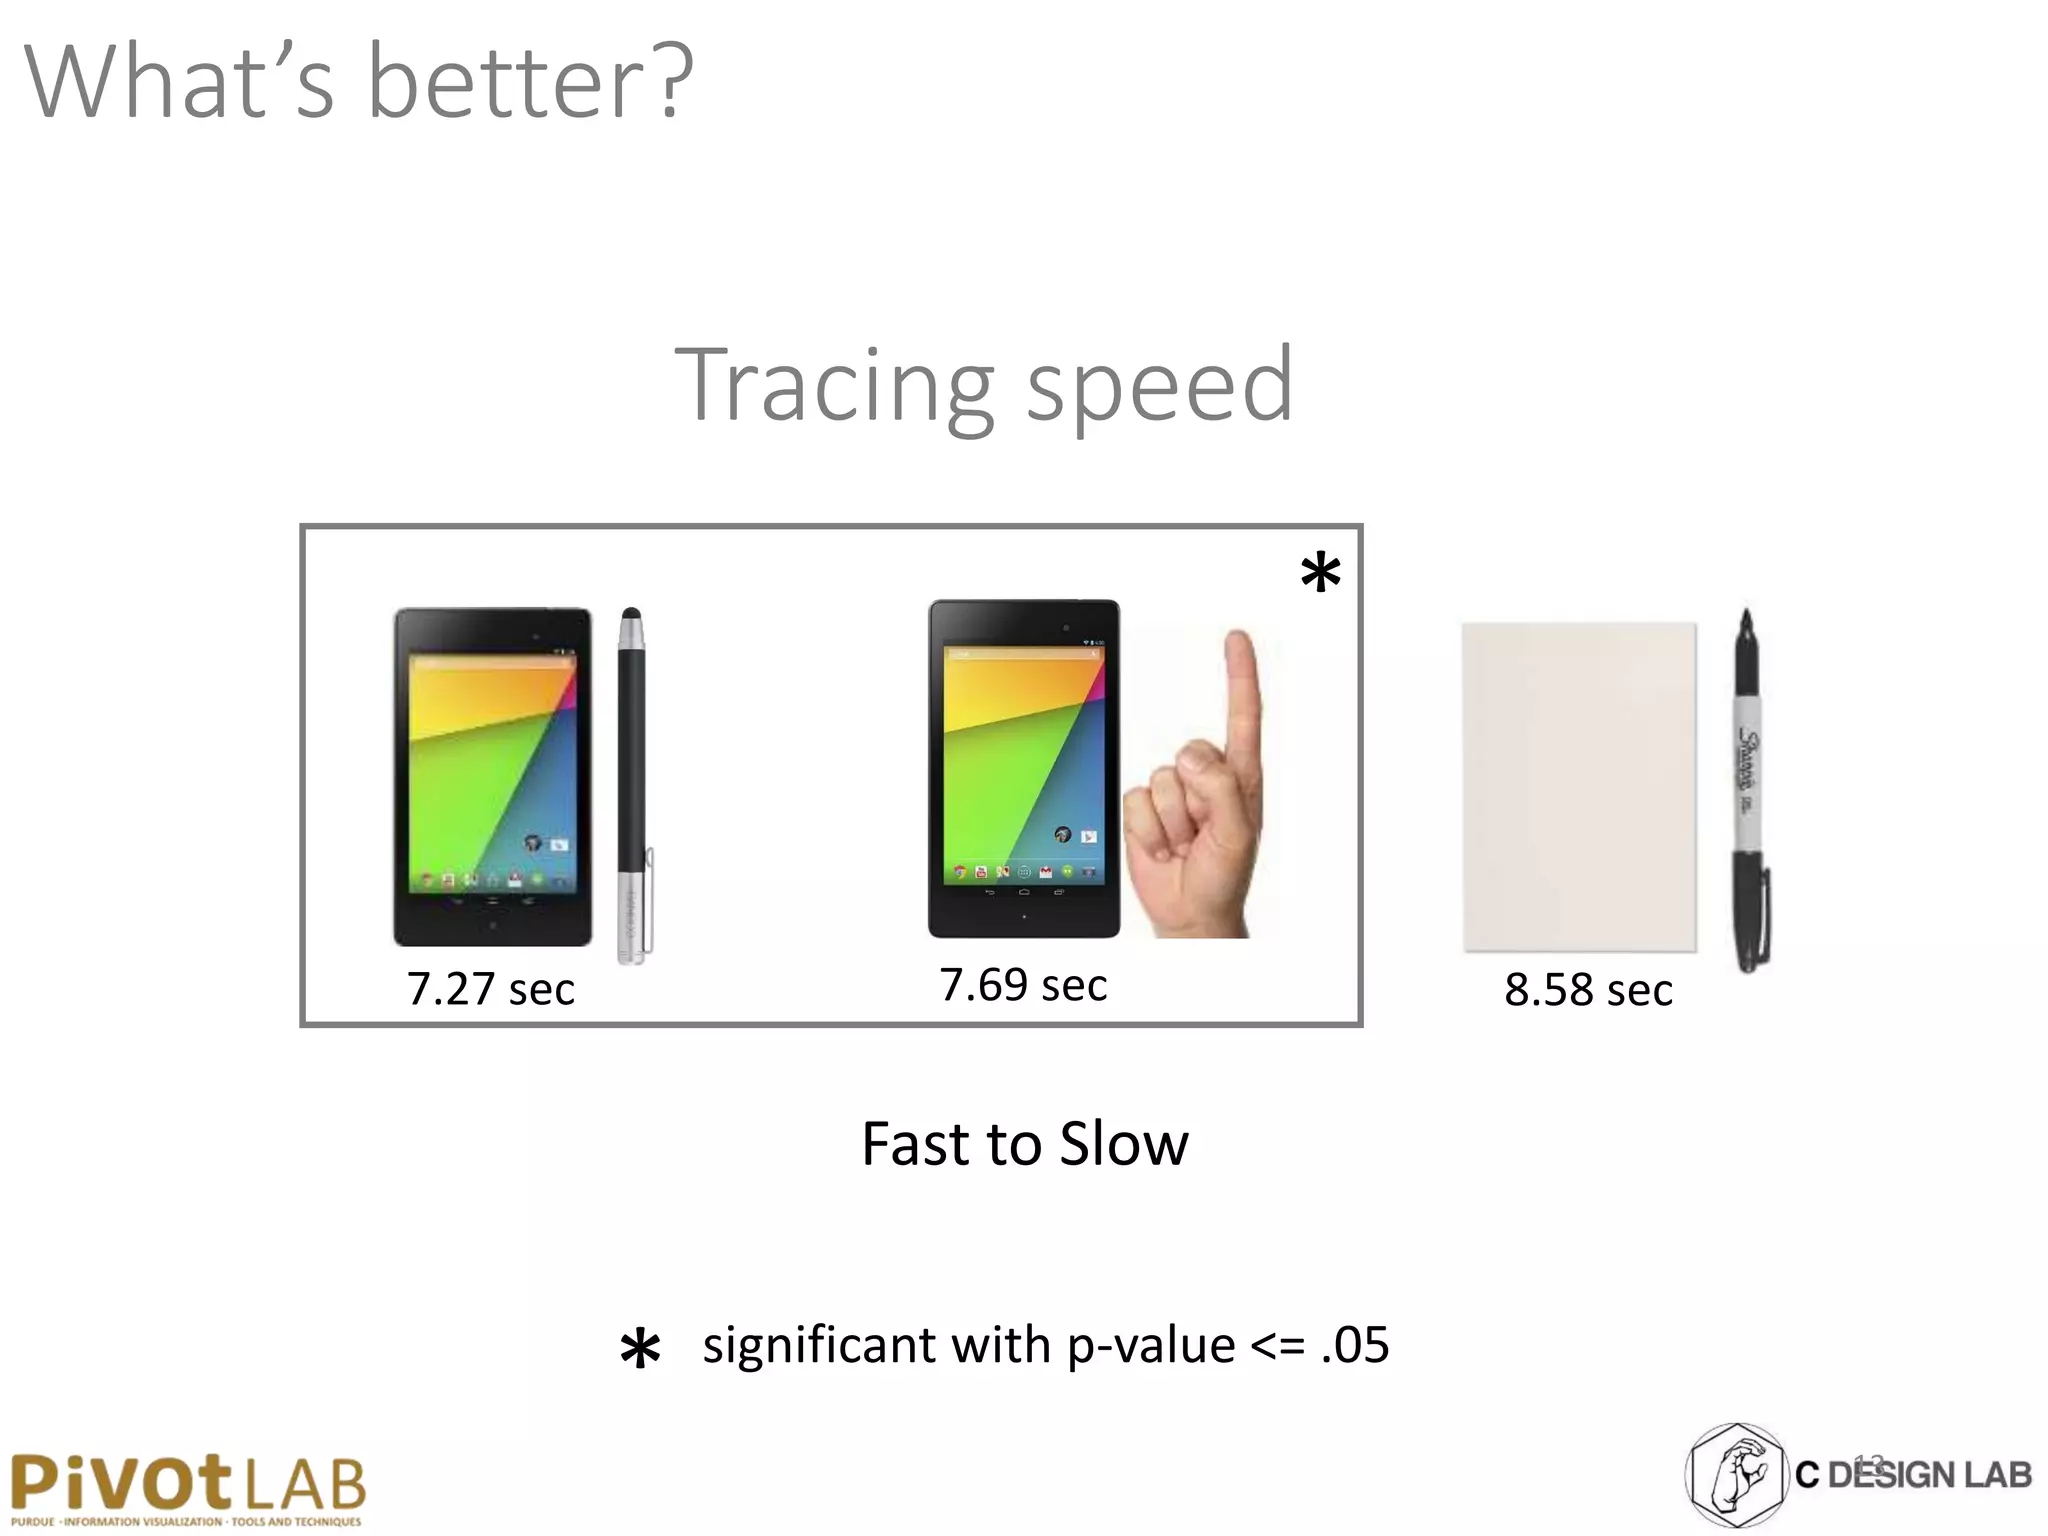
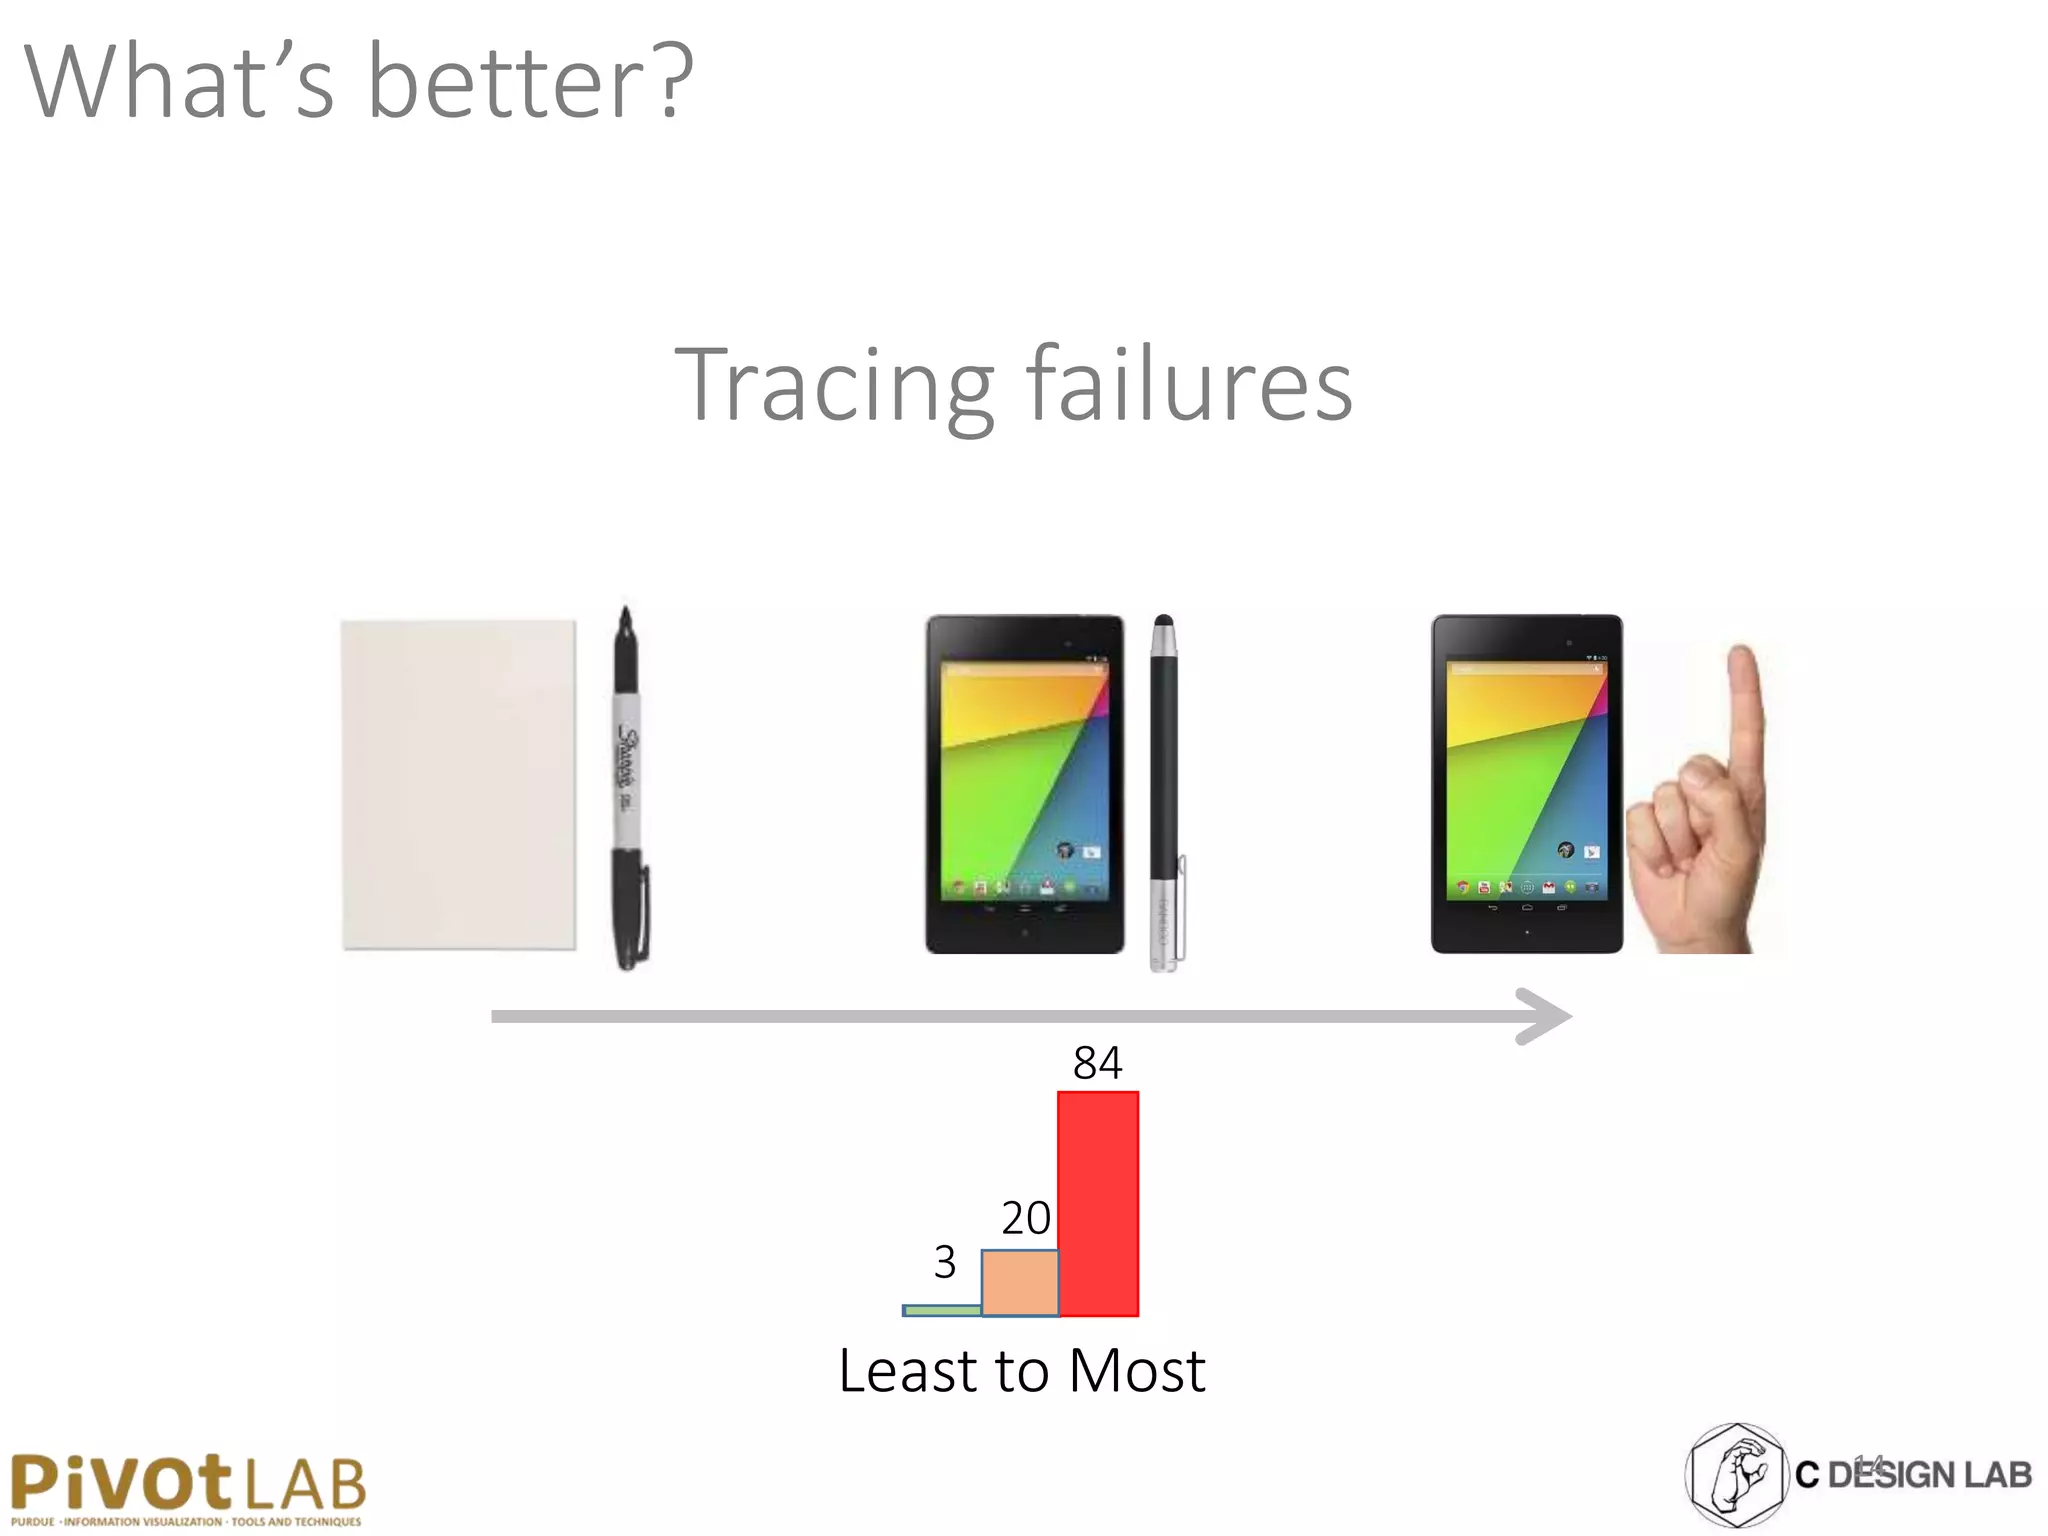
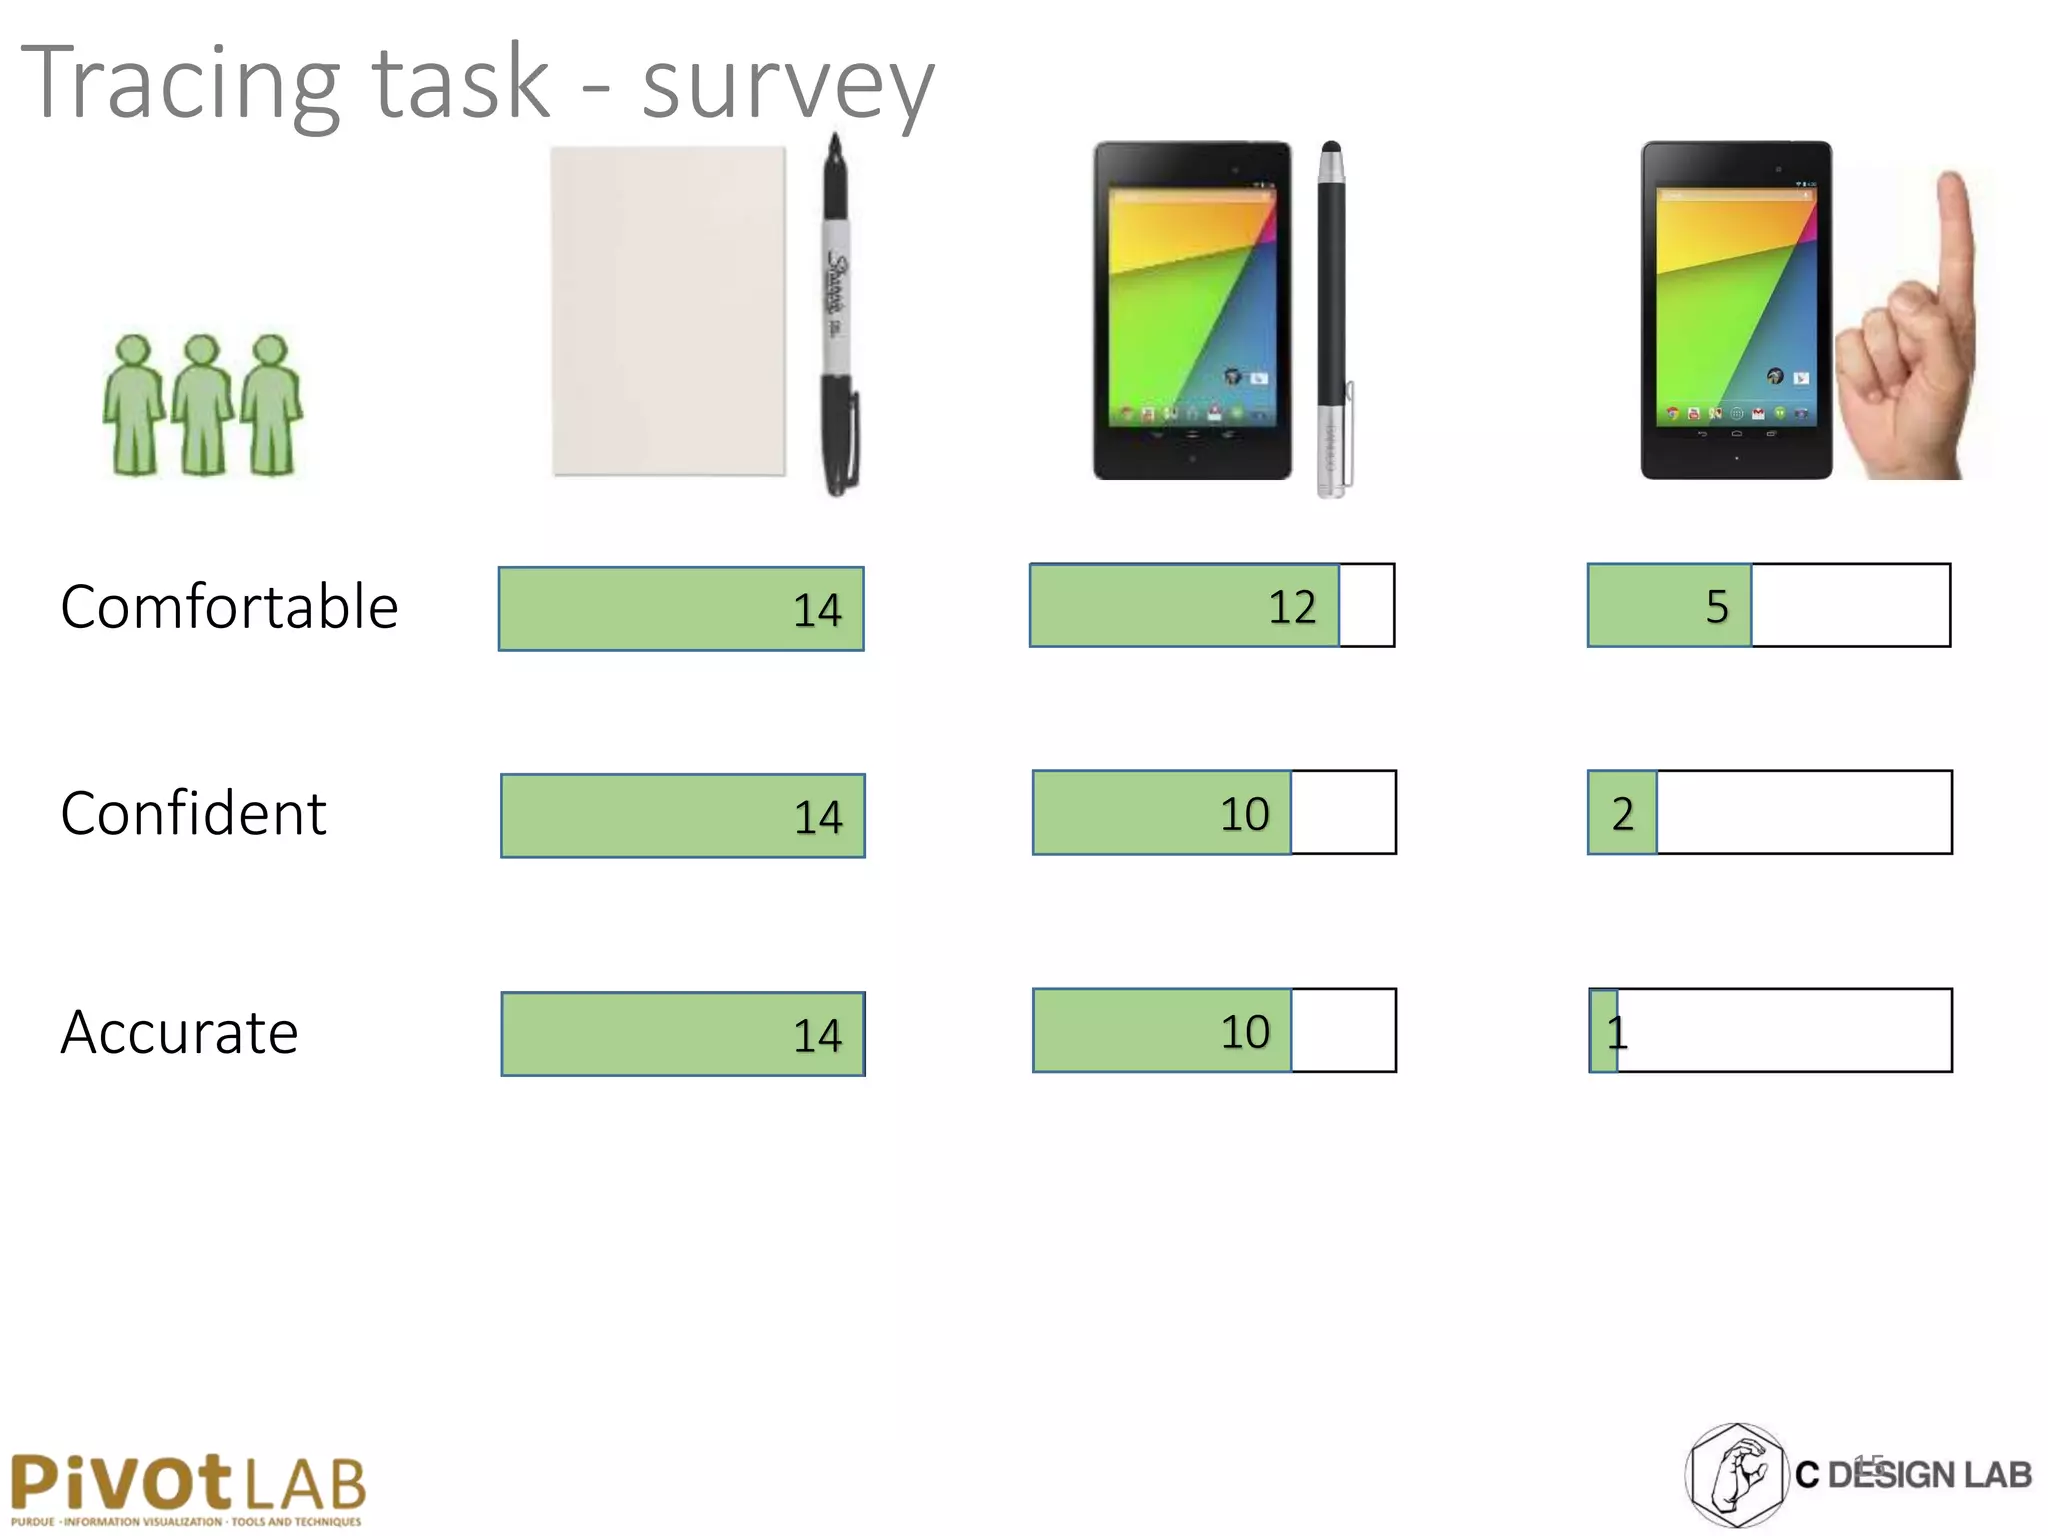
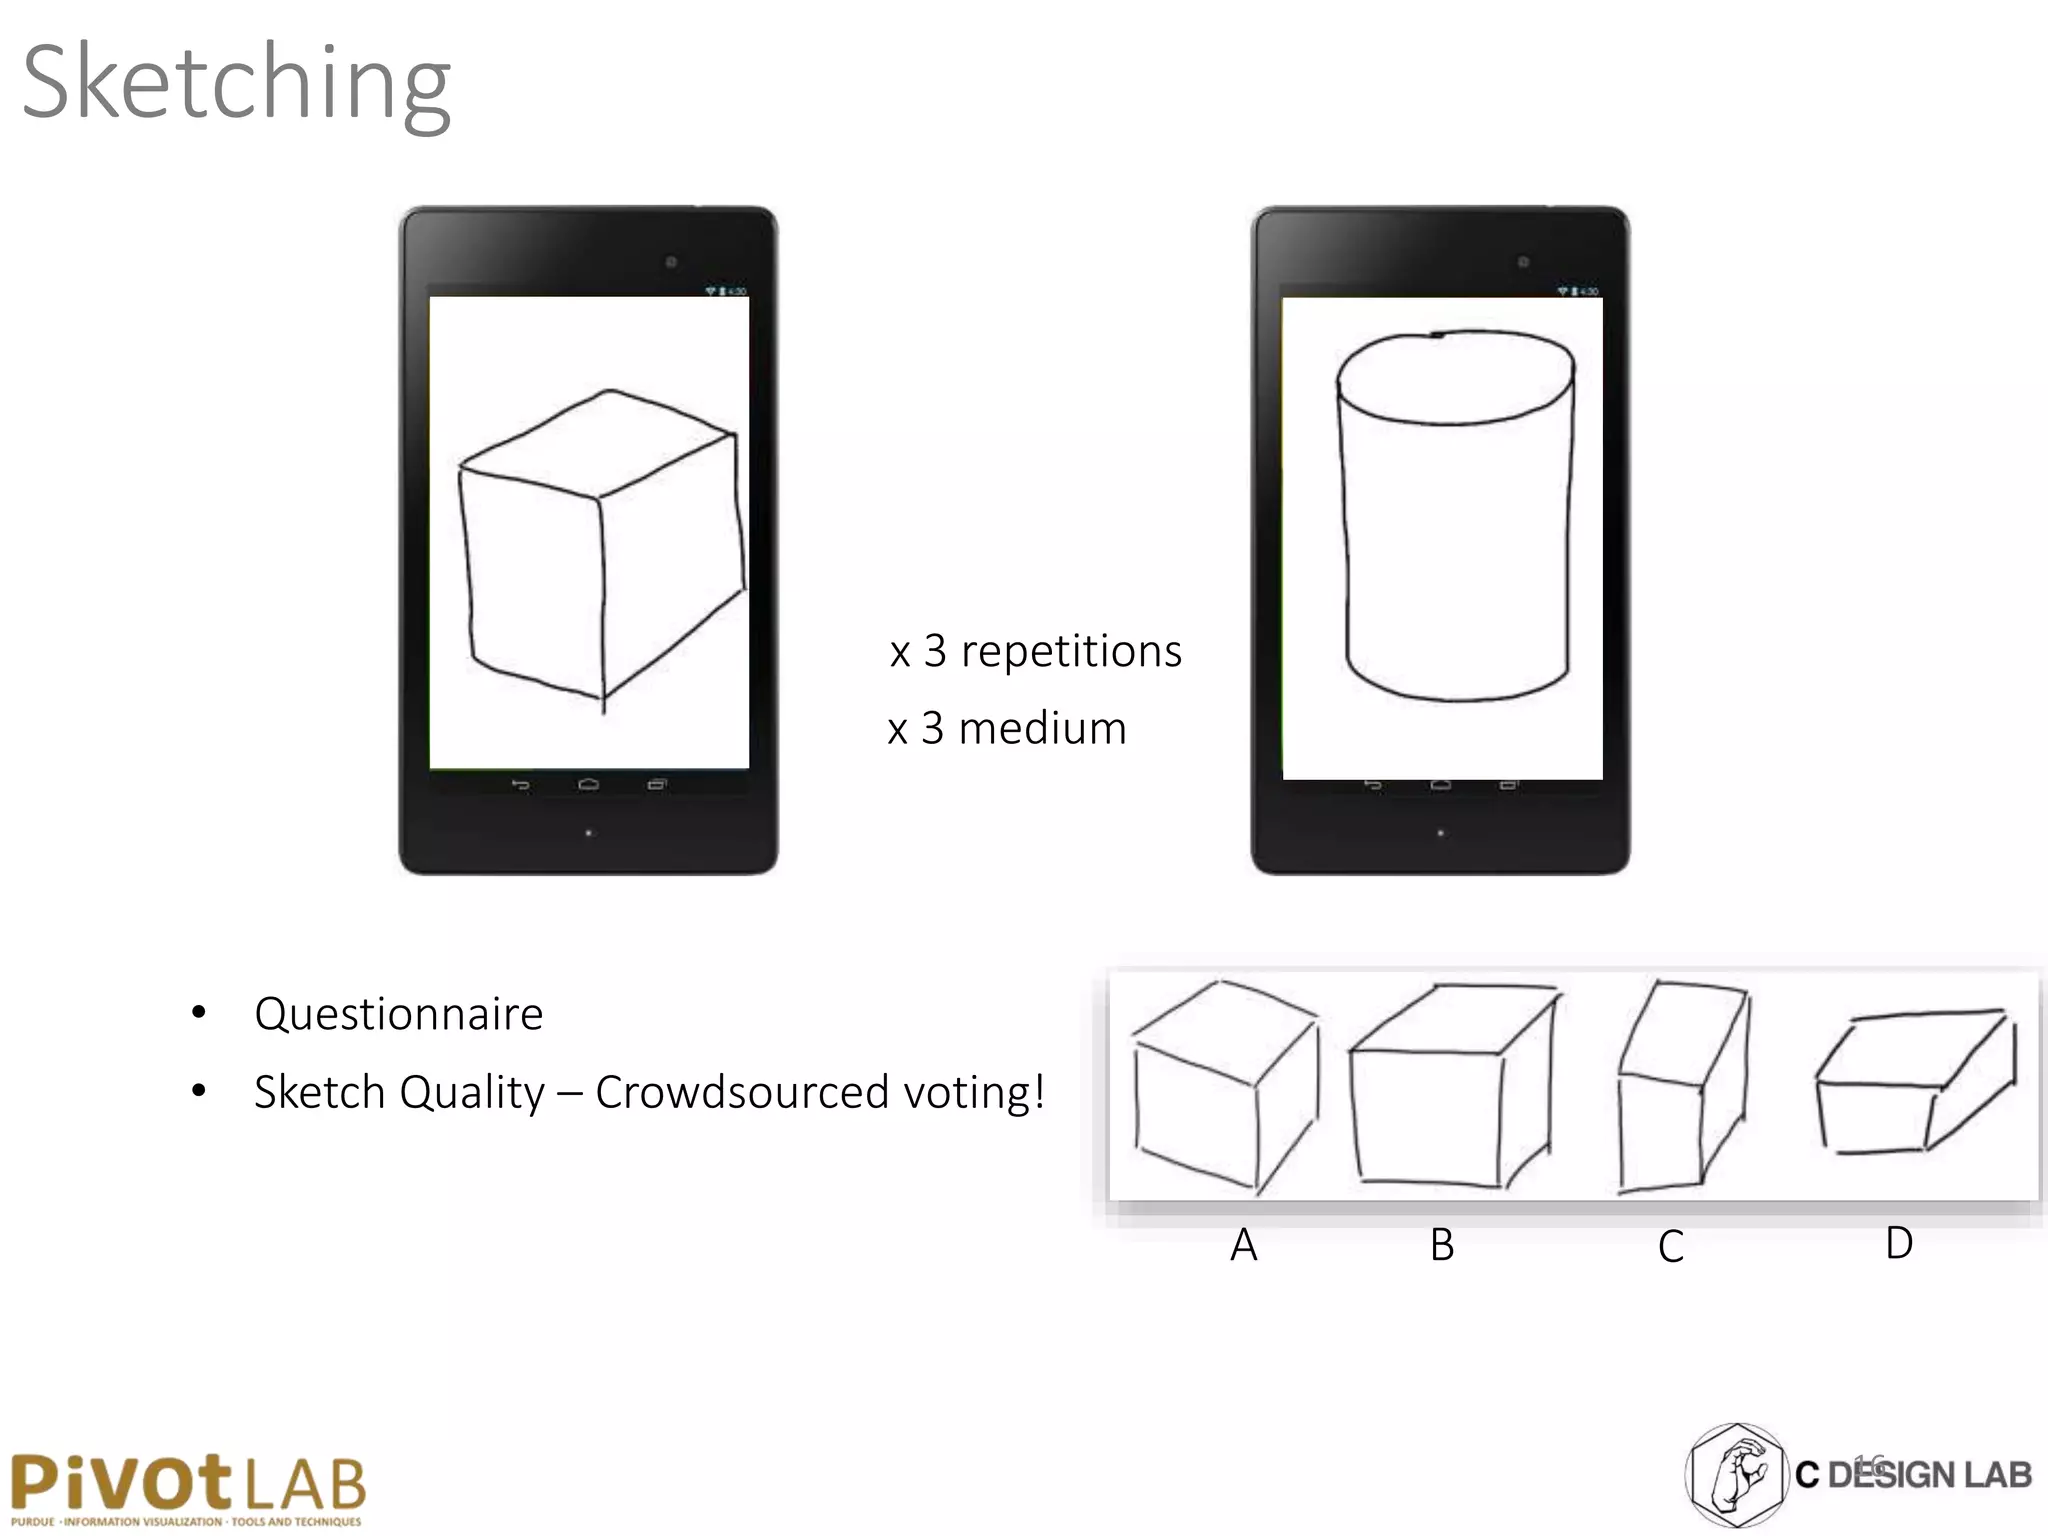
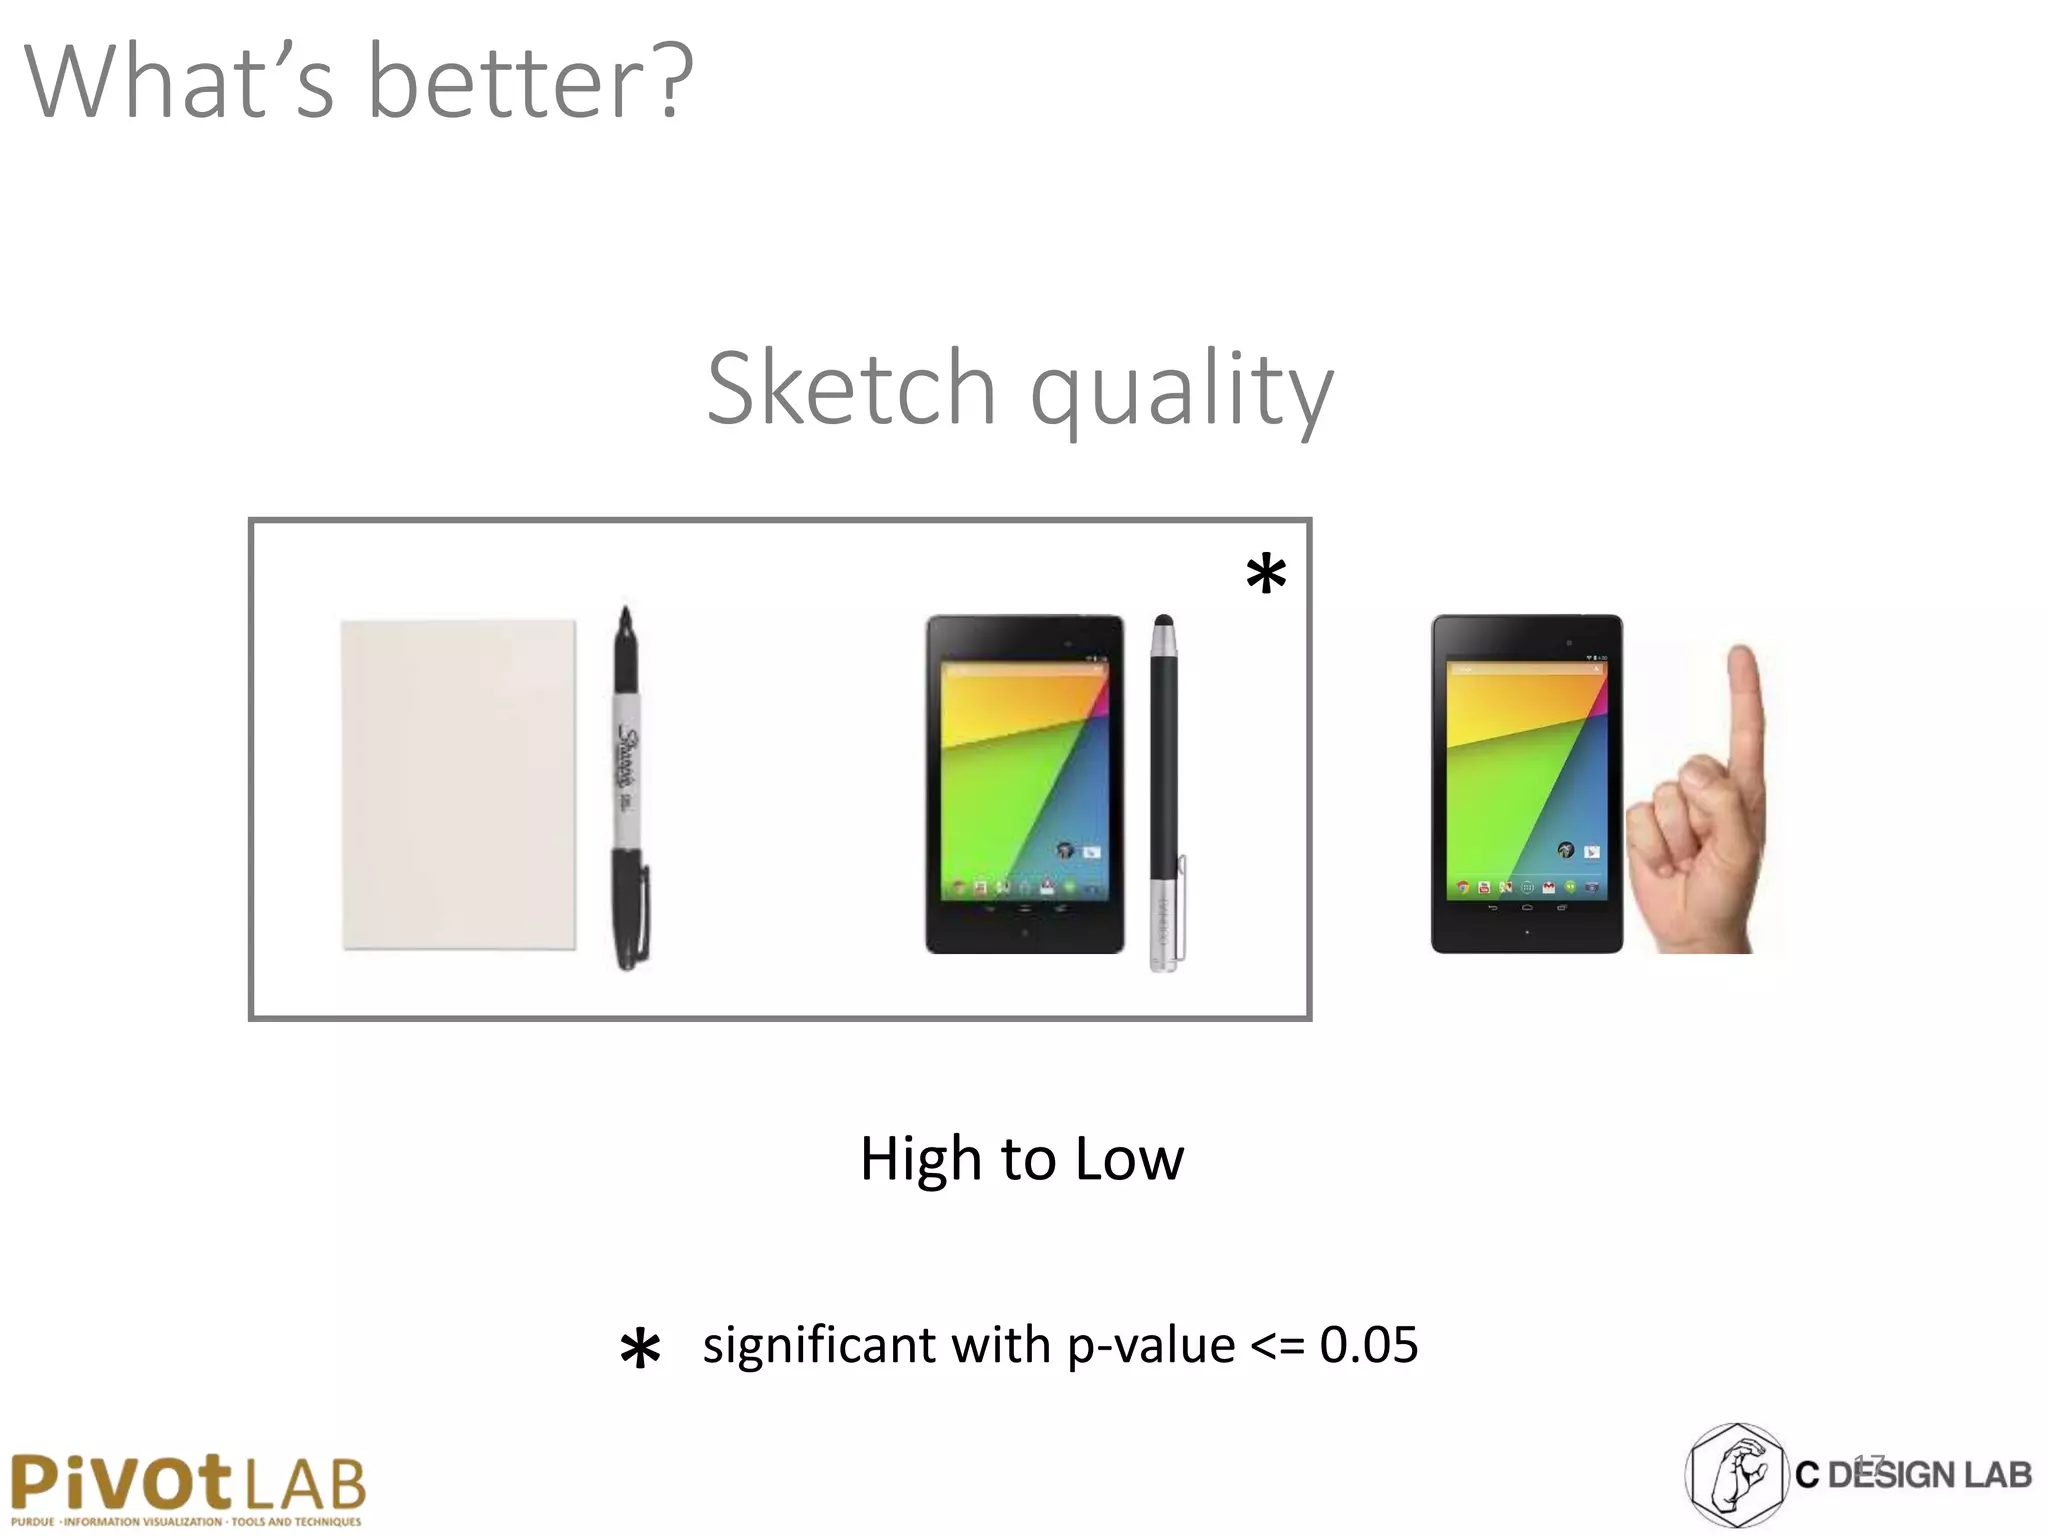
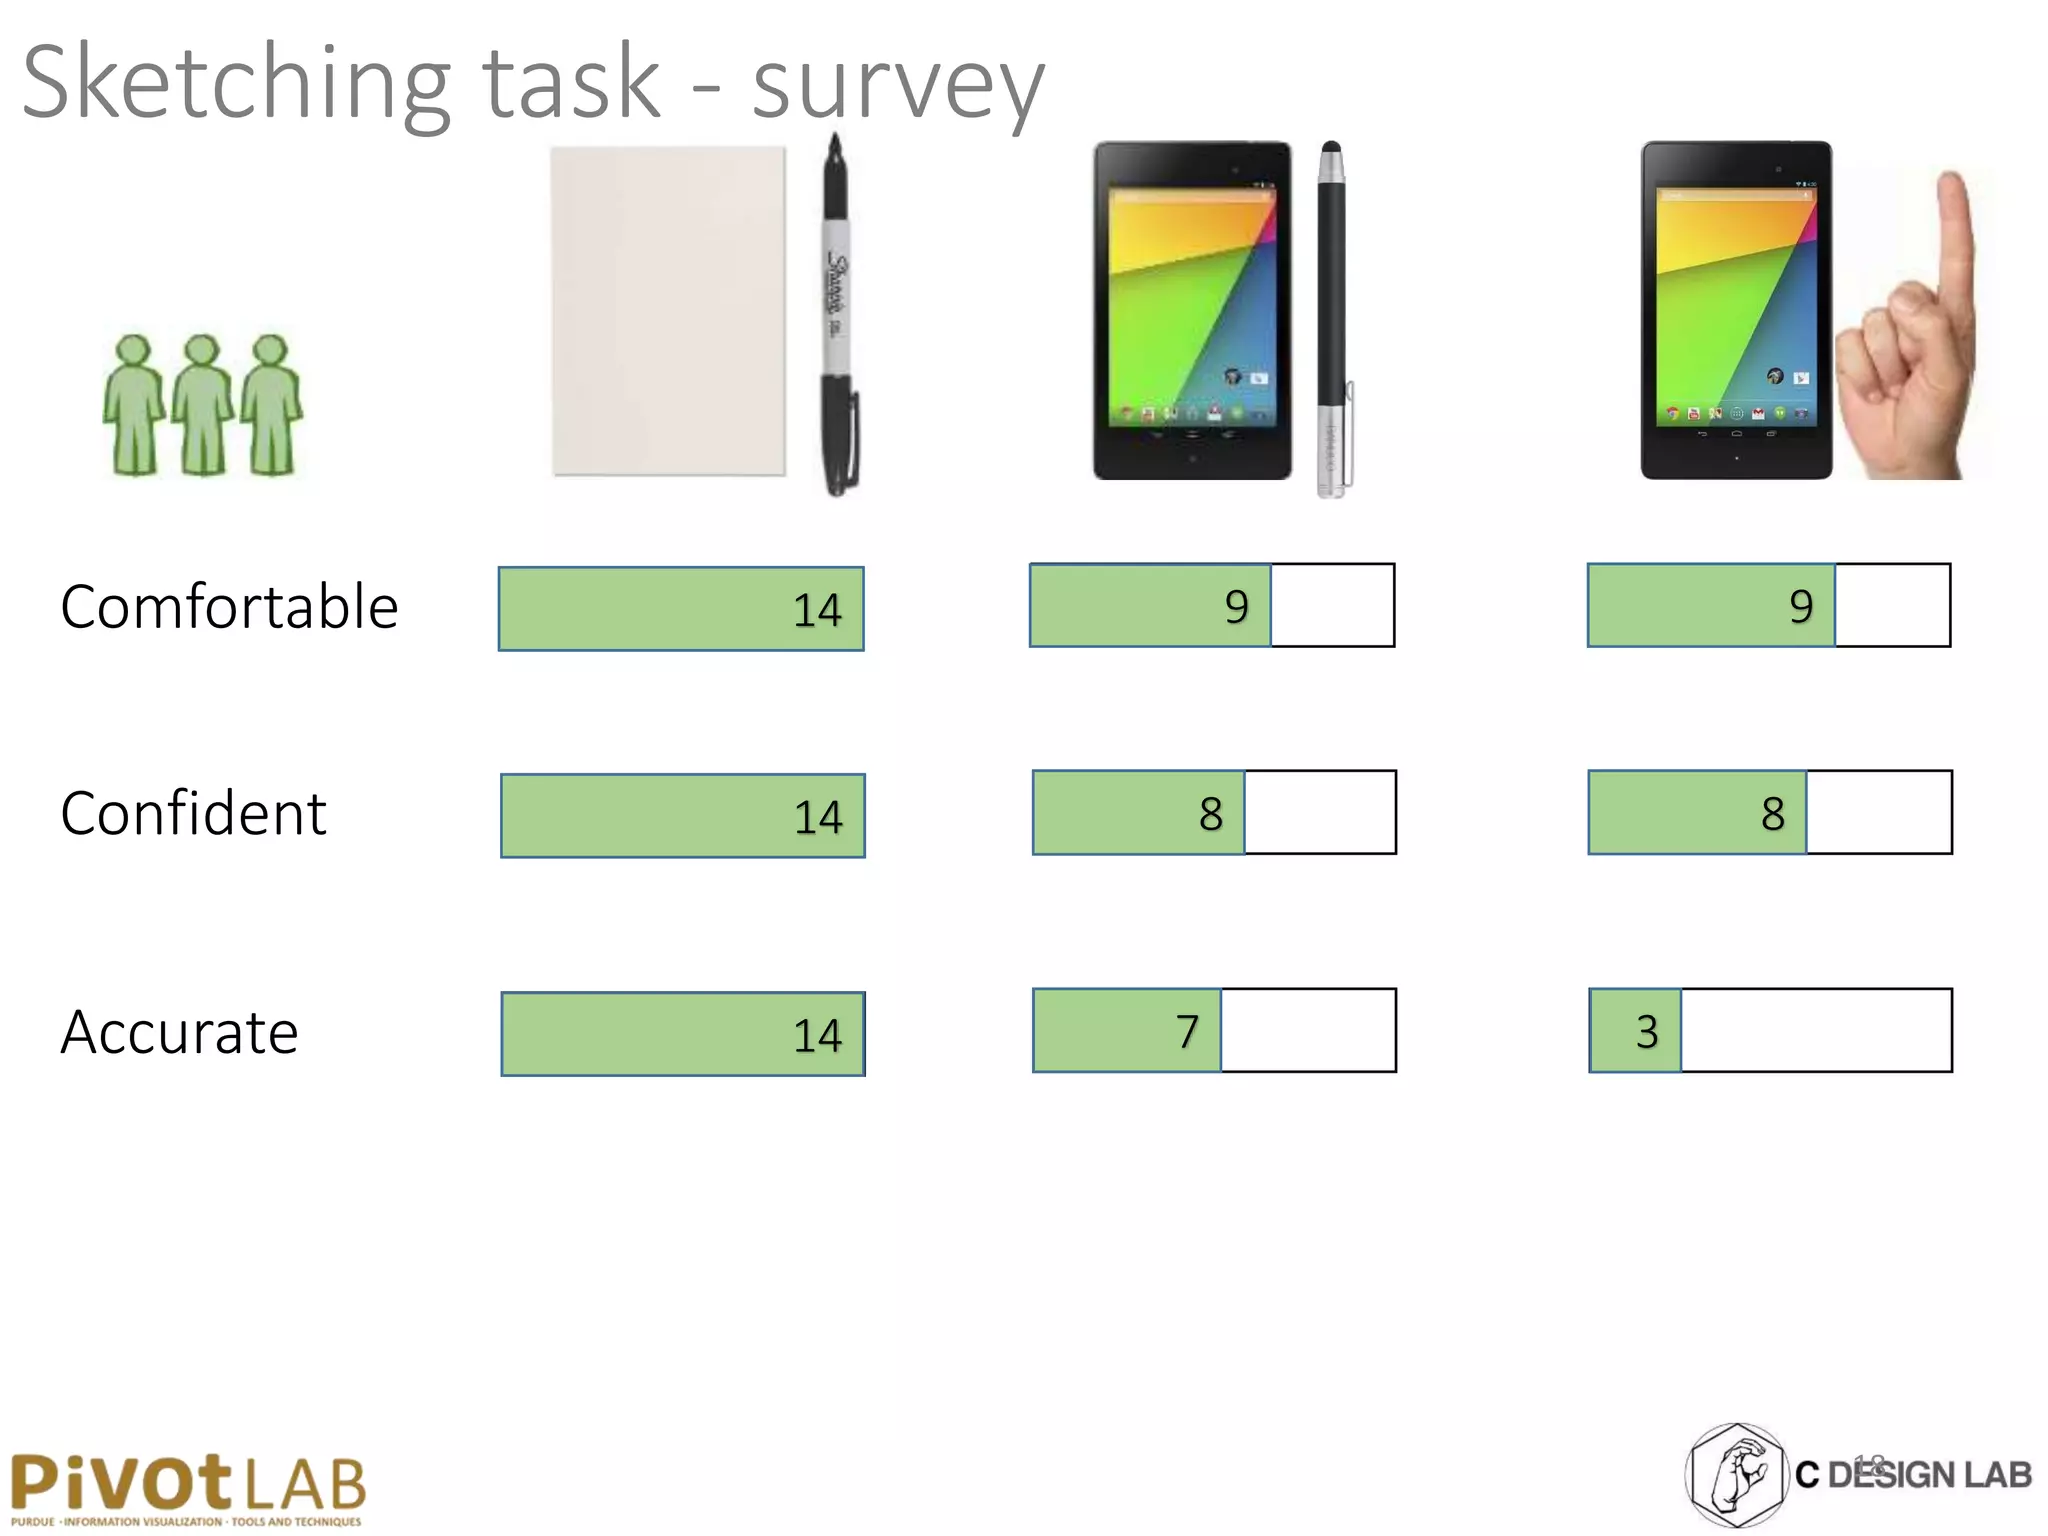
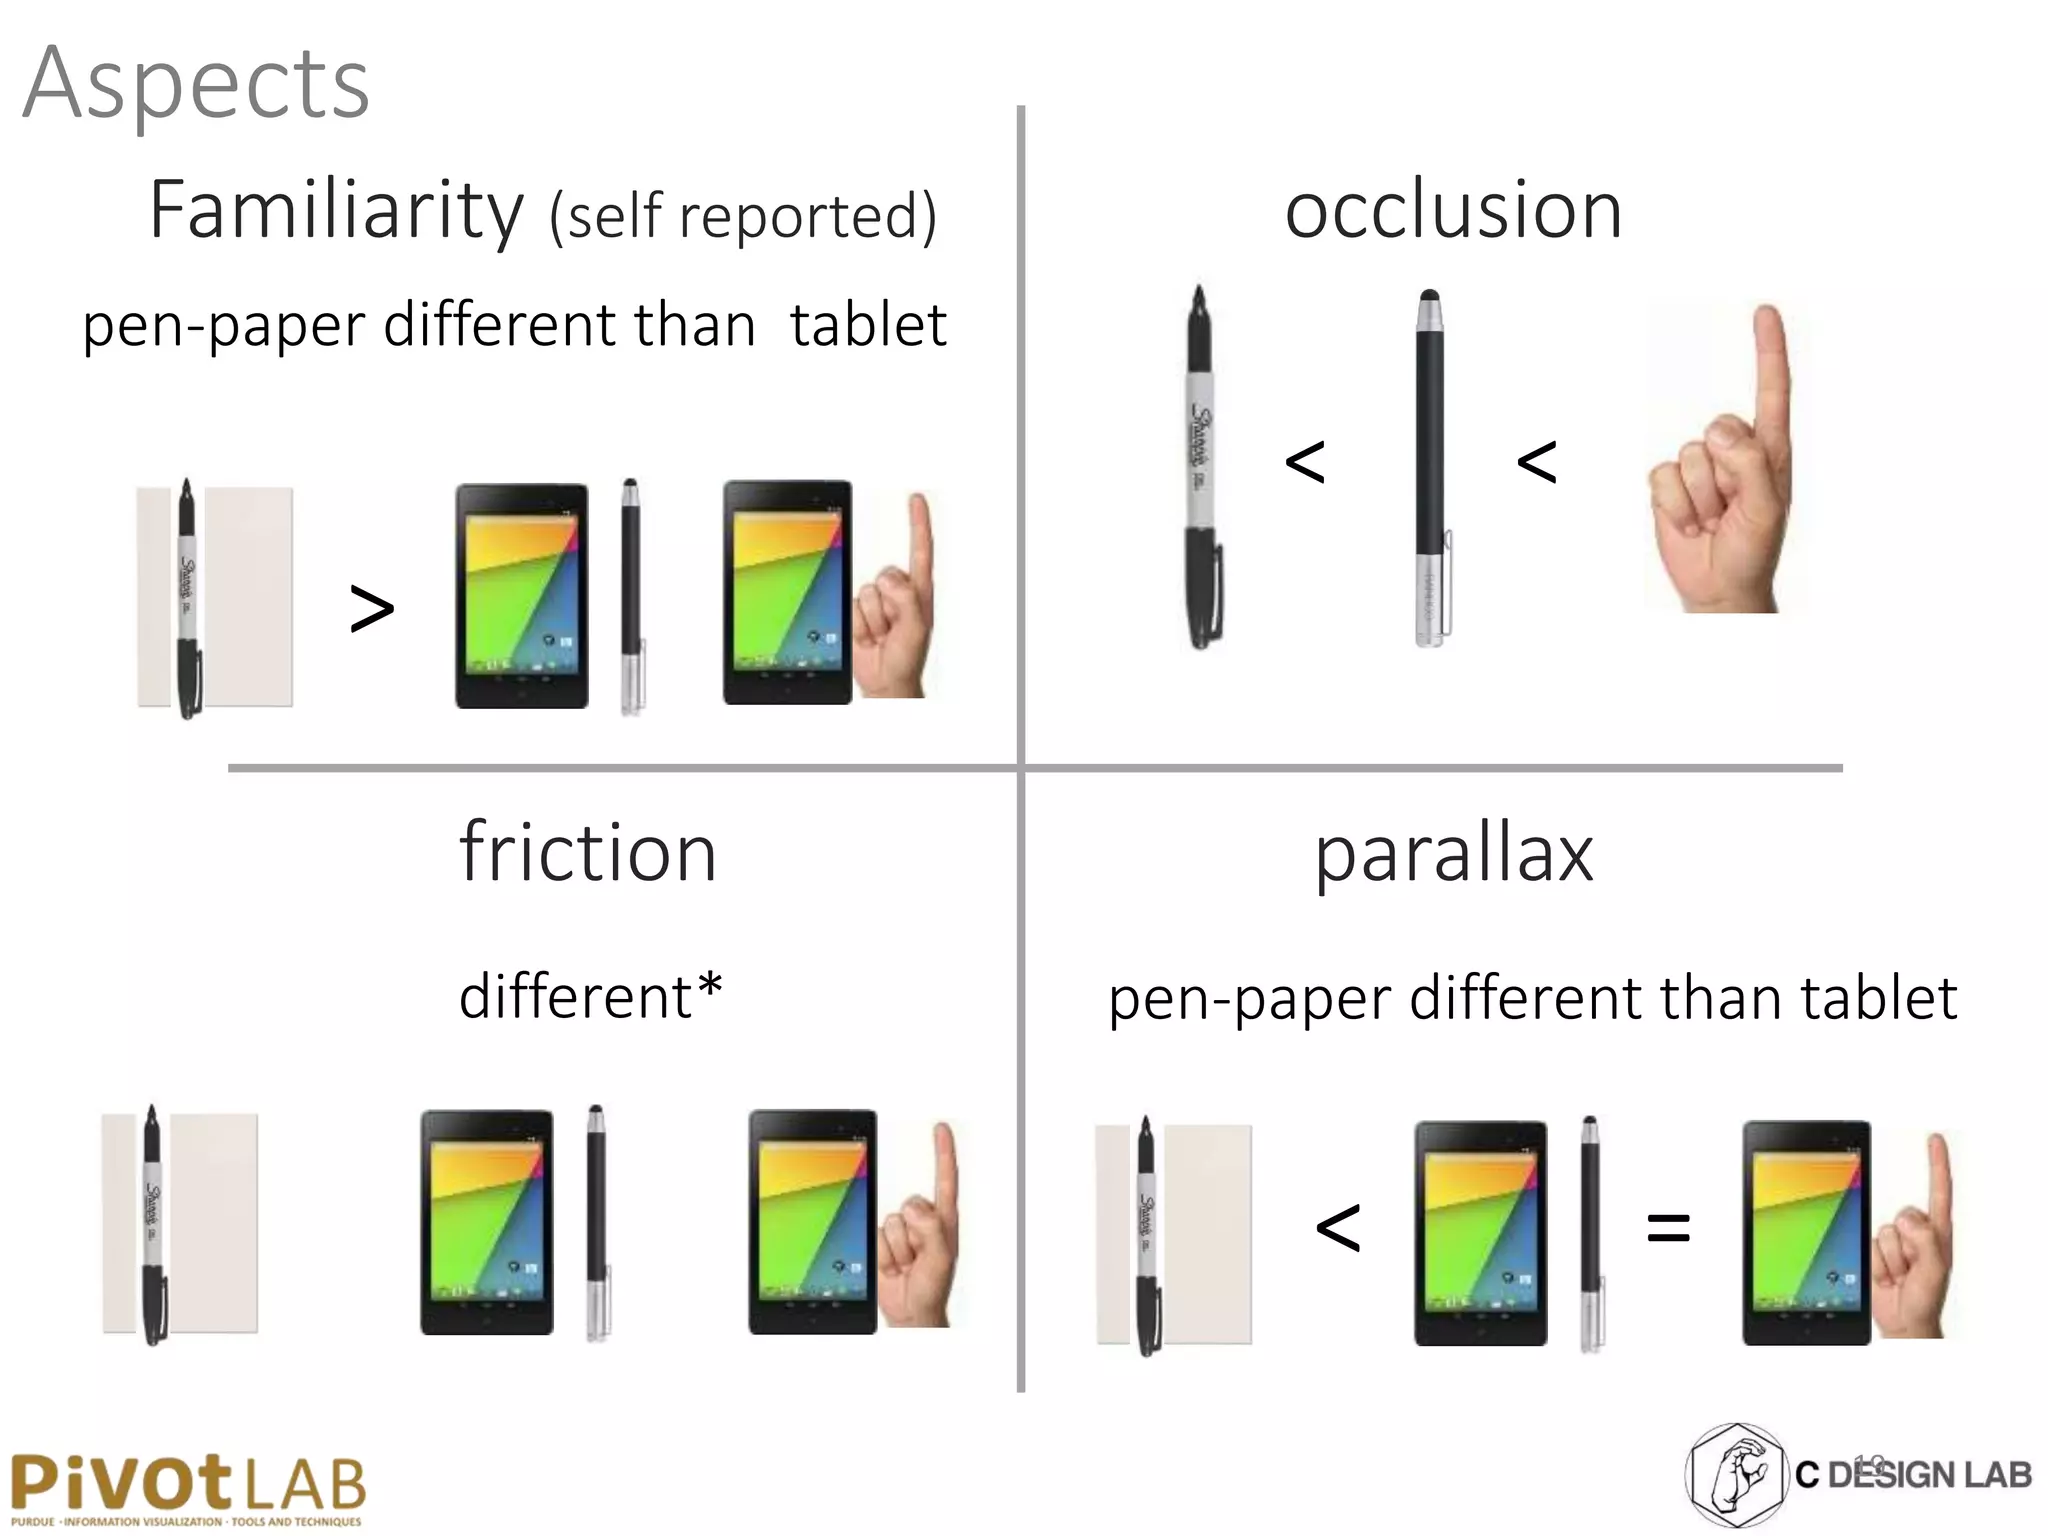
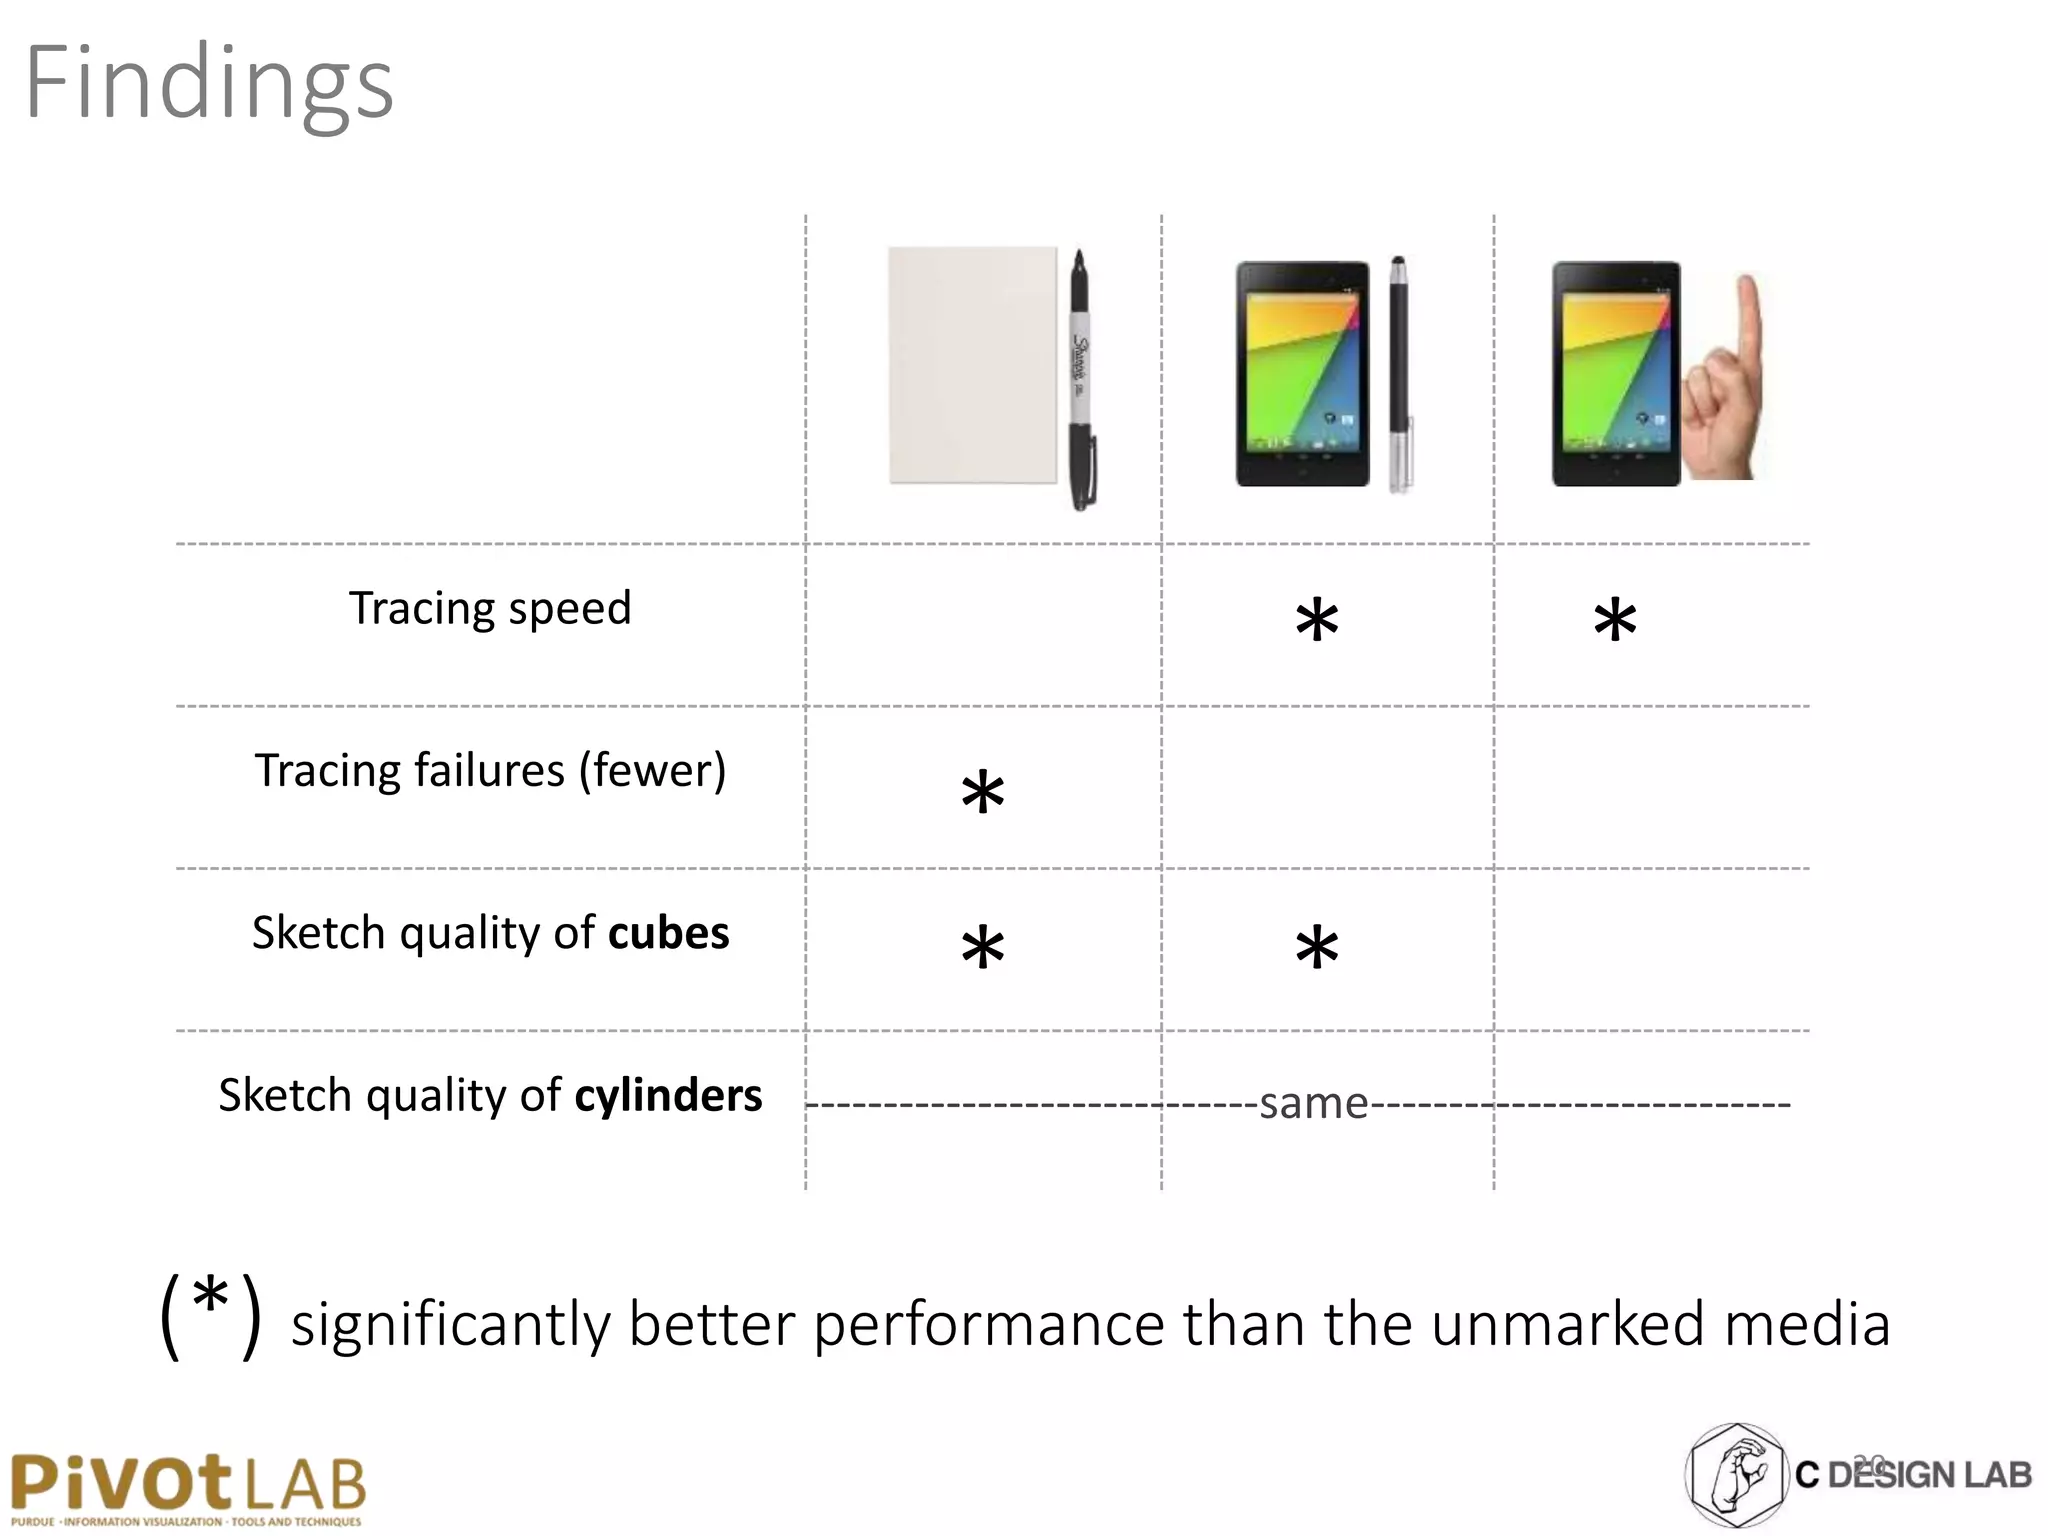
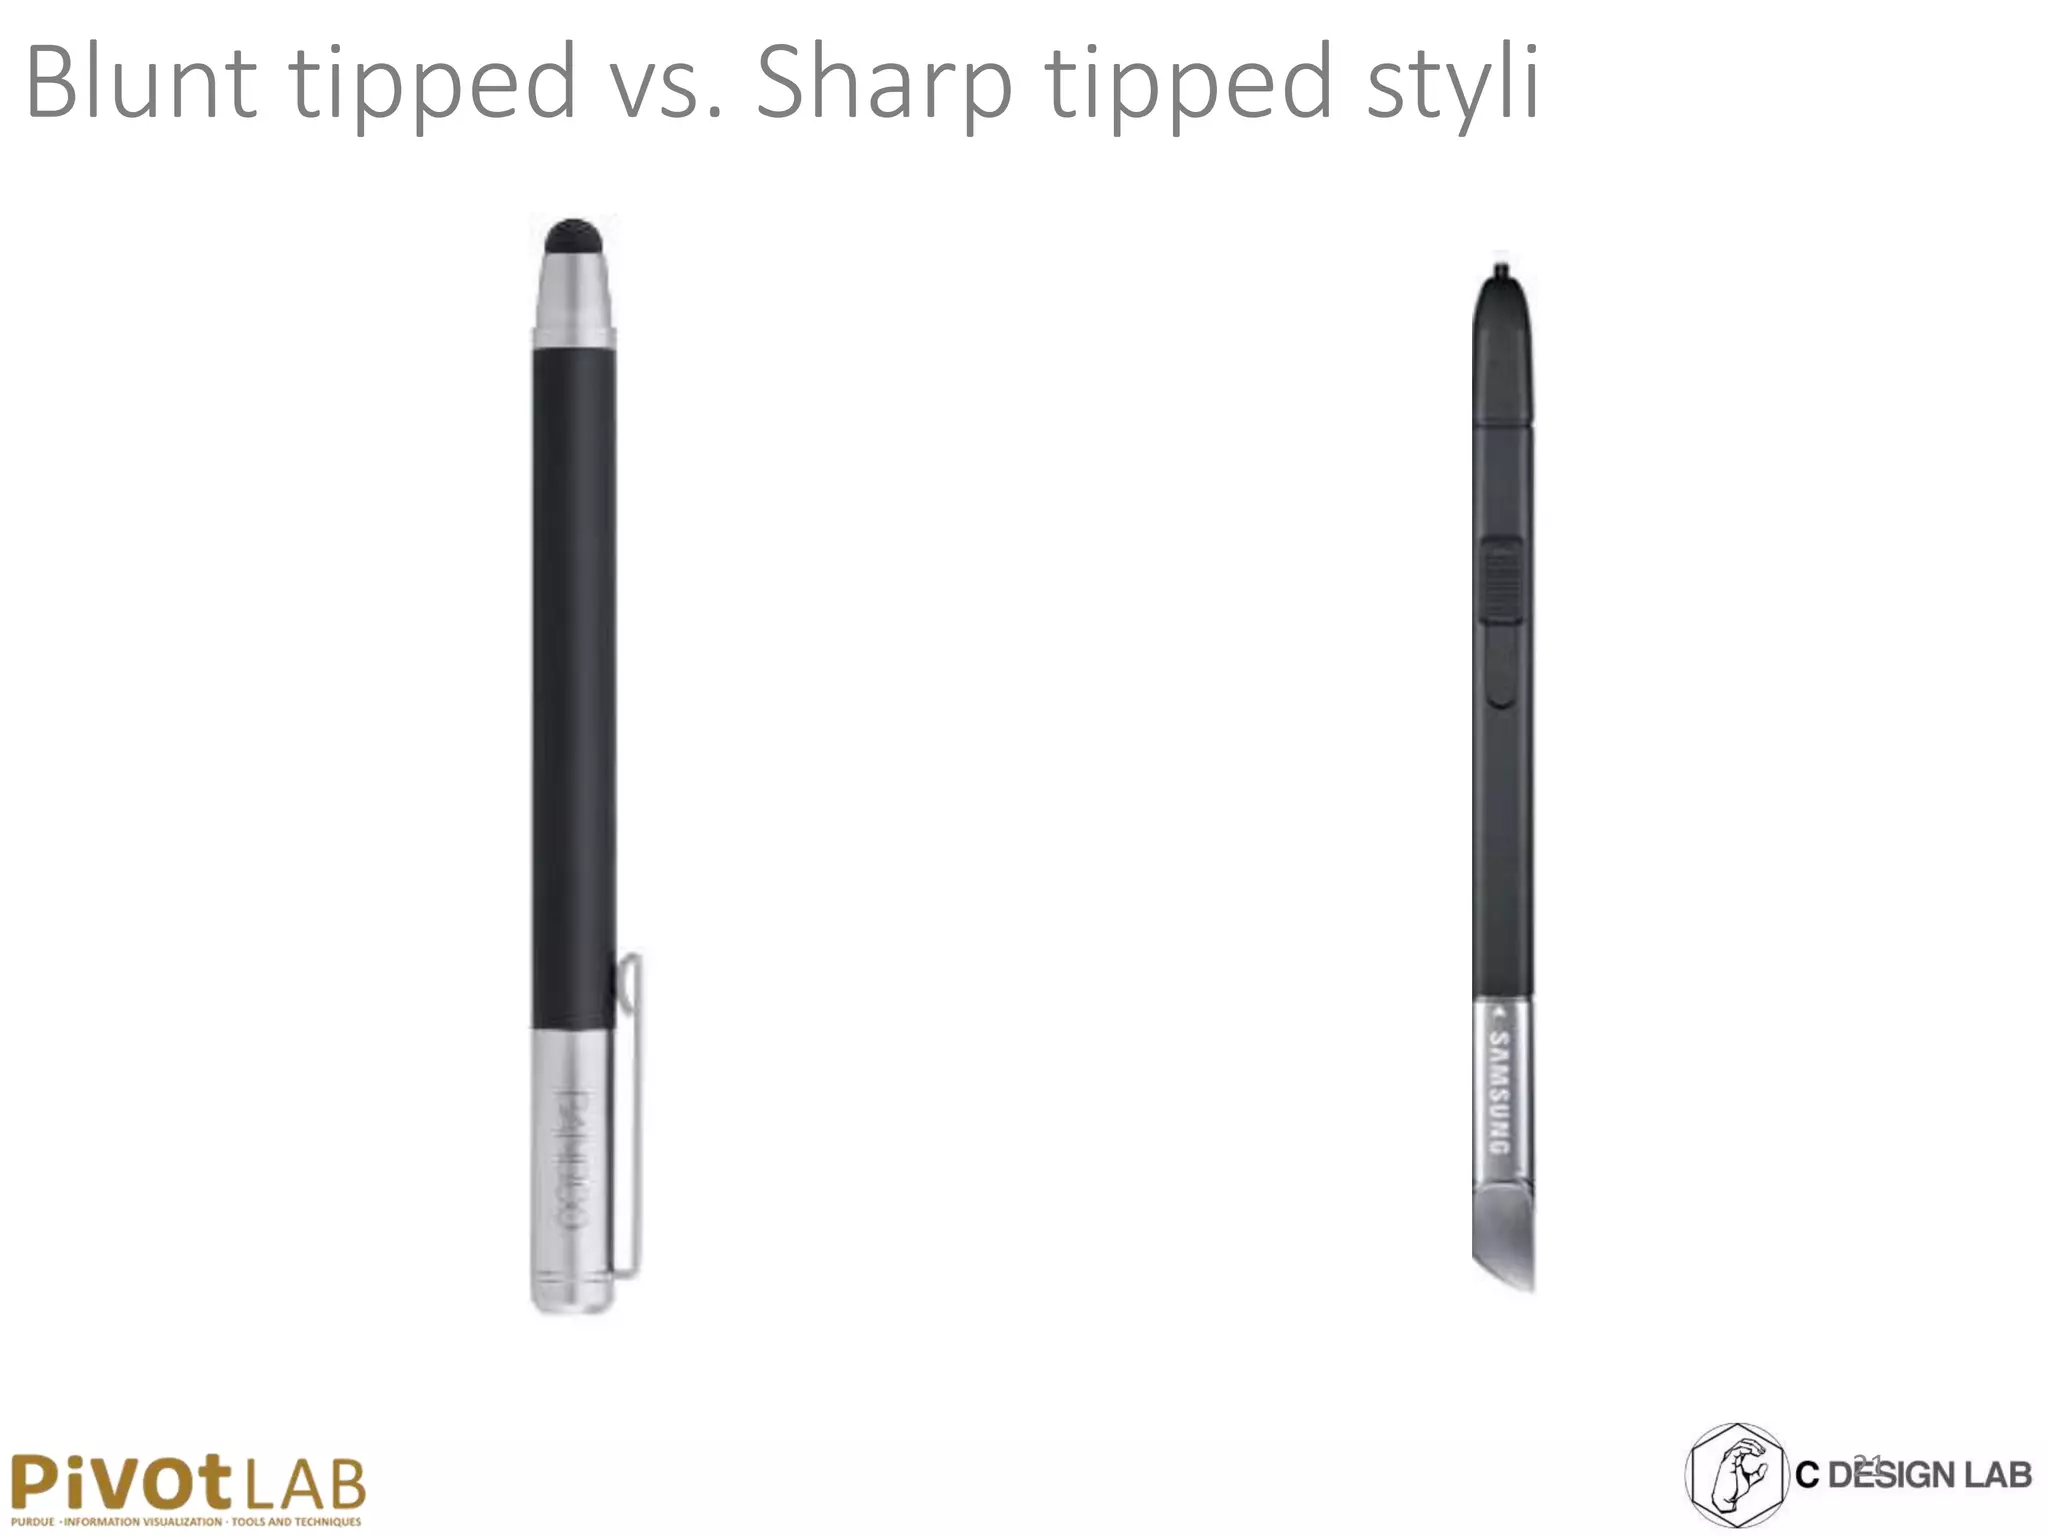
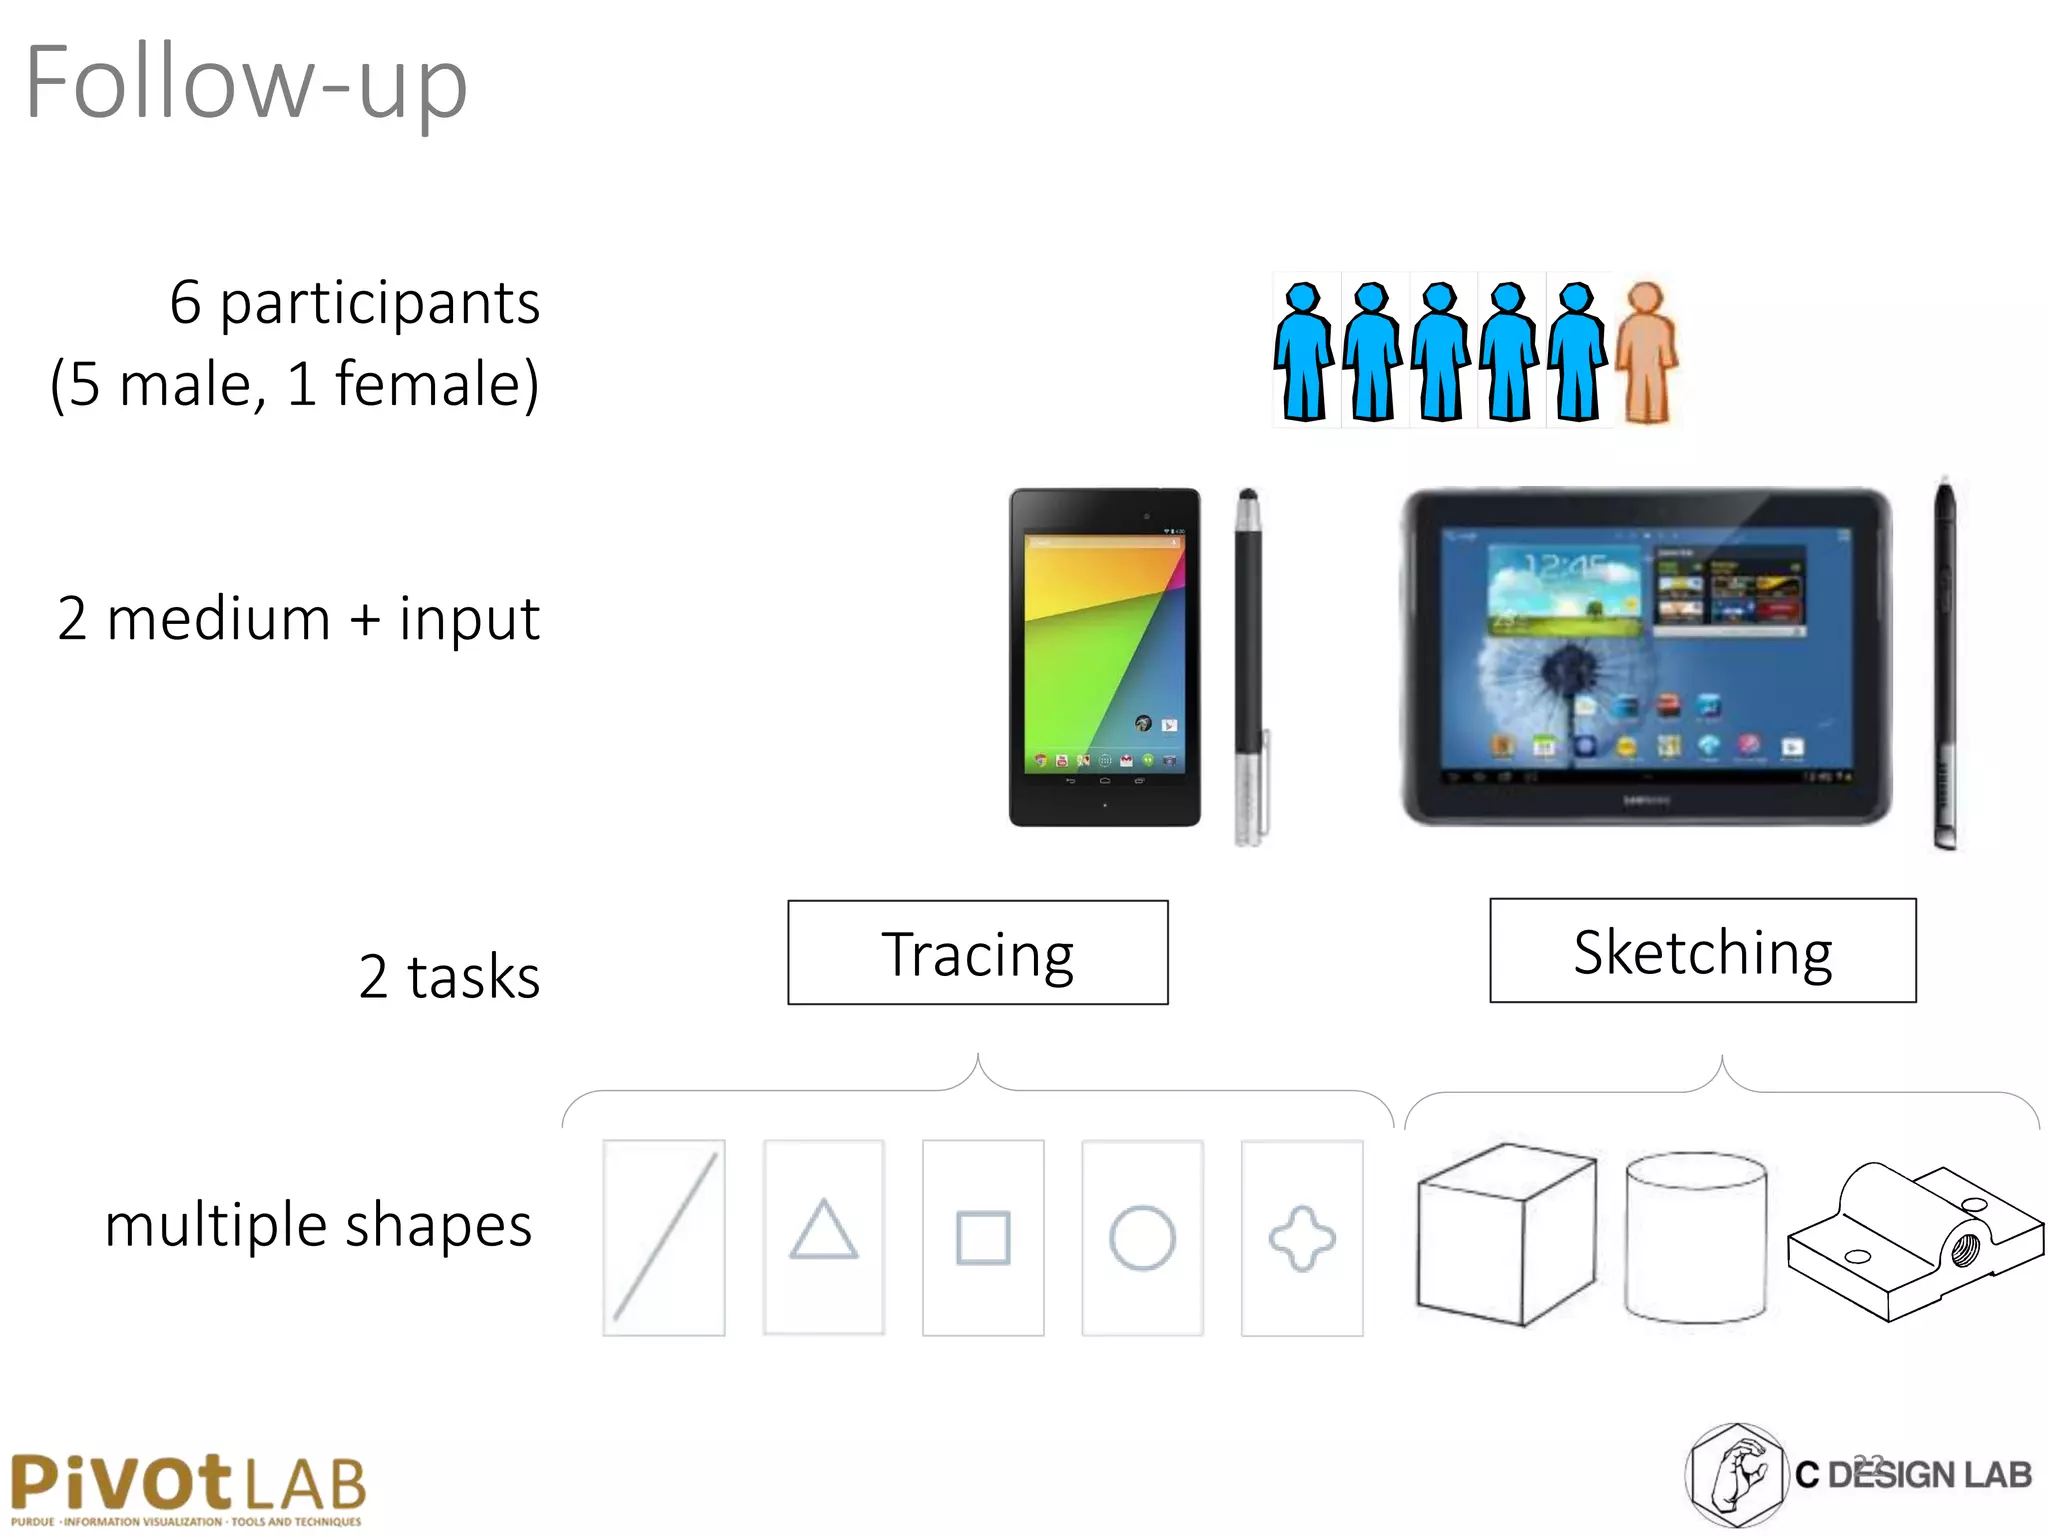
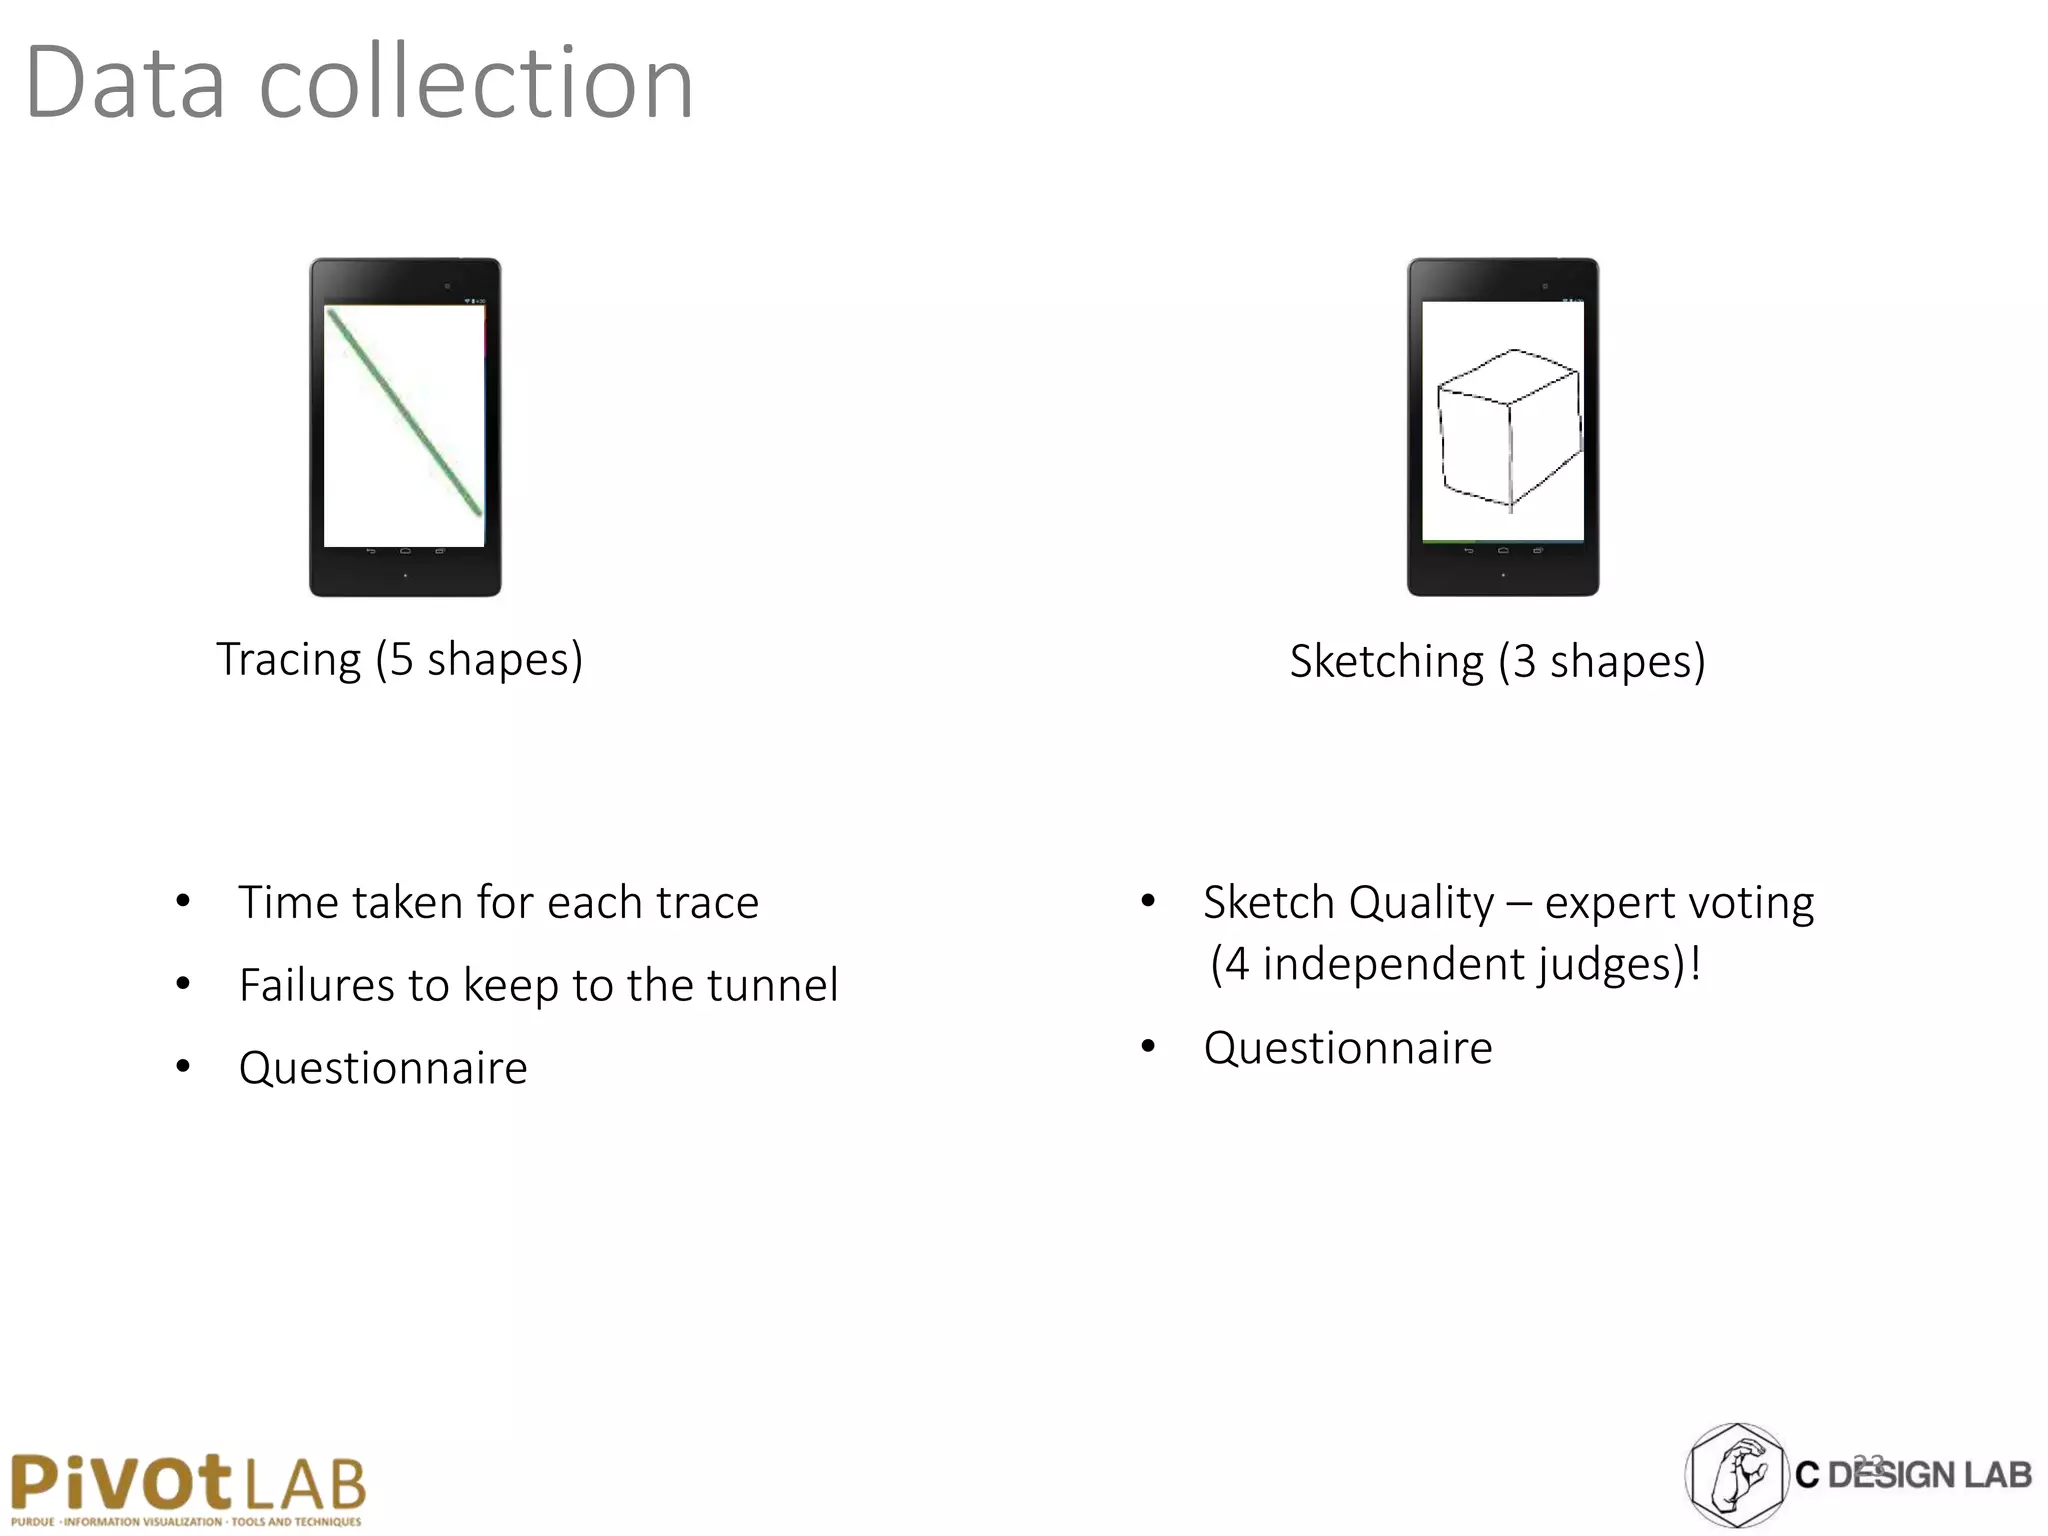
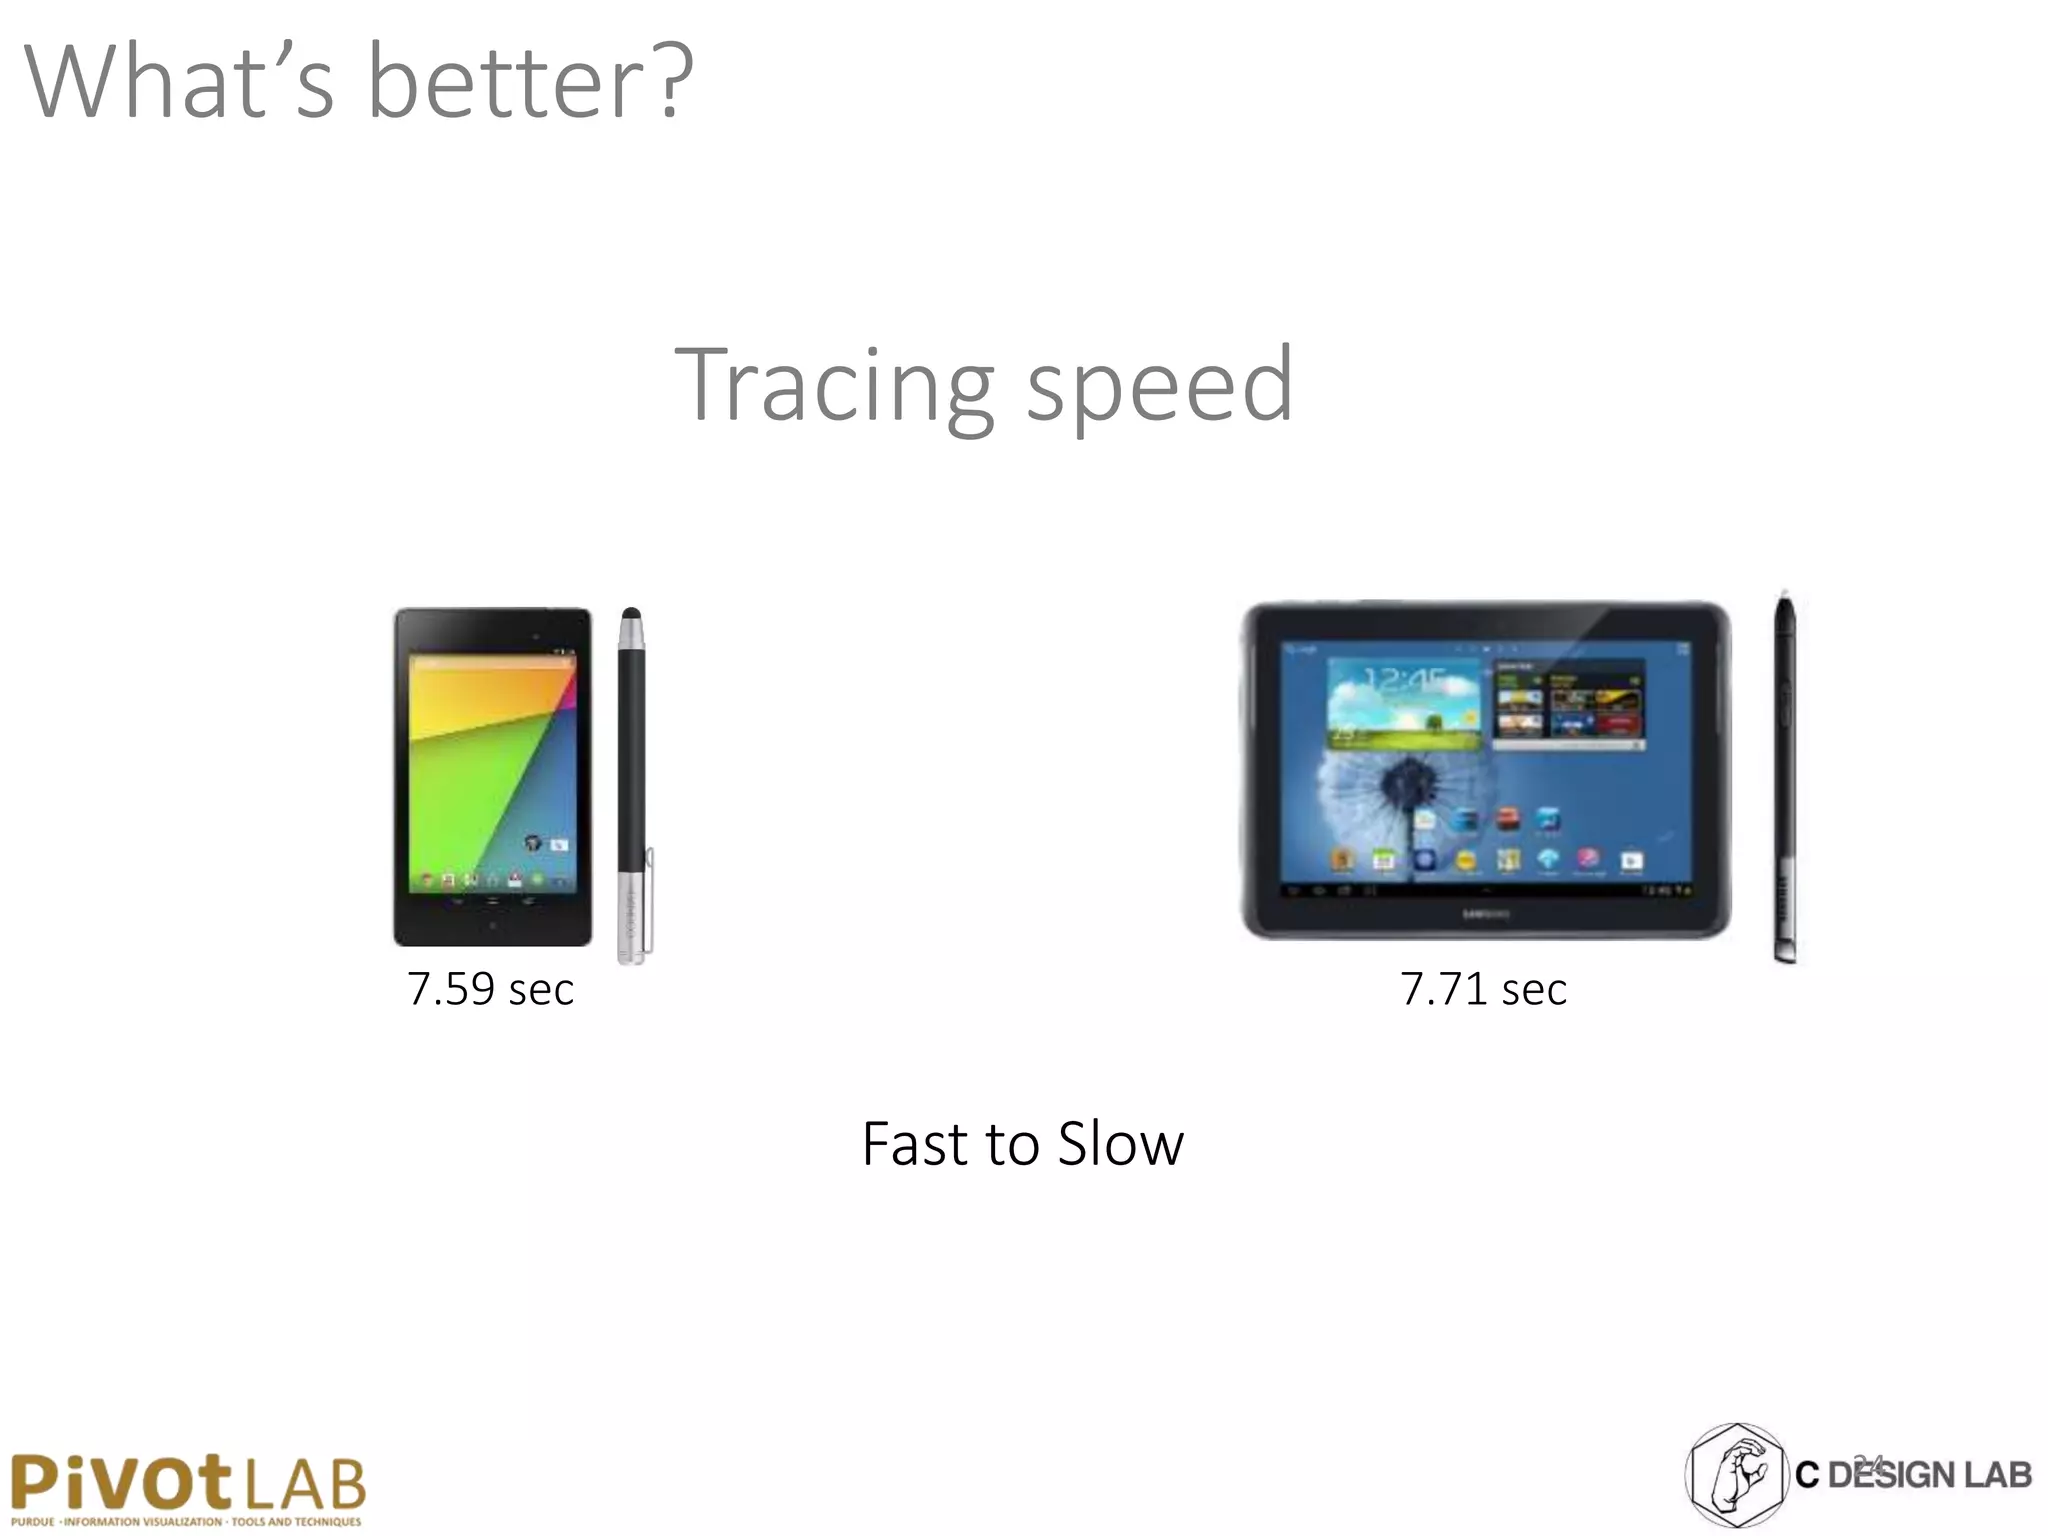
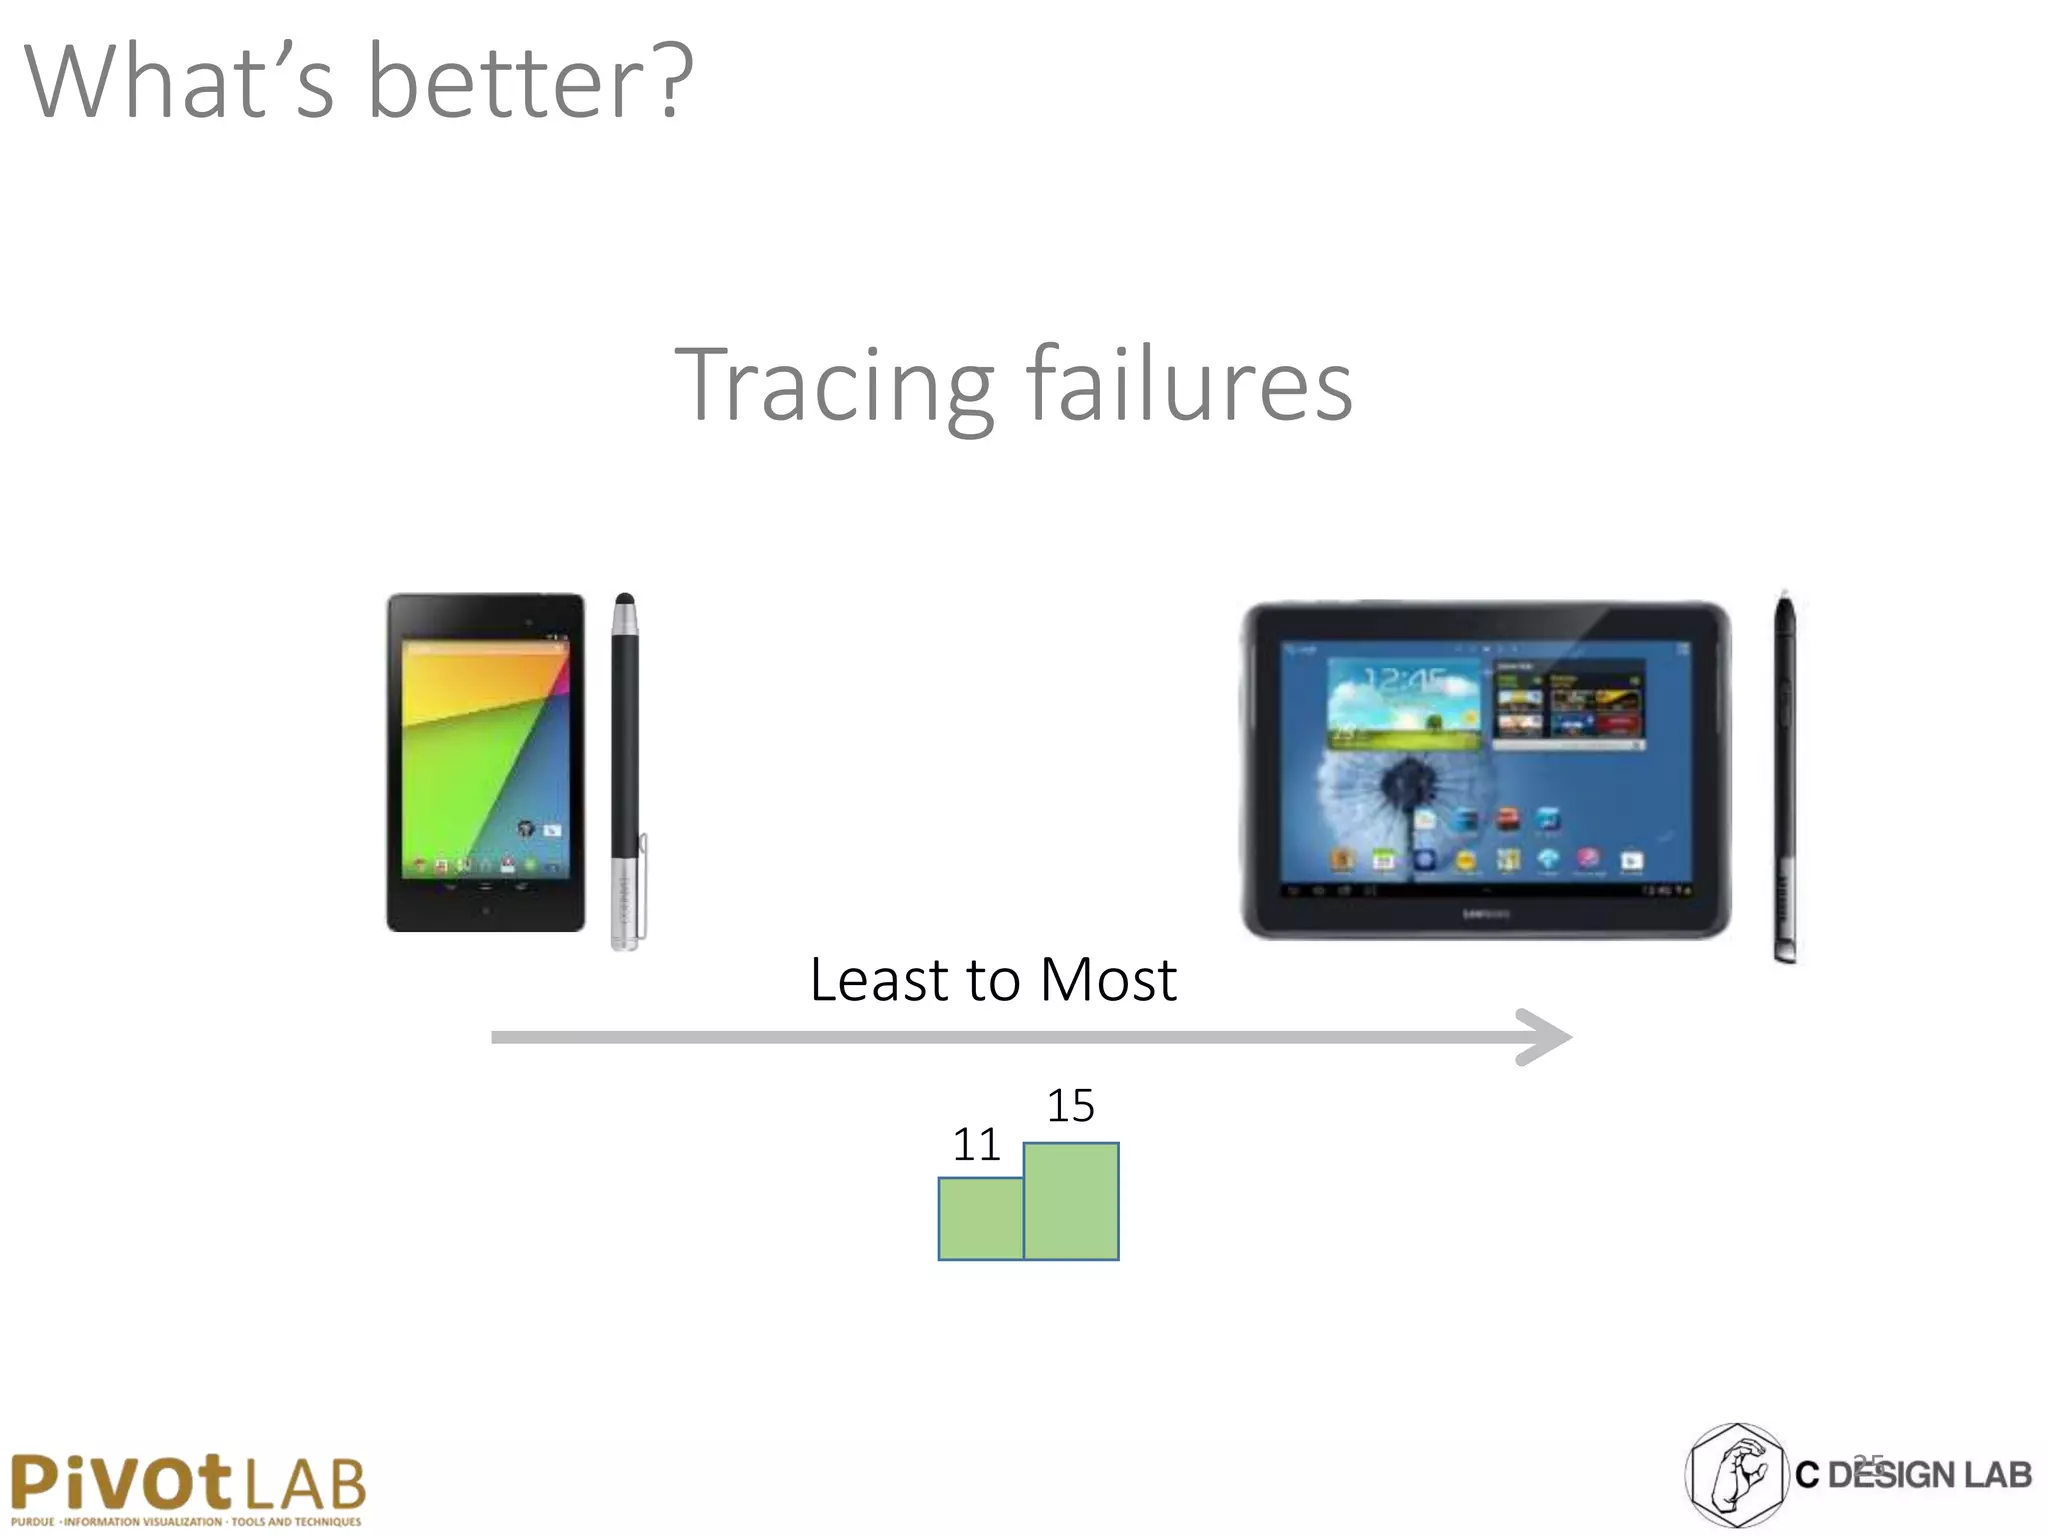
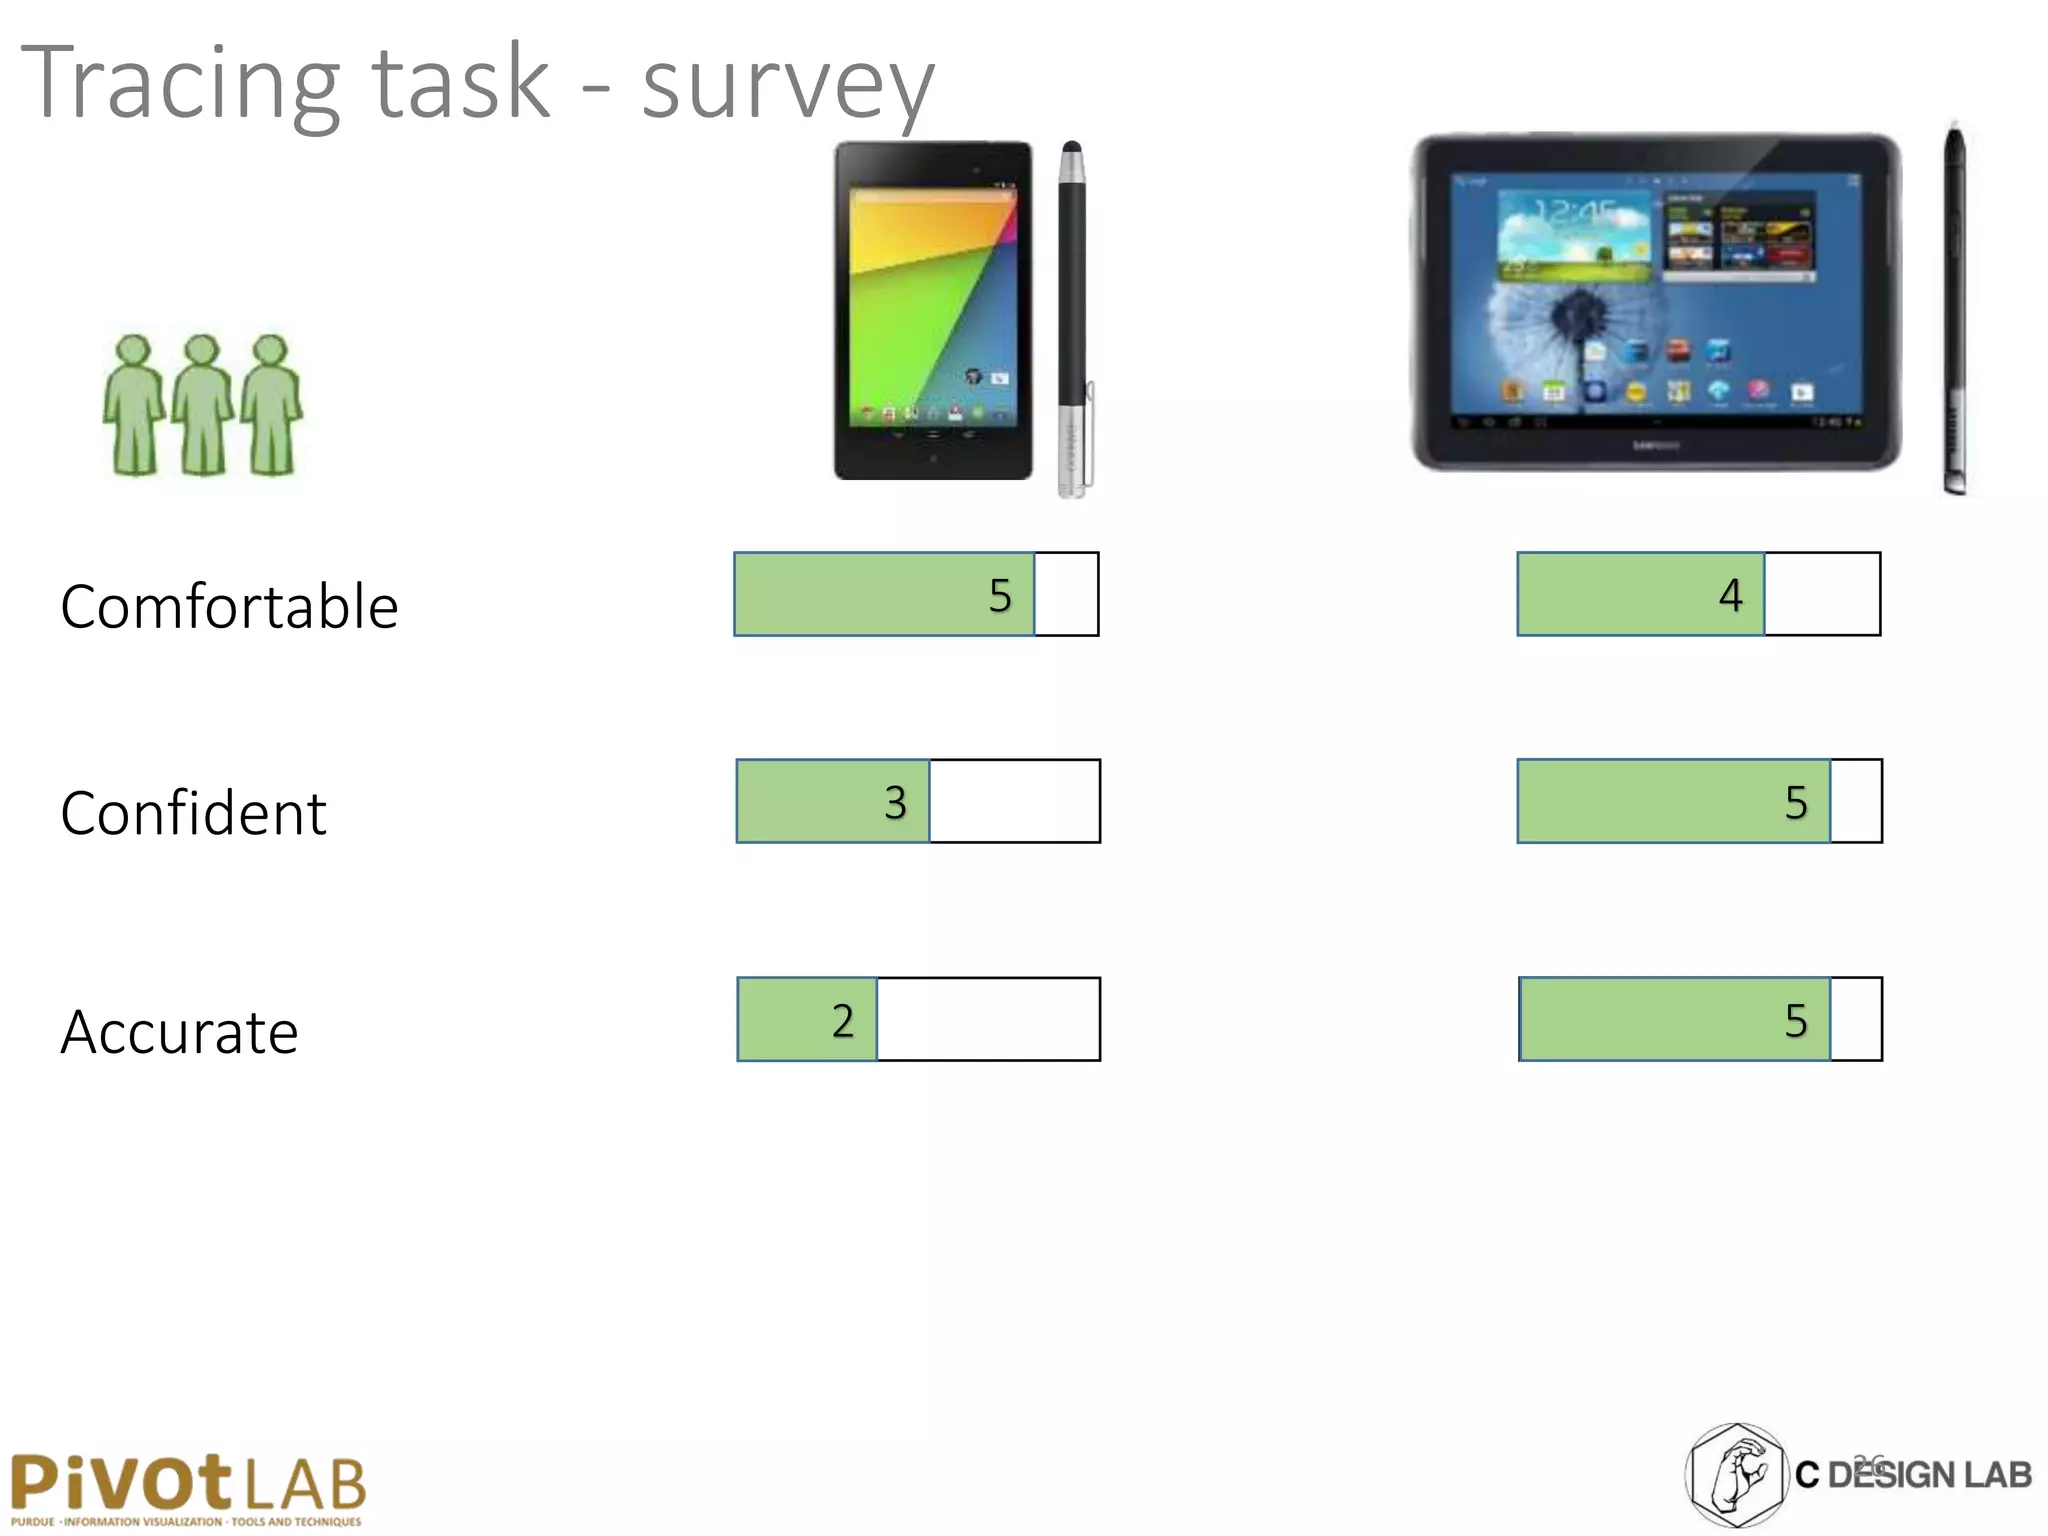
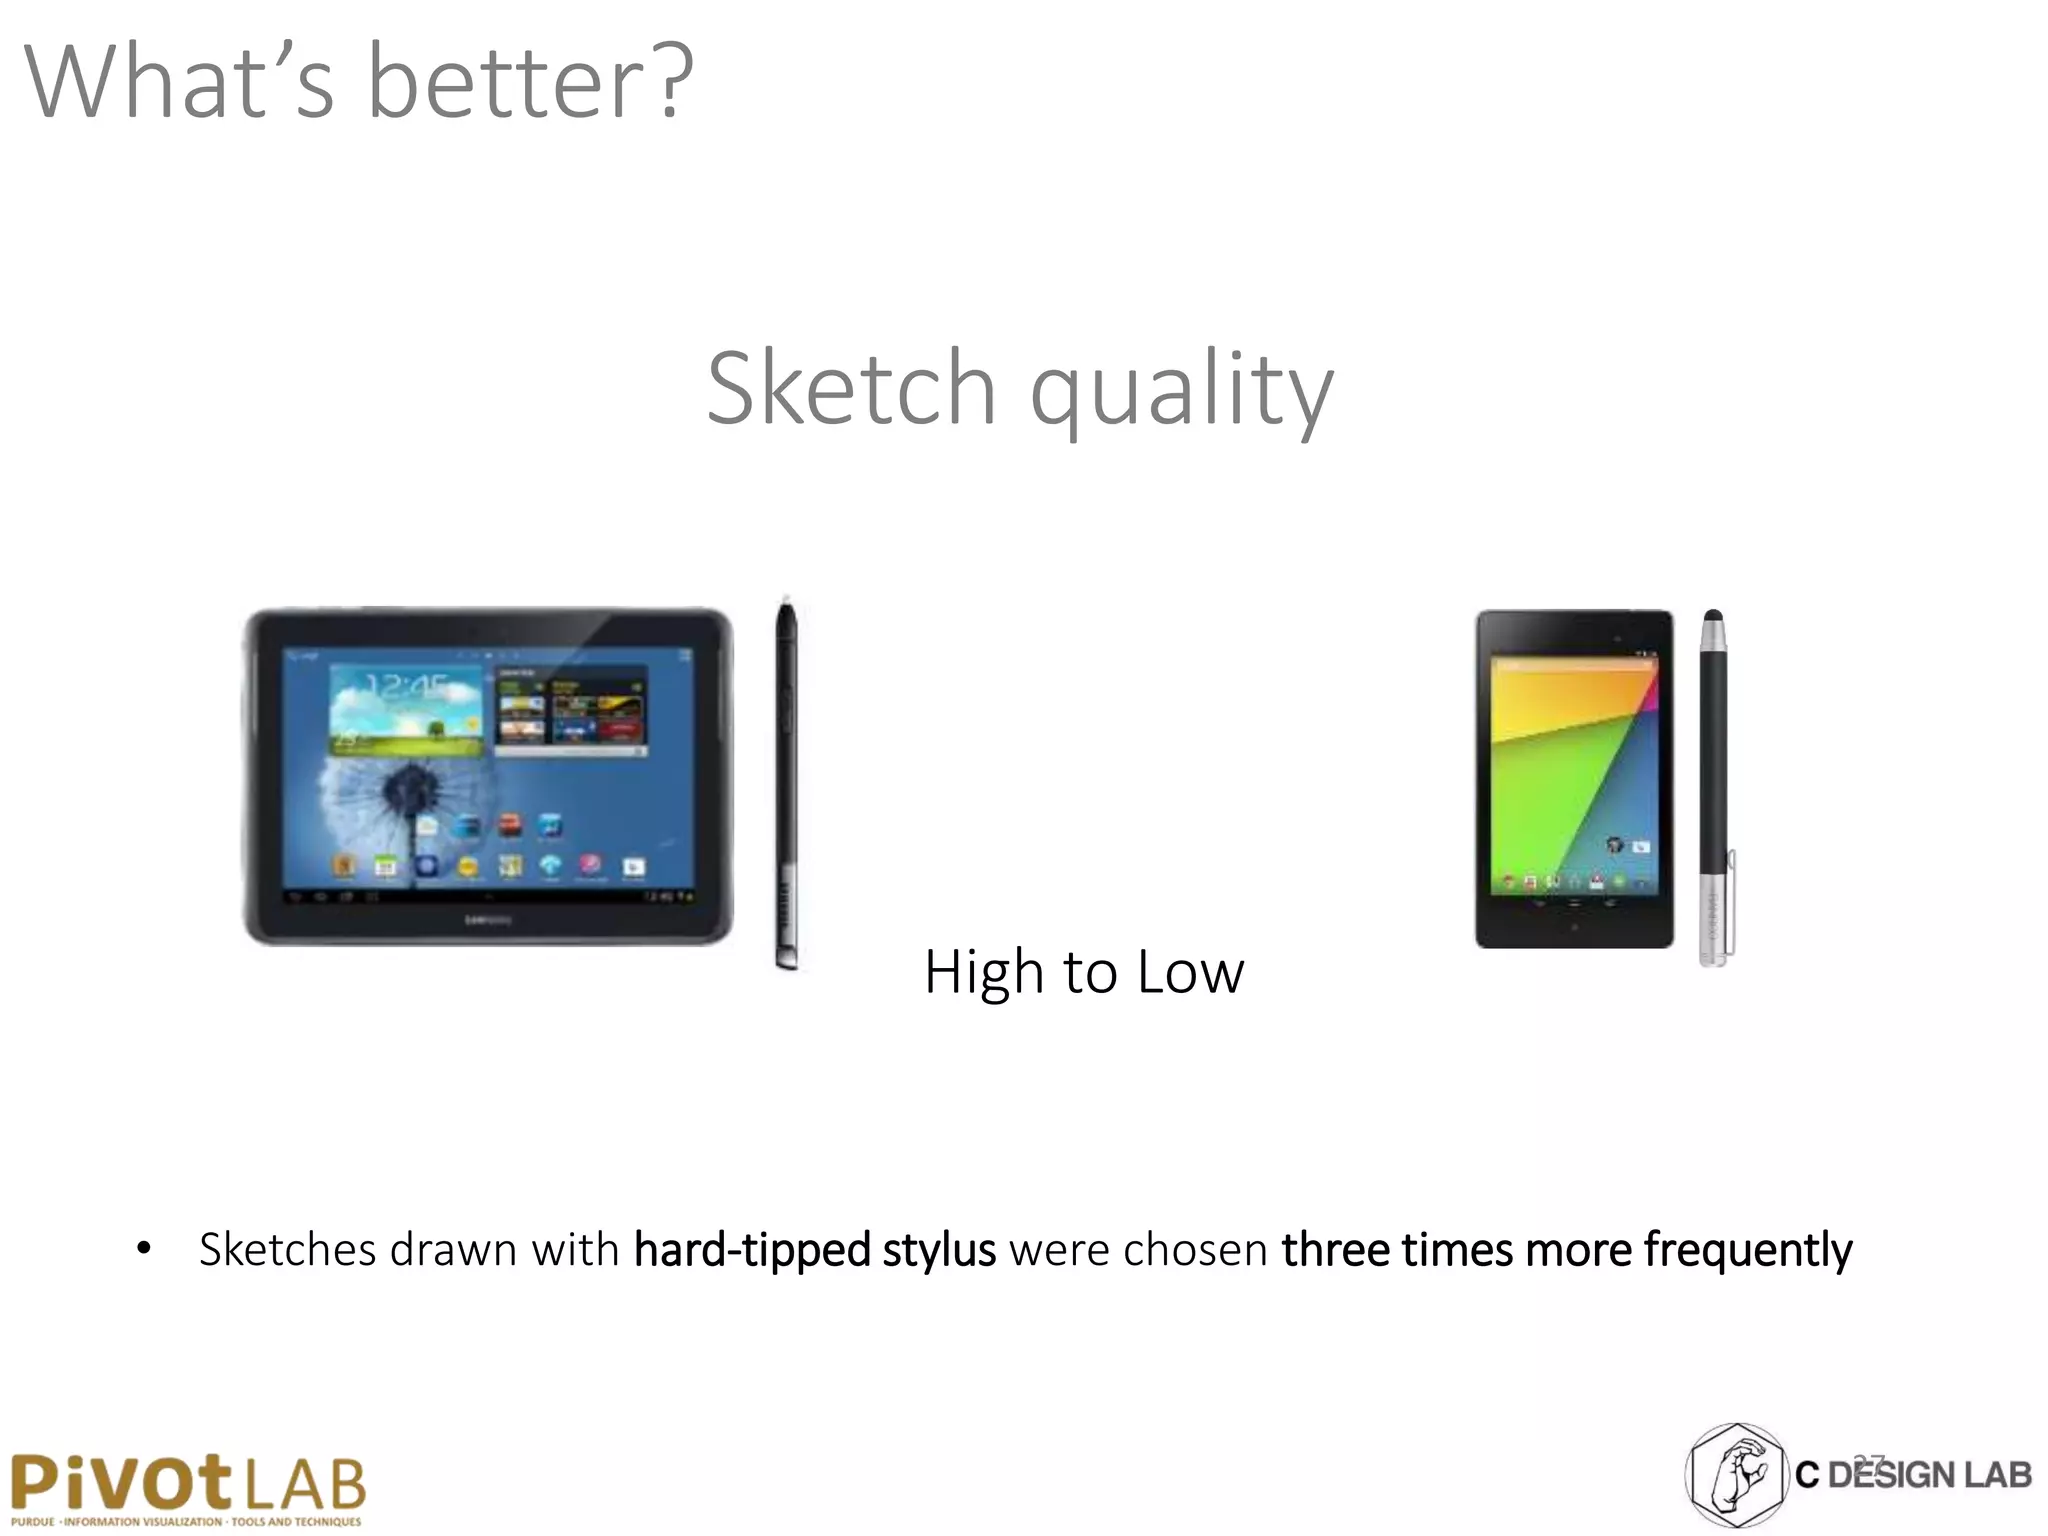
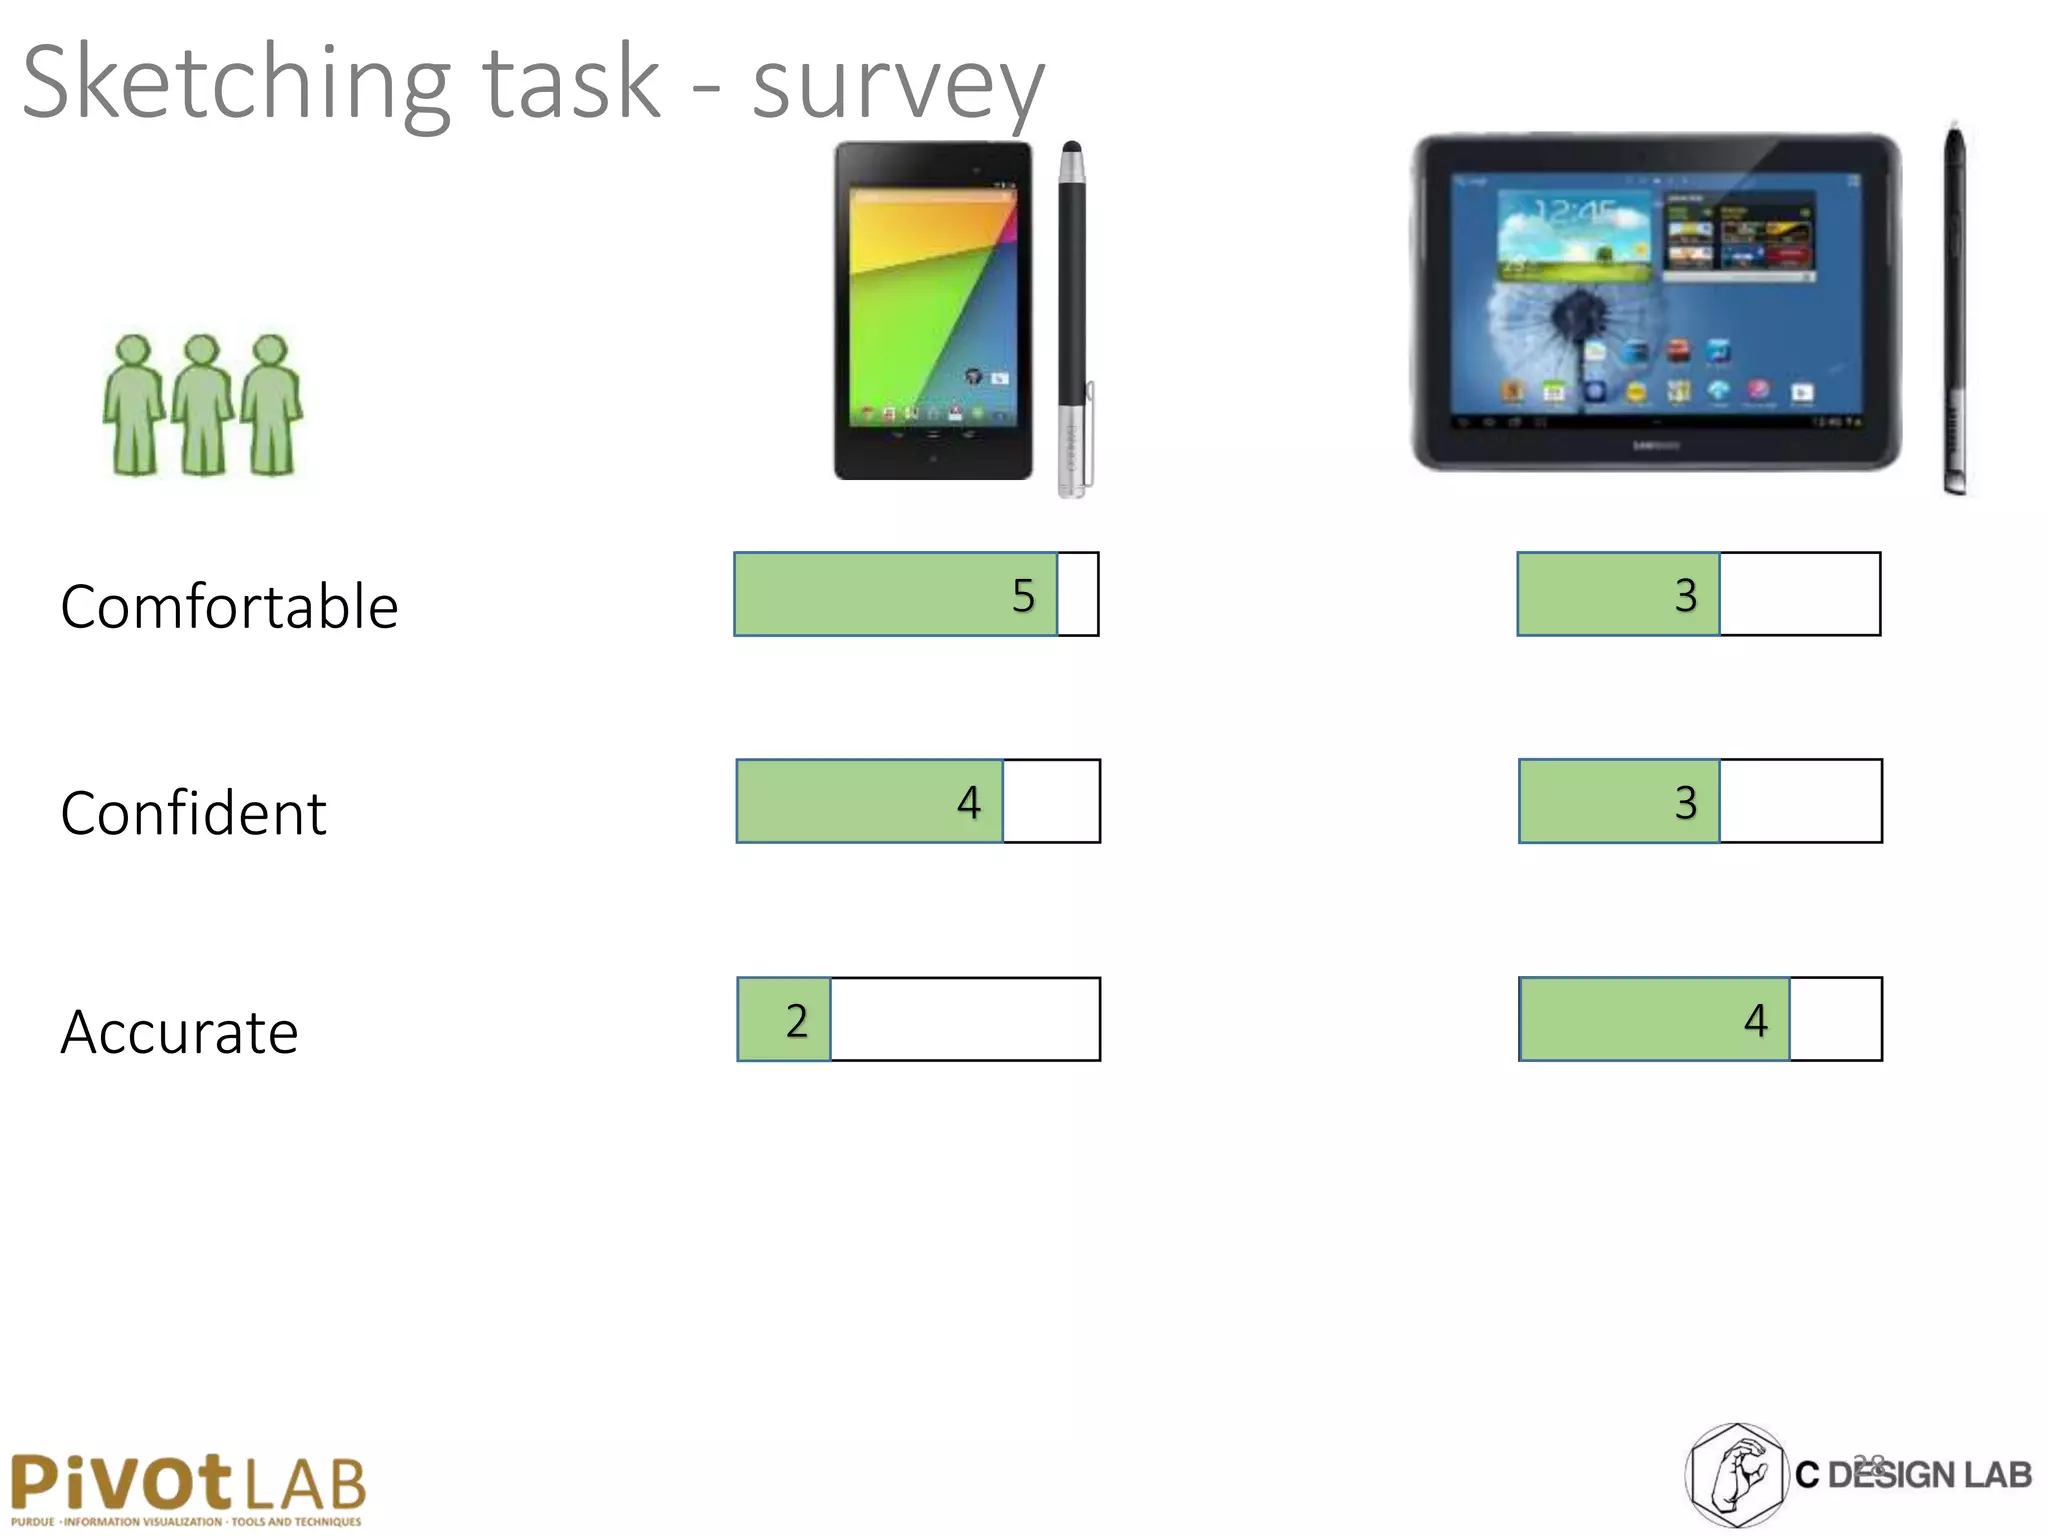
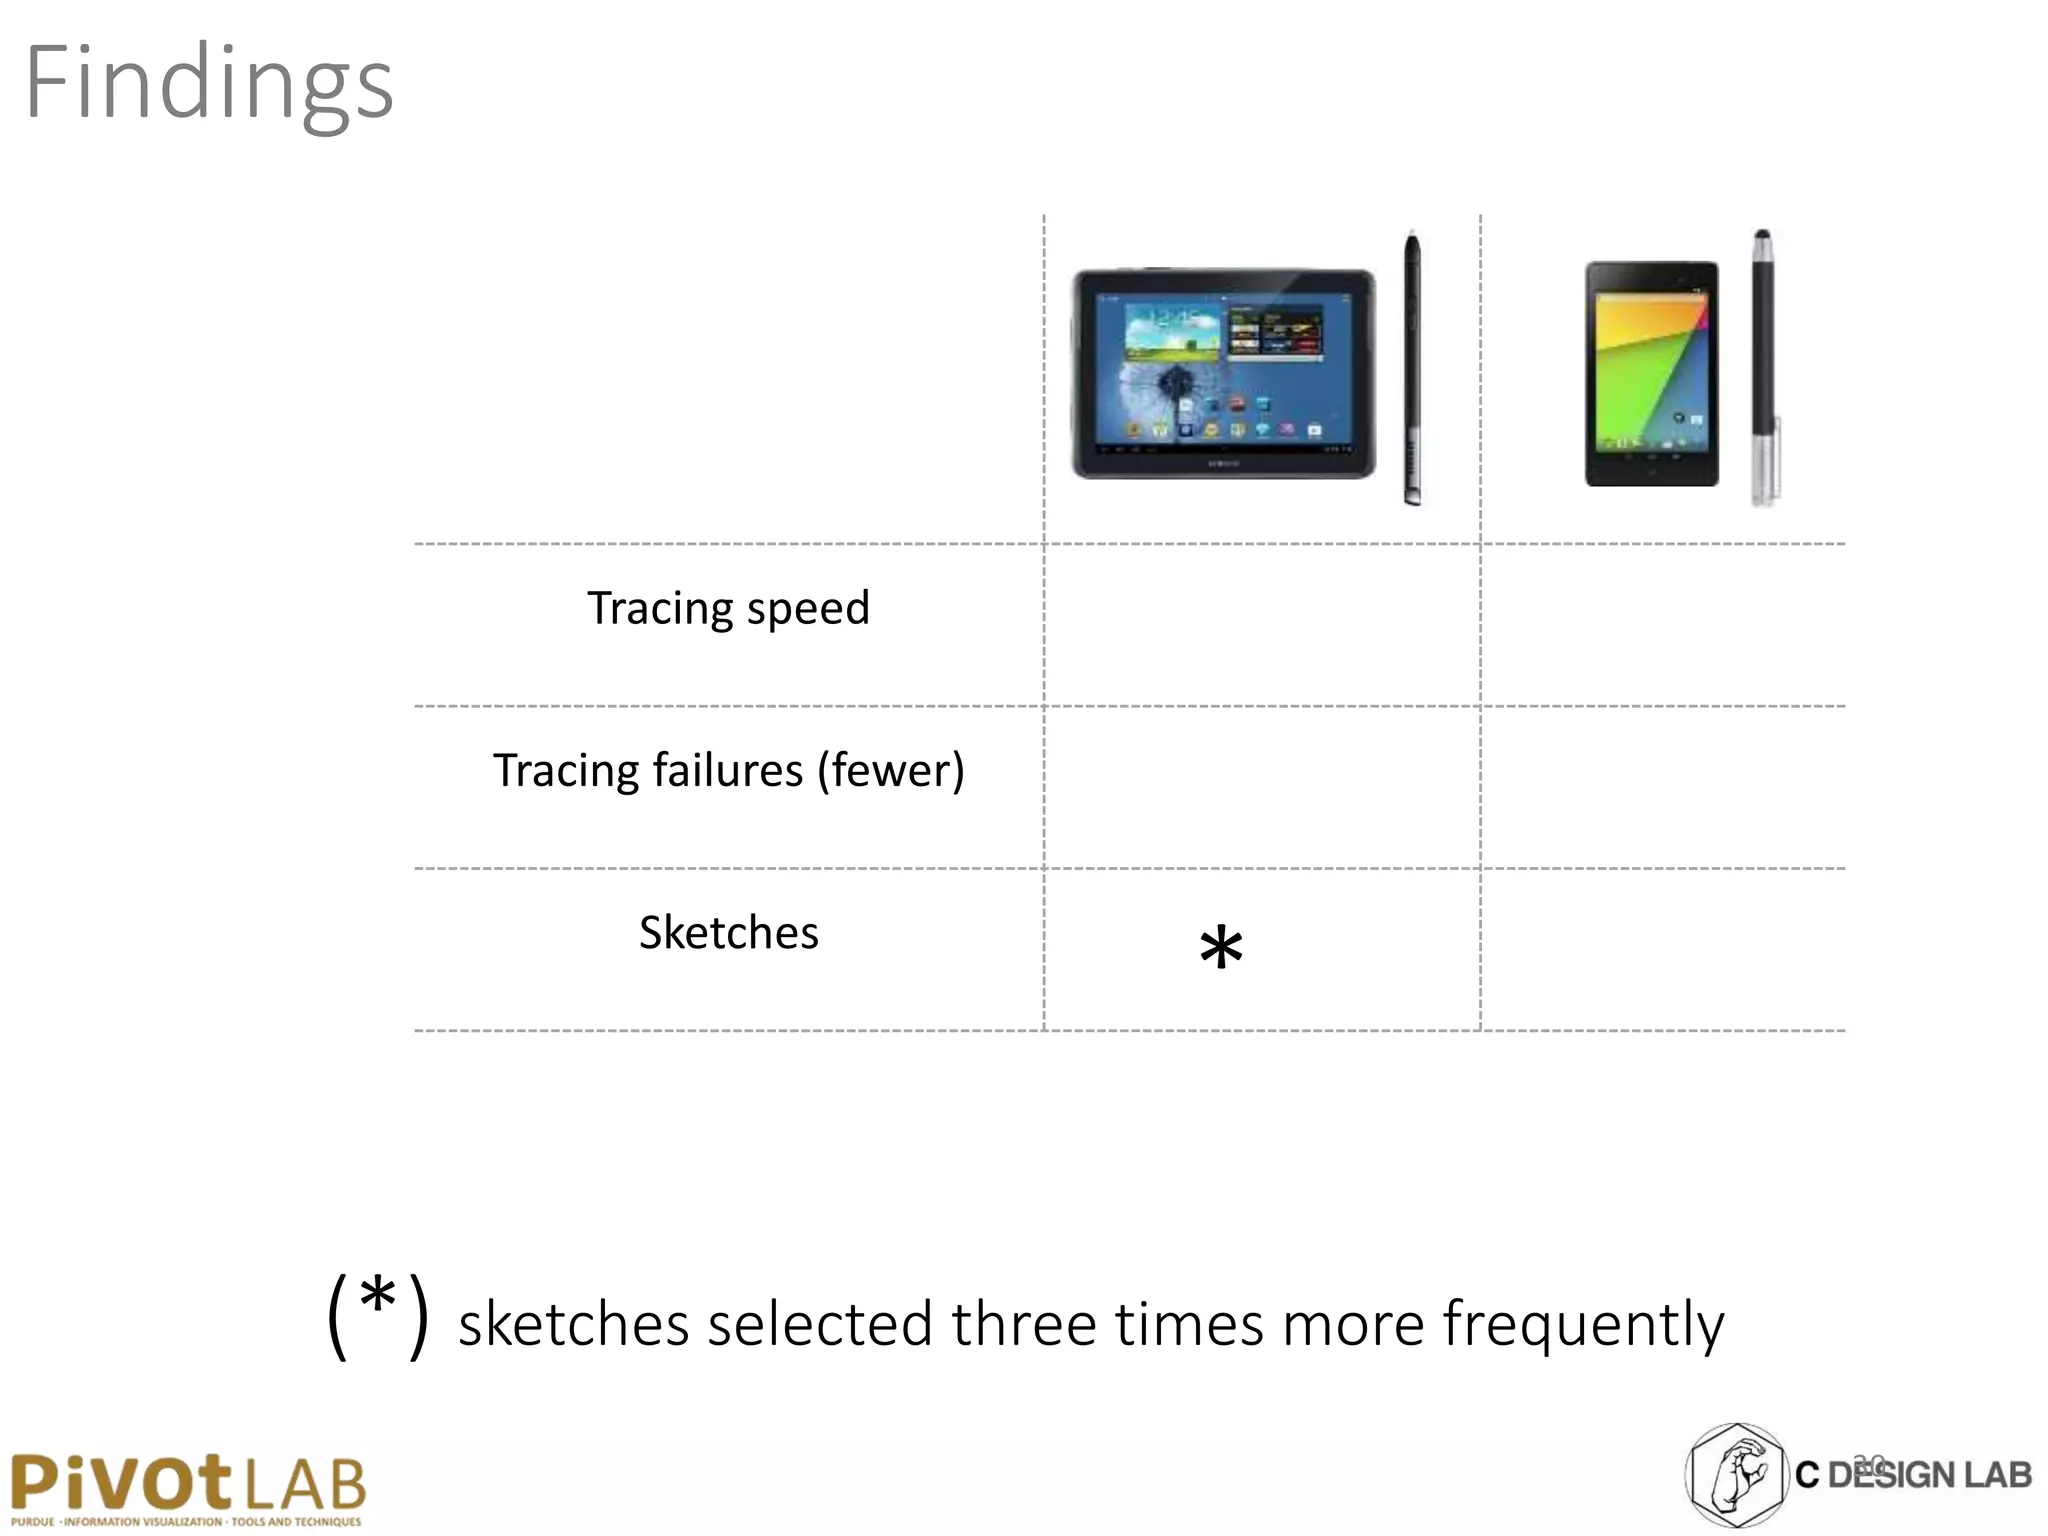
This study examined tracing and sketching performance using blunt-tipped styli on direct-touch tablets compared to using fingers. 14 participants performed tracing and sketching tasks with 3 different input methods. Tracing was faster, had fewer failures, and participants felt more comfortable using a blunt stylus compared to fingers. Sketches drawn with a blunt stylus were rated higher quality by crowdsourced voters. A follow up study with 6 participants directly compared blunt and sharp styli, finding sketches were selected 3 times more often when using a blunt stylus. The findings provide evidence that blunt styli can better support tracing and sketching tasks on direct-touch tablets compared to fingers or sharp styli.
VASA: Visual Analytics for Simulation-based ActionNiklas Elmqvist
Slides from our IEEE VAST 2014 talk at IEEE VIS on VASA, a visual analytics system for interactive computational steering of pipelines of asynchronous simulation models.
Munin: A Peer-to-Peer Middleware forUbiquitous Analytics and Visualization S...Niklas Elmqvist
Presentation from IEEE VIS 2014 on Munin, our Java toolkit for peer-to-peer visualization systems for ubiquitous analytics. Published in IEEE TVCG and presented by Sriram Karthik Badam.
Rolling the Dice: Multidimensional Visual Exploration using Scatterplot Matri...Niklas Elmqvist
Scatterplots remain one of the most popular and widely-used visual representations for multidimensional data due to their simplicity, familiarity and visual clarity, even if they lack some of the flexibility and visual expressiveness of newer multidimensional visualization techniques. This paper presents new interactive methods to explore multidimensional data using scatterplots. This exploration is performed using a matrix of scatterplots that gives an overview of the possible configurations, thumbnails of the scatterplots, and support for interactive navigation in the multidimensional space. Transitions between scatterplots are performed as animated rotations in 3D space, somewhat akin to rolling dice. Users can iteratively build queries using bounding volumes in the dataset, sculpting the query from different viewpoints to become more and more refined. Furthermore, the dimensions in the navigation space can be reordered, manually or automatically, to highlight salient correlations and differences among them. An example scenario presents the interaction techniques supporting smooth and effortless visual exploration of multidimensional datasets.
Slides from T.J. Jankun-Kelly's IEEE VisWeek 2012 presentation on visualization for games. Electronic games are starting to incorporate in-game telemetry that collects data about player, team, and community
performance on a massive scale, and as data begins to accumulate, so does the demand for effectively analyzing this data. We use examples from both old and new games of different genres to explore the theory and design space of visualization for games. Drawing on these examples, we define a design space for this novel research topic and use it to formulate design patterns for how to best apply visualization technology to games. We then discuss the implications that this new framework will
potentially have on the design and development of game and visualization technology in the future.
Presentation from ACM AVI 2012 in Capri, Italy on gravity navigation. Gravity navigation (GravNav) is a family of multi-scale navigation techniques that use a gravity-inspired model for assisting navigation in large visual 2D spaces based on the interest and
salience of visual objects in the space. GravNav is an instance of topology-aware navigation, which makes use of the structure of the visual space to aid navigation. We have performed a controlled study comparing GravNav to standard zoom and pan navigation, with and without variable-rate zoom control. Our results show a significant improvement for GravNav over standard navigation, particularly when coupled with variable-rate zoom. We also report findings on user behavior in multi-scale navigation.
PolyZoom: Multiscale and Multifocus Exploration in 2D Visual SpacesNiklas Elmqvist
Slides from ACM CHI 2012 presentation given by Sohaib Ghani.
Abstract: The most common techniques for navigating in multiscale visual spaces are pan, zoom, and bird’s eye views. However, these techniques are often tedious and cumbersome to use, especially when objects of interest are located far apart. We present the PolyZoom technique where users progressively build hierarchies of focus regions, stacked on each other such that each subsequent level shows a higher magnification. Correlation graphics show the relation between parent and child viewports in the hierarchy. To validate the new technique, we compare it to standard navigation techniques in two user studies, one on multiscale visual search and the other on multifocus interaction. Results show that PolyZoom performs better than current standard techniques.
Applying Mobile Device Soft Keyboards to Collaborative Multitouch Tabletop Di...Niklas Elmqvist
This document describes two user studies that evaluated different soft keyboard designs for text entry on multitouch tabletop displays. In the first study, participants tested a soft, radial, and pinpoint keyboard under various conditions. Standard QWERTY soft keyboards were found to be the fastest overall. A follow up study directly compared a pinpoint keyboard with shifts to a standard soft keyboard, finding no significant difference. While radial and pinpoint designs did not outperform soft keyboards, future work combining approaches or adding features like speech input could improve tabletop text entry.
Dynamic Insets for Context-Aware Graph NavigationNiklas Elmqvist
This document proposes dynamic insets for context-aware graph navigation. Dynamic insets display nodes just outside the visible screen area in an inset window based on their degree of interest, allowing users to see important surrounding context. An evaluation with 12 participants found dynamic insets significantly outperformed existing bringing-and-going techniques for tasks involving close and distant context in graphs. A follow up study with 6 participants tested dynamic insets on map and social network scenarios, finding they provide useful contextual navigation of large graphs.
Animated transitions are popular in many visual applications but they can be difficult to follow, especially when many objects
move at the same time. One informal design guideline for creating effective animated transitions has long been the use of slow-in/slow-out pacing, but no empirical data exist to support this practice. We remedy this by studying object tracking performance under different conditions of temporal distortion, i.e., constant speed transitions, slow-in/slow-out, fast-in/fast-out, and an adaptive technique that slows down the visually complex parts of the animation. Slow-in/slow-out outperformed other techniques, but we saw technique differences depending on the type of visual transition.
Hugin: A Framework for Awareness and Coordination in Mixed-Presence Collabora...Niklas Elmqvist
Analysts are increasingly encountering datasets that are larger and more complex than ever before. Effectively exploring such datasets requires collaboration between multiple analysts, who more often than not are distributed in time or in space. Mixed-presence groupware provide a shared workspace medium that supports this combination of co-located and distributed collaboration. However, collaborative visualization systems for such distributed settings have their own cost and are still uncommon in the visualization community. We present Hugin, a novel layer-based graphical framework for this kind of mixed-presence synchronous collaborative visualization over digital tabletop displays. The design of the framework focuses on issues like awareness and access control, while using information visualization for the collaborative data exploration on network-connected tabletops. To validate the usefulness of the framework, we also present examples of how the Hugin toolkit can be used to implement new visualizations with access to these collaborative mechanisms.
Line graphs have been the visualization of choice for temporal data ever since the days of William Playfair (1759-1823), but realistic temporal analysis tasks often include multiple simultaneous time series. In this work, we explore user performance for comparison, slope, and discrimination tasks for different line graph techniques involving multiple time series. Our results show that techniques that create separate charts for each time series--such as small multiples and horizon graphs--are generally more efficient for comparisons across time series with a large visual span. On the other hand, shared-space techniques--like standard line graphs--are typically more efficient for comparisons over smaller visual spans where the impact of overlap and clutter is reduced.
Employing Dynamic Transparency for 3D Occlusion Management: Design Issues and...Niklas Elmqvist
The document discusses employing dynamic transparency for 3D occlusion management. It proposes using dynamic transparency to give users "superman-like" x-ray vision by adjusting the transparency of occluding surfaces. A model and algorithm are presented for rendering targets visible through semi-transparent cutouts in distractors. A user study found dynamic transparency allowed visual perception tasks to be completed faster and with equal or better accuracy compared to standard 3D navigation.
GraphDice: A System for Exploring Multivariate Social NetworksNiklas Elmqvist
This document describes GraphDice, a system for exploring multivariate social networks. GraphDice allows users to visualize social networks, with nodes representing individuals and edges representing relationships. It integrates network topology, node and edge attributes, and tabular data views. GraphDice is designed for social network analysts to consistently represent and interact with network data through features like dynamic queries, selection history, and coordinated visualizations and data tables.
Stack Zooming for Multi-Focus Interaction in Time-Series Data VisualizationNiklas Elmqvist
In this IEEE PacificVis 2010 presentation, we introduce a method for supporting multi-focus interaction in time-series datasets that we call stack zooming. The approach is based on the user interactively building hierarchies of 1D strips stacked on top of each other, where each subsequent stack represents a higher zoom level, and sibling strips represent branches in the visual exploration. Correlation graphics show the relation between stacks and strips of different levels, providing context and distance awareness among the focus points.
Towards Utilizing GPUs in Information VisualizationNiklas Elmqvist
The document proposes GPUVis, a model and implementation for utilizing GPUs in information visualization. GPUVis defines image-space operations (IVOs) that transform data tuples into colored pixels. IVOs can perform tasks like color mapping, glyph rendering, filtering, and statistical analysis. GPUVis implements IVOs as shader programs and provides a visual editor to compose IVOs without programming. A demo of GPUVis shows performance gains over OpenGL for visualizations like scatter plots, node-link diagrams, and treemaps. Future work aims to improve control flow, optimization, and transition to CUDA/OpenCL.
Evaluating Motion Constraints for 3D Wayfinding in Immersive and Desktop Virt...Niklas Elmqvist
The document evaluates different motion constraints for aiding wayfinding in 3D virtual environments. It found that (1) free navigation performed better in an immersive CAVE environment while spring-based guidance on desktop performed significantly better, (2) navigation guidance was more efficient than free flight, and (3) navigation guidance had a higher impact on wayfinding for desktop users than CAVE users. The study suggests that removing some freedom in 3D navigation through guided tours can actually improve cognitive map building and wayfinding.
Melange: Space Folding for Multi-Focus InteractionNiklas Elmqvist
Interaction and navigation in large geometric spaces typically require a sequence of pan and zoom actions. This strategy is often ineffective and cumbersome, especially when trying to study several distant objects. We propose a new distortion technique that folds the intervening space to guarantee visibility of multiple focus regions. The folds themselves show contextual information and support unfolding and paging interactions. Compared to previous work, our method provides more context and distance awareness. We conducted a study comparing the space-folding technique to existing approaches, and found that participants performed significantly better with the new technique.
Nunit vs XUnit vs MSTest Differences Between These Unit Testing Frameworks.pdfflufftailshop
When it comes to unit testing in the .NET ecosystem, developers have a wide range of options available. Among the most popular choices are NUnit, XUnit, and MSTest. These unit testing frameworks provide essential tools and features to help ensure the quality and reliability of code. However, understanding the differences between these frameworks is crucial for selecting the most suitable one for your projects.
Trusted Execution Environment for Decentralized Process MiningLucaBarbaro3
Presentation of the paper "Trusted Execution Environment for Decentralized Process Mining" given during the CAiSE 2024 Conference in Cyprus on June 7, 2024.
Ocean lotus Threat actors project by John Sitima 2024 (1).pptxSitimaJohn
Ocean Lotus cyber threat actors represent a sophisticated, persistent, and politically motivated group that poses a significant risk to organizations and individuals in the Southeast Asian region. Their continuous evolution and adaptability underscore the need for robust cybersecurity measures and international cooperation to identify and mitigate the threats posed by such advanced persistent threat groups.
This presentation provides valuable insights into effective cost-saving techniques on AWS. Learn how to optimize your AWS resources by rightsizing, increasing elasticity, picking the right storage class, and choosing the best pricing model. Additionally, discover essential governance mechanisms to ensure continuous cost efficiency. Whether you are new to AWS or an experienced user, this presentation provides clear and practical tips to help you reduce your cloud costs and get the most out of your budget.
Let's Integrate MuleSoft RPA, COMPOSER, APM with AWS IDP along with Slackshyamraj55
Discover the seamless integration of RPA (Robotic Process Automation), COMPOSER, and APM with AWS IDP enhanced with Slack notifications. Explore how these technologies converge to streamline workflows, optimize performance, and ensure secure access, all while leveraging the power of AWS IDP and real-time communication via Slack notifications.
Fueling AI with Great Data with Airbyte WebinarZilliz
This talk will focus on how to collect data from a variety of sources, leveraging this data for RAG and other GenAI use cases, and finally charting your course to productionalization.
Digital Marketing Trends in 2024 | Guide for Staying AheadWask
https://www.wask.co/ebooks/digital-marketing-trends-in-2024
Feeling lost in the digital marketing whirlwind of 2024? Technology is changing, consumer habits are evolving, and staying ahead of the curve feels like a never-ending pursuit. This e-book is your compass. Dive into actionable insights to handle the complexities of modern marketing. From hyper-personalization to the power of user-generated content, learn how to build long-term relationships with your audience and unlock the secrets to success in the ever-shifting digital landscape.
Programming Foundation Models with DSPy - Meetup SlidesZilliz
Prompting language models is hard, while programming language models is easy. In this talk, I will discuss the state-of-the-art framework DSPy for programming foundation models with its powerful optimizers and runtime constraint system.
Your One-Stop Shop for Python Success: Top 10 US Python Development Providersakankshawande
Simplify your search for a reliable Python development partner! This list presents the top 10 trusted US providers offering comprehensive Python development services, ensuring your project's success from conception to completion.
TrustArc Webinar - 2024 Global Privacy SurveyTrustArc
How does your privacy program stack up against your peers? What challenges are privacy teams tackling and prioritizing in 2024?
In the fifth annual Global Privacy Benchmarks Survey, we asked over 1,800 global privacy professionals and business executives to share their perspectives on the current state of privacy inside and outside of their organizations. This year’s report focused on emerging areas of importance for privacy and compliance professionals, including considerations and implications of Artificial Intelligence (AI) technologies, building brand trust, and different approaches for achieving higher privacy competence scores.
See how organizational priorities and strategic approaches to data security and privacy are evolving around the globe.
This webinar will review:
- The top 10 privacy insights from the fifth annual Global Privacy Benchmarks Survey
- The top challenges for privacy leaders, practitioners, and organizations in 2024
- Key themes to consider in developing and maintaining your privacy program
A Comprehensive Guide to DeFi Development Services in 2024Intelisync
DeFi represents a paradigm shift in the financial industry. Instead of relying on traditional, centralized institutions like banks, DeFi leverages blockchain technology to create a decentralized network of financial services. This means that financial transactions can occur directly between parties, without intermediaries, using smart contracts on platforms like Ethereum.
In 2024, we are witnessing an explosion of new DeFi projects and protocols, each pushing the boundaries of what’s possible in finance.
In summary, DeFi in 2024 is not just a trend; it’s a revolution that democratizes finance, enhances security and transparency, and fosters continuous innovation. As we proceed through this presentation, we'll explore the various components and services of DeFi in detail, shedding light on how they are transforming the financial landscape.
At Intelisync, we specialize in providing comprehensive DeFi development services tailored to meet the unique needs of our clients. From smart contract development to dApp creation and security audits, we ensure that your DeFi project is built with innovation, security, and scalability in mind. Trust Intelisync to guide you through the intricate landscape of decentralized finance and unlock the full potential of blockchain technology.
Ready to take your DeFi project to the next level? Partner with Intelisync for expert DeFi development services today!
Building Production Ready Search Pipelines with Spark and MilvusZilliz
Spark is the widely used ETL tool for processing, indexing and ingesting data to serving stack for search. Milvus is the production-ready open-source vector database. In this talk we will show how to use Spark to process unstructured data to extract vector representations, and push the vectors to Milvus vector database for search serving.
Salesforce Integration for Bonterra Impact Management (fka Social Solutions A...Jeffrey Haguewood
Sidekick Solutions uses Bonterra Impact Management (fka Social Solutions Apricot) and automation solutions to integrate data for business workflows.
We believe integration and automation are essential to user experience and the promise of efficient work through technology. Automation is the critical ingredient to realizing that full vision. We develop integration products and services for Bonterra Case Management software to support the deployment of automations for a variety of use cases.
This video focuses on integration of Salesforce with Bonterra Impact Management.
Interested in deploying an integration with Salesforce for Bonterra Impact Management? Contact us at sales@sidekicksolutionsllc.com to discuss next steps.
8. Typical product design
Sketch primitives
Develop a model from primitives
Improve quality by tracing over
Can digital design tools replace paper for this?
8
23. Data collection
• Time taken for each trace
• Failures to keep to the tunnel
• Sketch Quality – expert voting
(4 independent judges)!
Tracing (5 shapes) Sketching (3 shapes)
• Questionnaire • Questionnaire
23
Introduce myself - co-authors – paper about evaluating the tracing and sketching performance on digital tablets
Need for paper in day-to-day activities – newspapers, novels, and maps – replaced with well-designed tablet applications.
[Segway] tablet replacing paper for content consumption. But what about content creation? For example, an industrial design
Industrial design – requires paper for drafting – content creation – custom hardware for sketching and design
[Segway] Provide natural interaction
For example, with digital media you no longer need to use a copier to share your ideas, you can just transfer them with a button click. Although such tools exist they cannot promise better adaptability of designers to digital medium. The question we ask is whether you can sketch on a tablet as seamlessly or naturally as on a paper?
Coming back – Wacom devices direct/in-direct interaction replace paper - but there are also numerous mobile devices – direct-touch – why not use them?
[Segway] For one thing, the capacitive touch tablets have finger input
[Segway] For one thing, the capacitive touch tablets have finger inpu
As kids used to finger painting – its messy – but learn how to draw shapes with fingers – still we are more used to pen input
Luckily, we now have digital styli, that can replace enable pen-like input to tablets – numerous models – differ in tip dimensions, material etc. – we have considered a common representative Wacom Bamboo (best consumer feedback).
Considering the digital tech -- Designer’s notebook – repository of sketches of ideas – may not be fully mature – represents early-design process – these design notebooks are useful because – small, portable
[Segway] considering all the digital technology we have right now, what is stopping us from replacing this?
A typical early design has multiple steps.
Play animation
Can we replace pen and paper with digital tools (tablets, styli)?
[Segway] aspects – that affect tablets
We have identified 4 aspects – familiarity – occlusion – friction – parallax
[segway] objective of our research – compare the performance of touch tablets with paper – ecological valid study with less constraints – similar attempts in past to compare input devices.
Bridging pen-paper and digital
Accot and Zhai 1999
Zabramski et al. 2011 both handled tracing tasks
did a rigorous study with multiple shape tracing
[Segway] since we target both sketching and tracing, as in early design, we did two user studies
[Need to show roadmap at the end]
14 participants – students from various departments in Purdue University – all had novice level exposure to design through a toy design course
3 media –
2 tasks –
multiple shapes – 5 shapes – 2 shapes.
We conducted a user study to understand the performance of three medium + input combinations i.e., stylus + tablet, finger + tablet, and pen + paper for sketching and tracing. Inspired by the previous research work in evaluating various input devices for tracing different shapes using Steering’s law, we have chosen 5 different shapes for tracing and two common 3D shapes for sketching.
We recruited 14 participants (13 male + 1 female) from various departments in our University. They were all students and they only had beginner-level experience to early design. In essence, they were not expert designers.
Tracing tasks – 5 shapes increasing complexity in curvature – participants asked to keep to an error tunnel – 3 times of each medium (so that we can compare pen-paper with tablet)
[Mention how the task was done on paper] - video recorded and analyzed
Tracing speed – faster on tablet with stylus input – followed by finger with tablet – pen-paper – just put in the average values for your reference – significant
Tracing failures – least on pen-paper – followed by stylus tablet – finger tablet – pen-paper significantly better but finger-tablet had the worst failures
In the post-survey questionnaire – we asked comfort, confidence, accuracy – pen-paper – stylus 12, 10, 10 – while only most of the participants were not with pen-paper
[Segway] this covers the tracing tasks, following this the participants did sketching task
Sketching tasks – 2 shapes – 3d shapes – 3 times of each medium (so that we can compare pen-paper with tablet) – participants selected the best representative sketch
Analysis – instead of using image processing techniques, that are hard to define – used sketch quality measure from crowdsourcing – lineups of sketches – choose one -- ratios
In each lineup, 5 sketches from the library of 42 submitted sketches for each shape was randomly displayed in a single row.
277 respondents – for sketch quality - 5,440 individual responses – and from this *[enter slide]*
In the post-survey questionnaire – again pen-paper (of course) – but this time stylus 9, 8, 7 and finger were similar except for accuracy – this can be due to the large occlusion
[Segway] looking from the aspects perspective
*Hard to quantify
Familiarity to pen-paper > tablet - occlusion is more for finger (tip size) – friction couldnot be quantified but the perception is that more on pen-paper – parallax is more on tablet screen
[Segway] clearly the media differ in these aspects but if we look at the results again
Tablet with stylus and paper performed comparably*
[Segway] so far we have looked at using existing generic input styli for direct-touch tablets. – followed with a different study - Blunt vs Sharp-tipped (Samsung note device). Coming to the second part of our paper,
Now-a-days we have tablets with better styli such as Samsung note – they have a hard tip for handwriting – so we wanted to compare them with the blunt-tipped Wacom bamboo stylus in the follow-up study
Additional bearing block (no motivation)– Sharp tipped can be used for intricate shapes..
The tasks were similar to before but this due to the low participant pool we had to do a expert voting for sketch quality rather than crowdsourcing.
Three repetitions – one selection - Not using lineups – but pair-wise selections by expert judges.
Speed was higher!!!! Not much …The results were not significant
Most of the participants were Comfortable with blunt tipped stylus – because the dimensions match a normal pen (quoted)
Accuracy, of course, was better for hard-tipped stylus
*Hard to quantify
Looking from aspects the devices clearly were different – occlusion was more on the blunt tip but the questionnaire – doesn’t translate to this – because **tip size is one thing but form factor also matters**
Samsung designed a small pen **
Results not much but summarizing, we are planning to do a more rigorous study in future but
We can take these results into account to replace the traditional design notebook with digital tools for tablets
Blunt-tip stylus is not so bad – if we can add features to improve the accuracy – form factor is important – Thank you!! If you disagree with any of the findings here we can have a discussion now or even offline