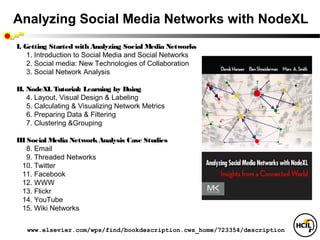
Information Visualization for
         Knowledge Discovery
   Ben Shneiderman      ben@cs.umd.edu   @benbendc

Founding Director (1983-2000), Human-Computer Interaction Lab
         Professor, Department of Computer Science
       Member, Institute for Advanced Computer Studies


                 University of Maryland
                College Park, MD 20742
Turning Messy BigData
into Actionable SmallData


      @benbendc


      University of Maryland
     College Park, MD 20742
Interdisciplinary research community
  - Computer Science & Info Studies
  - Psych, Socio, Poli Sci & MITH
      (www.cs.umd.edu/hcil)
Design Issues

•   Input devices & strategies
     • Keyboards, pointing devices, voice
     • Direct manipulation
     • Menus, forms, commands
•   Output devices & formats
     • Screens, windows, color, sound
     • Text, tables, graphics
     • Instructions, messages, help
•   Collaboration & Social Media            www.awl.com/DTUI
                                            Fifth Edition: 2010
•   Help, tutorials, training
•   Search        • Visualization
HCI Pride: Serving 5B Users

Mobile, desktop, web, cloud
 Diverse users: novice/expert, young/old, literate/illiterate,
      abled/disabled, cultural, ethnic & linguistic diversity, gender,
      personality, skills, motivation, ...

 Diverse applications: E-commerce, law, health/wellness,
      education, creative arts, community relationships, politics,
      IT4ID, policy negotiation, mediation, peace studies, ...

 Diverse interfaces: Ubiquitous, pervasive, embedded, tangible,
      invisible, multimodal, immersive/augmented/virtual, ambient,
      social, affective, empathic, persuasive, ...
Obama Unveils “Big Data” Initiative                                                      (3/2012)


                                                   Big Data challenges:
                                                  •Developing scalable algorithms
                                                  for processing imperfect data
                                                  in distributed data stores

                                                  •Creating effective human-
                                                  computer interaction tools
                                                  for facilitating rapidly
                                                  customizable visual reasoning
                                                  for diverse missions.


http://www.whitehouse.gov/sites/default/files/microsites/ostp/big_data_press_release_final_2.pdf `
Information Visualization & Visual Analytics

 •   Visual bands
     • Human percle
        • Trend, clus..
        • Color, size,..


 •   Three challe
     • Meaningful vi
     • Interaction: w
     • Process mo


      1999
Information Visualization & Visual Analytics

 •   Visual bandwidth is enormous
     • Human perceptual skills are remarkable
       • Trend, cluster, gap, outlier...
       • Color, size, shape, proximity...


 •   Three challenges
     • Meaningful visual displays of massive da
     • Interaction: widgets & window coordinati
     • Process models for discovery


      1999                        2004
Information Visualization & Visual Analytics

 •   Visual bandwidth is enormous
     • Human perceptual skills are remarkable
       • Trend, cluster, gap, outlier...
       • Color, size, shape, proximity...


 •   Three challenges
     • Meaningful visual displays of massive data
     • Interaction: widgets & window coordination
     • Process models for discovery


      1999                        2004              2010
Business takes action

•   General Dynamics buys MayaViz
•   Agilent buys GeneSpring
•   Google buys Gapminder
•   Oracle buys Hyperion
•   Microsoft buys Proclarity
•   InfoBuilders buys Advizor Solutions
•   SAP buys (Business Objects buys
           Xcelsius & Inxight & Crystal Reports )
•   IBM buys (Cognos buys Celequest) & ILOG
•   TIBCO buys Spotfire
Spotfire: Retinol’s role in embryos & vision
Spotfire: DC natality data
http://registration.spotfire.com/eval/default_edu.asp
10M - 100M pixels: Large displays
100M-pixels & more
1M-pixels & less   Small mobile devices
Information Visualization: Mantra

•   Overview, zoom & filter, details-on-demand
. Information Visualization: Data Types

            •   1-D Linear     Document Lens, SeeSoft, Info Mural
            •   2-D Map        GIS, ArcView, PageMaker, Medical imagery
            •   3-D World      CAD, Medical, Molecules, Architecture
zi Vc S
   i


            •   Multi-Var      Spotfire, Tableau, Qliktech, Visual Insight
            •   Temporal       LifeLines, TimeSearcher, Palantir, DataMontage
            •   Tree           Cone/Cam/Hyperbolic, SpaceTree, Treemap
            •   Network
zi V f nI


                               Pajek, UCINet, NodeXL, Gephi, Tom Sawyer
    o


            infosthetics.com   visualcomplexity.com        eagereyes.org
            flowingdata.com    perceptualedge.com          datakind.org
            visual.ly          Visualizing.org             infovis.org
Anscombe’s Quartet

          1                        2                    3                        4
x             y          x             y      x             y          x             y
10.0              8.04   10.0          9.14   10.0              7.46       8.0           6.58
    8.0           6.95       8.0       8.14       8.0           6.77       8.0           5.76
13.0              7.58   13.0          8.74   13.0          12.74          8.0           7.71
    9.0           8.81       9.0       8.77       9.0           7.11       8.0           8.84
11.0              8.33   11.0          9.26   11.0              7.81       8.0           8.47
14.0              9.96   14.0          8.10   14.0              8.84       8.0           7.04
    6.0           7.24       6.0       6.13       6.0           6.08       8.0           5.25
    4.0           4.26       4.0       3.10       4.0           5.39   19.0          12.50
12.0          10.84      12.0          9.13   12.0              8.15       8.0           5.56
    7.0           4.82       7.0       7.26       7.0           6.42       8.0           7.91
    5.0           5.68       5.0       4.74       5.0           5.73       8.0           6.89
Anscombe’s Quartet

          1                        2                    3                        4
x             y          x             y      x             y          x             y
                                                                                                Property            Value
10.0              8.04   10.0          9.14   10.0              7.46       8.0           6.58
                                                                                                Mean of x            9.0
    8.0           6.95       8.0       8.14       8.0           6.77       8.0           5.76
                                                                                                Variance of x       11.0
13.0              7.58   13.0          8.74   13.0          12.74          8.0           7.71
                                                                                                Mean of y            7.5
    9.0           8.81       9.0       8.77       9.0           7.11       8.0           8.84
                                                                                                Variance of y        4.12
11.0              8.33   11.0          9.26   11.0              7.81       8.0           8.47
                                                                                                Correlation          0.816
14.0              9.96   14.0          8.10   14.0              8.84       8.0           7.04
                                                                                                Linear regression   y = 3 + 0.5x
    6.0           7.24       6.0       6.13       6.0           6.08       8.0           5.25
    4.0           4.26       4.0       3.10       4.0           5.39   19.0          12.50
12.0          10.84      12.0          9.13   12.0              8.15       8.0           5.56
    7.0           4.82       7.0       7.26       7.0           6.42       8.0           7.91
    5.0           5.68       5.0       4.74       5.0           5.73       8.0           6.89
Anscombe’s Quartet
Temporal Data: TimeSearcher 1.3


•   Time series
     • Stocks
     • Weather
     • Genes
•   User-specified
      patterns
•   Rapid search
Temporal Data: TimeSearcher 2.0

•   Long Time series (>10,000 time points)
•   Multiple variables
•   Controlled precision in match
     (Linear, offset, noise, amplitude)
LifeLines: Patient Histories


       www.cs.umd.edu/hcil/lifelines
LifeLines2: Align-Rank-Filter & Summarize
LifeFlow: Aggregation Strategy

                          Temporal
                          Categorical Data
                           (4 records)


                          LifeLines2 format


                          Tree of Event
                           Sequences


                          LifeFlow Aggregation

        www.cs.umd.edu/hcil/lifeflow
LifeFlow: Interface with User Controls
EventFlow: Original Dataset
LABA_ICSs Merged
SABAs Merged
Align by First LABA_ICS
Reduce Window Size
EventFlow Team: Oracle support


                             www.cs.umd.edu/hcil/eventflow
www.umdrightnow.umd.edu/news/umd-research-team-developing-powerful-data-visualization-tool-support-oracle
Treemap: Gene Ontology


+ Space filling
+ Space limited
+ Color coding
+ Size coding
- Requires learning


        (Shneiderman, ACM Trans. on Graphics, 1992 & 2003)
               www.cs.umd.edu/hcil/treemap/
Treemap: Smartmoney MarketMap


         www.smartmoney.com/marketmap
Market falls steeply Feb 27, 2007, with one exception
Market falls steeply Sept 22, 2011, some exceptions
Market mixed, February 8, 2008
Energy & Technology up, Financial & Health Care down
Market rises, September 1, 2010, Gold contrarians
Market rises, March 21, 2011, Sprint declines
Treemap: Newsmap (Marcos Weskamp)


                     newsmap.jp
Treemap: WHC Emergency Room
       (6304 patients in Jan2006)


Group by Admissions/MF, size by service time, color by age
Treemap: WHC Emergency Room
       (6304 patients in Jan2006) (only those service time >12 hours)


Group by Admissions/MF, size by service time, color by age
Treemap: Supply Chain


           www.hivegroup.com
Treemap: Nutritional Analysis


              www.hivegroup.com
Treemap: Spotfire Bond Portfolio Analysis


                 www.spotfire.com
Treemap: NY Times – Car&Truck Sales


        www.cs.umd.edu/hcil/treemap/
Treemap (Voronoi): NY Times - Inflation


www.nytimes.com/interactive/2008/05/03/business/20080403_SPENDING_GRAPHIC.html
VisualComplexity.com : Manuel Lima
SocialAction


•   Integrates statistics
      & visualization


•   4 case studies, 4-8 weeks
      (journalist, bibliometrician, terrorist analyst,
               organizational analyst)
•   Identified desired features, gave strong positive
    feedback about benefits of integration
                 www.cs.umd.edu/hcil/socialaction
              Perer & Shneiderman, CHI2008, IEEE CG&A 2009
Network from Database Tables


          www.centrifugesystems.com
NodeXL:
    Network Overview for Discovery & Exploration in Excel


www.codeplex.com/nodexl
NodeXL:
Network Overview for Discovery & Exploration in Excel


            www.codeplex.com/nodexl
NodeXL: Import Dialogs


  www.codeplex.com/nodexl
Tweets at #WIN09 Conference: 2 groups
Flickr networks
Twitter discussion of #GOP

                       Red: Republicans, anti-Obama,
                         mention Fox
                       Blue: Democrats, pro-Obama,
                         mention CNN
                       Green: non-affiliated

                       Node size is number of followers
                       Politico is major bridging group
Analogy: Clusters Are Occluded
Hard to count nodes, clusters
Separate Clusters Are More Comprehensible
Twitter networks: #SOTU
Group-In-A-Box: Twitter Network for #CI2012
Twitter Network for “TTW”
Pennsylvania Innovation Network
No Location              Philadelphia


                                                     Patent
                                                     Tech
                         Navy                  SBIR (federal)
                                                   PA DCED (state)
                                                    Related patent
                                           2: Federal agency
Pharmaceutical/Medical                     3: Enterprise

Pittsburgh Metro                          5: Inventors
                                            9: Universities
                                           10: PA DCED
                                        11/12: Phil/Pitt metro cnty

                                         13-15: Semi-rural/rural cnty
                                            17: Foreign countries
                                             19: Other states
Westinghouse Electric
Innovation Patterns: 11,000 vertices, 26,000 edges
No Location                     Philadelphia
 Innovation Clusters: People, Locations, Companies

                                                            Patent
                                                            Tech
                                 Navy                 SBIR (federal)
                                                          PA DCED (state)
                                                           Related patent
                                                  2: Federal agency
Pharmaceutical/Medical                            3: Enterprise

Pittsburgh Metro                                 5: Inventors
                                                   9: Universities
                                                  10: PA DCED
                                               11/12: Phil/Pitt metro cnty

                                                13-15: Semi-rural/rural cnty
                                                   17: Foreign countries
                                                    19: Other states
Westinghouse Electric
Interactive Methods to Reveal Patterns


Filtering         Node & link attribute values or statistics

Clustering        Cluster algorithmically by link connectivity

Grouping          Group based on node attributes

Motif              Common, meaningful structures
 Simplification   replaced with simplified glyphs
Senate Co-Voting
Group-In-A-Box by Region
Interactive Methods to Reveal Patterns


Filtering         Node & link attribute values or statistics

Clustering        Cluster algorithmically by link connectivity

Grouping          Group based on node attributes

Motif              Common, meaningful structures
 Simplification   replaced with simplified glyphs
Motif Simplification


(a) Fan motifs & glyphs   (b) Connector motifs & glyphs
Motif Simplification
Clique Motifs & Glyphs: 4, 5 & 6
Senate Co-Voting: 65% Agreement
Senate Co-Voting: 70% Agreement
Senate Co-Voting: 80% Agreement
Senate Co-Voting: 90% Agreement
Senate Co-Voting: 95% Agreement
Analyzing Social Media Networks with NodeXL
I. Getting Started with Analyzing Social Media Networks
    1. Introduction to Social Media and Social Networks
    2. Social media: New Technologies of Collaboration
    3. Social Network Analysis

II. NodeXL Tutorial: Learning by Doing
    4. Layout, Visual Design & Labeling
    5. Calculating & Visualizing Network Metrics 
    6. Preparing Data & Filtering
    7. Clustering &Grouping

III Social Media Network Analysis Case Studies
    8. Email
    9. Threaded Networks
  10. Twitter
  11. Facebook  
  12. WWW
  13. Flickr
  14. YouTube 
  15. Wiki Networks 


   www.elsevier.com/wps/find/bookdescription.cws_home/723354/description
Social Media Research Foundation

Researchers who want to
 - create open tools
 - generate & host open data
 - support open scholarship

Map, measure & understand
  social media  

Support tool projects to
 collection, analyze & visualize
 social media data.  


                    smrfoundation.org
Sense-Making Loop


      Thomas & Cook: Illuminating the Path (2004)
Sense-Making Loop: Expanded


      Thomas & Cook: Illuminating the Path (2004)
Discovery Process: Systematic Yet Flexible

 Preparation
 • Own the problem & define the schedule
 • Data cleaning & conditioning
 • Handle missing & uncertain data
 • Extract subsets & link to related information
Discovery Process: Systematic Yet Flexible

 Preparation
 • Own the problem & define the schedule
 • Data cleaning & conditioning
 • Handle missing & uncertain data
 • Extract subsets & link to related information
 Purposeful exploration – Hypothesis testing
 • Range & distribution
 • Relationships & correlations
 • Clusters & gaps
 • Outliers & anomalies
 • Aggregation & summary
 • Split & trellis
 • Temporal comparisons & multiple views
 • Statistics & forecasts
 Situated decision making - Social context
 • Annotation & marking
 • Collaboration & coordination
 • Decisions & presentations
UN Millennium Development Goals

   To be achieved by 2015
 • Eradicate extreme poverty and hunger
 • Achieve universal primary education
 • Promote gender equality and empower women
 • Reduce child mortality
 • Improve maternal health
 • Combat HIV/AIDS, malaria and other diseases
 • Ensure environmental sustainability
 • Develop a global partnership for development
30th Anniversary Symposium
       May 22-23, 2013

    www.cs.umd.edu/hcil
For More Information

•   Visit the HCIL website for 700+ papers & info on videos
            www.cs.umd.edu/hcil
•   See Chapter 14 on Info Visualization
     Shneiderman, B. and Plaisant, C., Designing the User Interface:
      Strategies for Effective Human-Computer Interaction:
        Fifth Edition (2010) www.awl.com/DTUI
•   Edited Collections:
     Card, S., Mackinlay, J., and Shneiderman, B. (1999)
       Readings in Information Visualization: Using Vision to Think
     Bederson, B. and Shneiderman, B. (2003)
      The Craft of Information Visualization: Readings and Reflections
For More Information

•   Treemaps
     • HiveGroup: www.hivegroup.com
     • Smartmoney: www.smartmoney.com/marketmap
     • HCIL Treemap 4.0: www.cs.umd.edu/hcil/treemap
•   Spotfire: www.spotfire.com
•   TimeSearcher: www.cs.umd.edu/hcil/timesearcher
•   NodeXL: nodexl.codeplex.com
•   Hierarchical Clustering Explorer:
         www.cs.umd.edu/hcil/hce

•   LifeLines2:    www.cs.umd.edu/hcil/lifelines2
•   EventFlow:     www.cs.umd.edu/hcil/eventflow

Info vis 4-22-2013-dc-vis-meetup-shneiderman

  • 1.
    Information Visualization for Knowledge Discovery Ben Shneiderman ben@cs.umd.edu @benbendc Founding Director (1983-2000), Human-Computer Interaction Lab Professor, Department of Computer Science Member, Institute for Advanced Computer Studies University of Maryland College Park, MD 20742
  • 2.
    Turning Messy BigData intoActionable SmallData @benbendc University of Maryland College Park, MD 20742
  • 3.
    Interdisciplinary research community - Computer Science & Info Studies - Psych, Socio, Poli Sci & MITH (www.cs.umd.edu/hcil)
  • 4.
    Design Issues • Input devices & strategies • Keyboards, pointing devices, voice • Direct manipulation • Menus, forms, commands • Output devices & formats • Screens, windows, color, sound • Text, tables, graphics • Instructions, messages, help • Collaboration & Social Media www.awl.com/DTUI Fifth Edition: 2010 • Help, tutorials, training • Search • Visualization
  • 5.
    HCI Pride: Serving5B Users Mobile, desktop, web, cloud  Diverse users: novice/expert, young/old, literate/illiterate, abled/disabled, cultural, ethnic & linguistic diversity, gender, personality, skills, motivation, ...  Diverse applications: E-commerce, law, health/wellness, education, creative arts, community relationships, politics, IT4ID, policy negotiation, mediation, peace studies, ...  Diverse interfaces: Ubiquitous, pervasive, embedded, tangible, invisible, multimodal, immersive/augmented/virtual, ambient, social, affective, empathic, persuasive, ...
  • 6.
    Obama Unveils “BigData” Initiative (3/2012) Big Data challenges: •Developing scalable algorithms for processing imperfect data in distributed data stores •Creating effective human- computer interaction tools for facilitating rapidly customizable visual reasoning for diverse missions. http://www.whitehouse.gov/sites/default/files/microsites/ostp/big_data_press_release_final_2.pdf `
  • 7.
    Information Visualization &Visual Analytics • Visual bands • Human percle • Trend, clus.. • Color, size,.. • Three challe • Meaningful vi • Interaction: w • Process mo 1999
  • 8.
    Information Visualization &Visual Analytics • Visual bandwidth is enormous • Human perceptual skills are remarkable • Trend, cluster, gap, outlier... • Color, size, shape, proximity... • Three challenges • Meaningful visual displays of massive da • Interaction: widgets & window coordinati • Process models for discovery 1999 2004
  • 9.
    Information Visualization &Visual Analytics • Visual bandwidth is enormous • Human perceptual skills are remarkable • Trend, cluster, gap, outlier... • Color, size, shape, proximity... • Three challenges • Meaningful visual displays of massive data • Interaction: widgets & window coordination • Process models for discovery 1999 2004 2010
  • 10.
    Business takes action • General Dynamics buys MayaViz • Agilent buys GeneSpring • Google buys Gapminder • Oracle buys Hyperion • Microsoft buys Proclarity • InfoBuilders buys Advizor Solutions • SAP buys (Business Objects buys Xcelsius & Inxight & Crystal Reports ) • IBM buys (Cognos buys Celequest) & ILOG • TIBCO buys Spotfire
  • 11.
    Spotfire: Retinol’s rolein embryos & vision
  • 12.
  • 13.
  • 14.
    10M - 100Mpixels: Large displays
  • 15.
  • 16.
    1M-pixels & less Small mobile devices
  • 17.
    Information Visualization: Mantra • Overview, zoom & filter, details-on-demand • Overview, zoom & filter, details-on-demand • Overview, zoom & filter, details-on-demand • Overview, zoom & filter, details-on-demand • Overview, zoom & filter, details-on-demand • Overview, zoom & filter, details-on-demand • Overview, zoom & filter, details-on-demand • Overview, zoom & filter, details-on-demand • Overview, zoom & filter, details-on-demand • Overview, zoom & filter, details-on-demand
  • 18.
    . Information Visualization:Data Types • 1-D Linear Document Lens, SeeSoft, Info Mural • 2-D Map GIS, ArcView, PageMaker, Medical imagery • 3-D World CAD, Medical, Molecules, Architecture zi Vc S i • Multi-Var Spotfire, Tableau, Qliktech, Visual Insight • Temporal LifeLines, TimeSearcher, Palantir, DataMontage • Tree Cone/Cam/Hyperbolic, SpaceTree, Treemap • Network zi V f nI Pajek, UCINet, NodeXL, Gephi, Tom Sawyer o infosthetics.com visualcomplexity.com eagereyes.org flowingdata.com perceptualedge.com datakind.org visual.ly Visualizing.org infovis.org
  • 19.
    Anscombe’s Quartet 1 2 3 4 x y x y x y x y 10.0 8.04 10.0 9.14 10.0 7.46 8.0 6.58 8.0 6.95 8.0 8.14 8.0 6.77 8.0 5.76 13.0 7.58 13.0 8.74 13.0 12.74 8.0 7.71 9.0 8.81 9.0 8.77 9.0 7.11 8.0 8.84 11.0 8.33 11.0 9.26 11.0 7.81 8.0 8.47 14.0 9.96 14.0 8.10 14.0 8.84 8.0 7.04 6.0 7.24 6.0 6.13 6.0 6.08 8.0 5.25 4.0 4.26 4.0 3.10 4.0 5.39 19.0 12.50 12.0 10.84 12.0 9.13 12.0 8.15 8.0 5.56 7.0 4.82 7.0 7.26 7.0 6.42 8.0 7.91 5.0 5.68 5.0 4.74 5.0 5.73 8.0 6.89
  • 20.
    Anscombe’s Quartet 1 2 3 4 x y x y x y x y Property Value 10.0 8.04 10.0 9.14 10.0 7.46 8.0 6.58 Mean of x 9.0 8.0 6.95 8.0 8.14 8.0 6.77 8.0 5.76 Variance of x 11.0 13.0 7.58 13.0 8.74 13.0 12.74 8.0 7.71 Mean of y 7.5 9.0 8.81 9.0 8.77 9.0 7.11 8.0 8.84 Variance of y 4.12 11.0 8.33 11.0 9.26 11.0 7.81 8.0 8.47 Correlation 0.816 14.0 9.96 14.0 8.10 14.0 8.84 8.0 7.04 Linear regression y = 3 + 0.5x 6.0 7.24 6.0 6.13 6.0 6.08 8.0 5.25 4.0 4.26 4.0 3.10 4.0 5.39 19.0 12.50 12.0 10.84 12.0 9.13 12.0 8.15 8.0 5.56 7.0 4.82 7.0 7.26 7.0 6.42 8.0 7.91 5.0 5.68 5.0 4.74 5.0 5.73 8.0 6.89
  • 21.
  • 22.
    Temporal Data: TimeSearcher1.3 • Time series • Stocks • Weather • Genes • User-specified patterns • Rapid search
  • 23.
    Temporal Data: TimeSearcher2.0 • Long Time series (>10,000 time points) • Multiple variables • Controlled precision in match (Linear, offset, noise, amplitude)
  • 24.
    LifeLines: Patient Histories www.cs.umd.edu/hcil/lifelines
  • 25.
  • 26.
    LifeFlow: Aggregation Strategy Temporal Categorical Data (4 records) LifeLines2 format Tree of Event Sequences LifeFlow Aggregation www.cs.umd.edu/hcil/lifeflow
  • 27.
  • 33.
  • 34.
  • 35.
  • 36.
  • 37.
  • 38.
    EventFlow Team: Oraclesupport www.cs.umd.edu/hcil/eventflow www.umdrightnow.umd.edu/news/umd-research-team-developing-powerful-data-visualization-tool-support-oracle
  • 39.
    Treemap: Gene Ontology +Space filling + Space limited + Color coding + Size coding - Requires learning (Shneiderman, ACM Trans. on Graphics, 1992 & 2003) www.cs.umd.edu/hcil/treemap/
  • 40.
    Treemap: Smartmoney MarketMap www.smartmoney.com/marketmap
  • 41.
    Market falls steeplyFeb 27, 2007, with one exception
  • 42.
    Market falls steeplySept 22, 2011, some exceptions
  • 43.
    Market mixed, February8, 2008 Energy & Technology up, Financial & Health Care down
  • 44.
    Market rises, September1, 2010, Gold contrarians
  • 45.
    Market rises, March21, 2011, Sprint declines
  • 46.
    Treemap: Newsmap (MarcosWeskamp) newsmap.jp
  • 47.
    Treemap: WHC EmergencyRoom (6304 patients in Jan2006) Group by Admissions/MF, size by service time, color by age
  • 48.
    Treemap: WHC EmergencyRoom (6304 patients in Jan2006) (only those service time >12 hours) Group by Admissions/MF, size by service time, color by age
  • 49.
    Treemap: Supply Chain www.hivegroup.com
  • 50.
  • 51.
    Treemap: Spotfire BondPortfolio Analysis www.spotfire.com
  • 52.
    Treemap: NY Times– Car&Truck Sales www.cs.umd.edu/hcil/treemap/
  • 53.
    Treemap (Voronoi): NYTimes - Inflation www.nytimes.com/interactive/2008/05/03/business/20080403_SPENDING_GRAPHIC.html
  • 55.
  • 56.
    SocialAction • Integrates statistics & visualization • 4 case studies, 4-8 weeks (journalist, bibliometrician, terrorist analyst, organizational analyst) • Identified desired features, gave strong positive feedback about benefits of integration www.cs.umd.edu/hcil/socialaction Perer & Shneiderman, CHI2008, IEEE CG&A 2009
  • 57.
    Network from DatabaseTables www.centrifugesystems.com
  • 58.
    NodeXL: Network Overview for Discovery & Exploration in Excel www.codeplex.com/nodexl
  • 59.
    NodeXL: Network Overview forDiscovery & Exploration in Excel www.codeplex.com/nodexl
  • 60.
    NodeXL: Import Dialogs www.codeplex.com/nodexl
  • 61.
    Tweets at #WIN09Conference: 2 groups
  • 62.
  • 63.
    Twitter discussion of#GOP Red: Republicans, anti-Obama, mention Fox Blue: Democrats, pro-Obama, mention CNN Green: non-affiliated Node size is number of followers Politico is major bridging group
  • 64.
    Analogy: Clusters AreOccluded Hard to count nodes, clusters
  • 65.
    Separate Clusters AreMore Comprehensible
  • 66.
  • 67.
  • 68.
  • 69.
  • 70.
    No Location Philadelphia Patent Tech Navy SBIR (federal) PA DCED (state) Related patent 2: Federal agency Pharmaceutical/Medical 3: Enterprise Pittsburgh Metro 5: Inventors 9: Universities 10: PA DCED 11/12: Phil/Pitt metro cnty 13-15: Semi-rural/rural cnty 17: Foreign countries 19: Other states Westinghouse Electric
  • 71.
    Innovation Patterns: 11,000vertices, 26,000 edges
  • 72.
    No Location Philadelphia Innovation Clusters: People, Locations, Companies Patent Tech Navy SBIR (federal) PA DCED (state) Related patent 2: Federal agency Pharmaceutical/Medical 3: Enterprise Pittsburgh Metro 5: Inventors 9: Universities 10: PA DCED 11/12: Phil/Pitt metro cnty 13-15: Semi-rural/rural cnty 17: Foreign countries 19: Other states Westinghouse Electric
  • 74.
    Interactive Methods toReveal Patterns Filtering Node & link attribute values or statistics Clustering Cluster algorithmically by link connectivity Grouping Group based on node attributes Motif Common, meaningful structures Simplification replaced with simplified glyphs
  • 75.
  • 76.
  • 77.
    Interactive Methods toReveal Patterns Filtering Node & link attribute values or statistics Clustering Cluster algorithmically by link connectivity Grouping Group based on node attributes Motif Common, meaningful structures Simplification replaced with simplified glyphs
  • 78.
    Motif Simplification (a) Fanmotifs & glyphs (b) Connector motifs & glyphs
  • 79.
  • 80.
  • 81.
    Clique Motifs &Glyphs: 4, 5 & 6
  • 82.
  • 83.
  • 84.
  • 85.
  • 86.
  • 87.
    Analyzing Social MediaNetworks with NodeXL I. Getting Started with Analyzing Social Media Networks 1. Introduction to Social Media and Social Networks 2. Social media: New Technologies of Collaboration 3. Social Network Analysis II. NodeXL Tutorial: Learning by Doing 4. Layout, Visual Design & Labeling 5. Calculating & Visualizing Network Metrics  6. Preparing Data & Filtering 7. Clustering &Grouping III Social Media Network Analysis Case Studies 8. Email 9. Threaded Networks 10. Twitter 11. Facebook   12. WWW 13. Flickr 14. YouTube  15. Wiki Networks  www.elsevier.com/wps/find/bookdescription.cws_home/723354/description
  • 88.
    Social Media ResearchFoundation Researchers who want to - create open tools - generate & host open data - support open scholarship Map, measure & understand social media   Support tool projects to collection, analyze & visualize social media data.   smrfoundation.org
  • 89.
    Sense-Making Loop Thomas & Cook: Illuminating the Path (2004)
  • 90.
    Sense-Making Loop: Expanded Thomas & Cook: Illuminating the Path (2004)
  • 91.
    Discovery Process: SystematicYet Flexible Preparation • Own the problem & define the schedule • Data cleaning & conditioning • Handle missing & uncertain data • Extract subsets & link to related information
  • 92.
    Discovery Process: SystematicYet Flexible Preparation • Own the problem & define the schedule • Data cleaning & conditioning • Handle missing & uncertain data • Extract subsets & link to related information Purposeful exploration – Hypothesis testing • Range & distribution • Relationships & correlations • Clusters & gaps • Outliers & anomalies • Aggregation & summary • Split & trellis • Temporal comparisons & multiple views • Statistics & forecasts
  • 93.
    Discovery Process: SystematicYet Flexible Preparation • Own the problem & define the schedule • Data cleaning & conditioning • Handle missing & uncertain data • Extract subsets & link to related information Purposeful exploration – Hypothesis testing • Range & distribution • Relationships & correlations • Clusters & gaps • Outliers & anomalies • Aggregation & summary • Split & trellis • Temporal comparisons & multiple views • Statistics & forecasts Situated decision making - Social context • Annotation & marking • Collaboration & coordination • Decisions & presentations
  • 94.
    UN Millennium DevelopmentGoals To be achieved by 2015 • Eradicate extreme poverty and hunger • Achieve universal primary education • Promote gender equality and empower women • Reduce child mortality • Improve maternal health • Combat HIV/AIDS, malaria and other diseases • Ensure environmental sustainability • Develop a global partnership for development
  • 95.
    30th Anniversary Symposium May 22-23, 2013 www.cs.umd.edu/hcil
  • 96.
    For More Information • Visit the HCIL website for 700+ papers & info on videos www.cs.umd.edu/hcil • See Chapter 14 on Info Visualization Shneiderman, B. and Plaisant, C., Designing the User Interface: Strategies for Effective Human-Computer Interaction: Fifth Edition (2010) www.awl.com/DTUI • Edited Collections: Card, S., Mackinlay, J., and Shneiderman, B. (1999) Readings in Information Visualization: Using Vision to Think Bederson, B. and Shneiderman, B. (2003) The Craft of Information Visualization: Readings and Reflections
  • 97.
    For More Information • Treemaps • HiveGroup: www.hivegroup.com • Smartmoney: www.smartmoney.com/marketmap • HCIL Treemap 4.0: www.cs.umd.edu/hcil/treemap • Spotfire: www.spotfire.com • TimeSearcher: www.cs.umd.edu/hcil/timesearcher • NodeXL: nodexl.codeplex.com • Hierarchical Clustering Explorer: www.cs.umd.edu/hcil/hce • LifeLines2: www.cs.umd.edu/hcil/lifelines2 • EventFlow: www.cs.umd.edu/hcil/eventflow

Editor's Notes

  • #12 "The IN Cell Analyzer automated microscope was used to identify proteins influencing the division of human cells. After the images were analyzed, quantitative results were transferred to Spotfire DecisionSite. This screen revealed the previously unknown involvement of the retinol binding protein RBP1 in cell cycle control.(Stubbs S, & Thomas N. 2006 Methods in Enzymology; 414:1-21.) Retinol a form of Vitamin A plays a crucial role in vision and during embryonic development"  
  • #29 Using LifeFlow, 7,041 patients are aggregated into this visualization and LifeFlow immediately reveal the most common pattern, which you could not do easily in SQL. You could easily notice this huge pattern “Arrival -> ER -> Exit”, meaning patients who visited with minor injuries or simple conditions and left the hospital immediately after receiving their treatment. When hovering the mouse over, LifeFlow displays a tooltip that gives more information, such as number of patients and other statistics, and also shows the distribution of the patients. As the horizontal gap represents time, you can see from the distribution that some patients left the hospital very quickly after visiting the emergency room while some of them stayed longer. *optional The second most common pattern is “Arrival (Blue) -> ER (Pink) -> Floor (Green) -> Exit (Cyan)”, meaning patients who were admitted to observe the conditions and then everything went well so they left the hospital. You can also use the horizontal gap to compare these patients with the patients who exit from the emergency room. Comparing the gap from pink to cyan and pink to green, you can see that the gap from pink to green is smaller than pink to cyan, so the patients were transferred to Floor faster than exit the hospital in average. You have seen the two most common cases, now I will remove the common patterns so we can analyze the less frequent patterns.
  • #30 After removing all the common cases, we have 344 patients left. These are mostly the patients who were admitted. There are many information that I can explain from this visualization here, but I will go straight into the case that our physician partners are mostly interested in. The mouse is pointing at this sequence, which represents the “bounce backs” patients, meaning patients who were transferred from ICU to Floor because they seemed to get better, however, they were transferred back to the ICU. So the physician are interested in finding these patients to analyze what made them made the wrong decisions. *optional Another case is the step ups, which means the patients whose level of care were escalated to higher level, you can see from the visualization that there were patients who were transferred from ER to Floor (green) to ICU (red) and IMC (orange). The number of these patients and the average transferred time could be compare to the hospital standards to measure the quality of care.
  • #31 Ben: This slide is optional. You can use it to show that when you click on the bounce backs patients, you can get the details of each patient in LifeLines2 view.
  • #32 Another interesting feature is you can align by a particular event. For example, if you want to know what happened before and after the patients went to the ICU, you can align by ICU. The dash line separate between what happened before and what happened after. You can see that the ICU patients mostly came from the ER (pink), and most of them were transferred to Floor (green) after that. Unfortunately, some of them died after they were transferred to the ICU (black). From this visualization, you may notice a small pattern in the bottom. Let me zoom in.
  • #33 So this patient was dead before transferred to the ICU, which is impossible. Of course, this must be problem with data entry. But we may never notice it if the data are hidden in the database. Therefore, you can see that LifeFlow support this kind of analysis by giving overview, showing common trends, providing summary of every sequences, you can do SQL and calculate average for every transfer if you like, but in LifeFlow, it is right there, you just need to move your mouse over. showing every possible transfer pattern and may led you to a discovery of surprising pattern.
  • #55 Live Demonstration
  • #58 Aligning sales and marketing is essential for success. The graph on the left shows sales people linked to opportunities, including industry. The thicker the line, the higher the probability of closing the deal. The larger the dollar sign, the bigger the deal. Sullivan, Vazquez and Distefano are performing the best. The upper right shows the number of deals by stage in the sales cycle. The blue bubble chart shows potential revenue by marketing program and stage in the sales cycle. Search engine optimization and inbound links from Web sites have the biggest impact. Armed with this information, marketing managers can advertise to the financial services and manufacturing sectors through specific tactics, and sales managers can see the performance of the reps and the industries where they are successful.
  • #62 Chapter 3, Figure 1 (page 6). A NodeXL social media network diagram of relationships among Twitter users mentioning the hashtag “#WIN09” used by attendees of a conference on Network Science at NYU in September 2009. Each user’s node is sized proportional to the number of tweets they have ever made to that date.
  • #63 Chapter 3, Figure 1 (page 6). A NodeXL social media network diagram of relationships among Twitter users mentioning the hashtag “#WIN09” used by attendees of a conference on Network Science at NYU in September 2009. Each user’s node is sized proportional to the number of tweets they have ever made to that date.
  • #64 Figure 13.24. NodeXL network of Flickr users who comment on Marc_Smith’s photos (network depth 1.5; edge weight≥4).