Download as PDF, PPTX

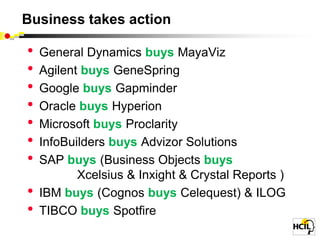
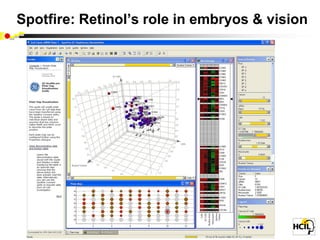
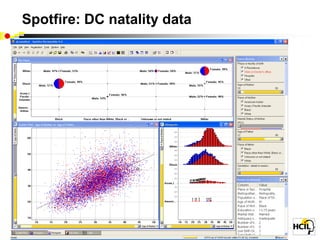
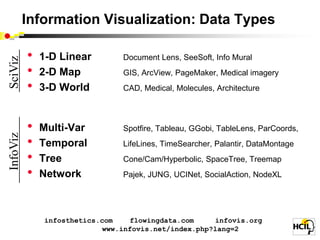
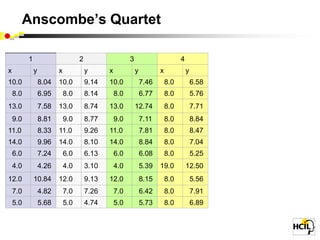
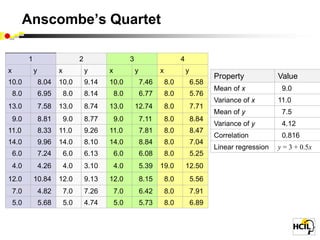
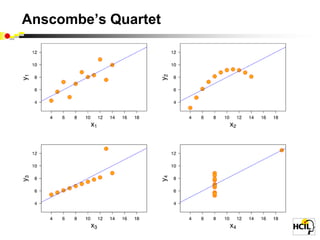
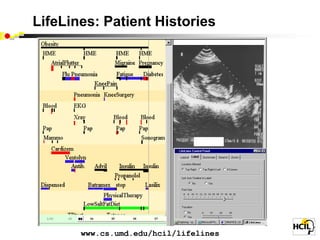
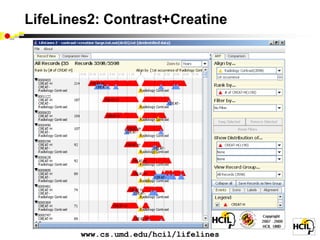
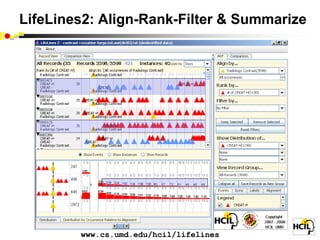
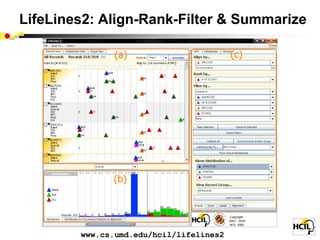
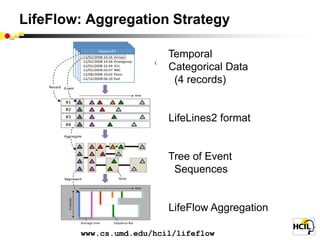
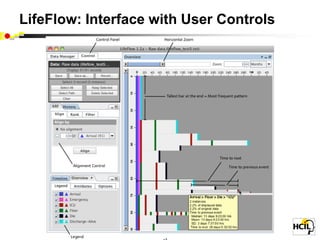
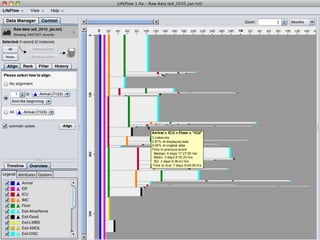
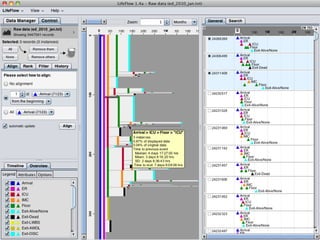
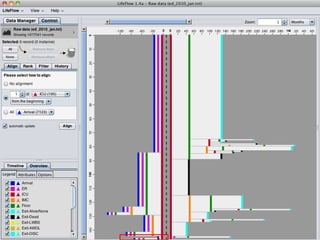
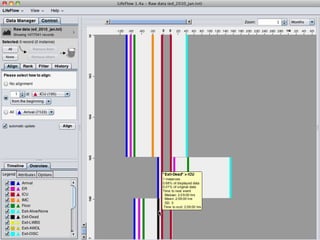
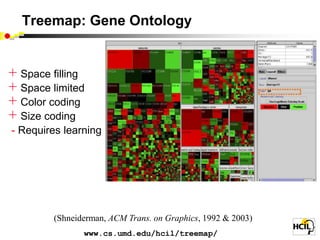
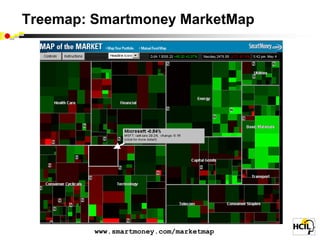
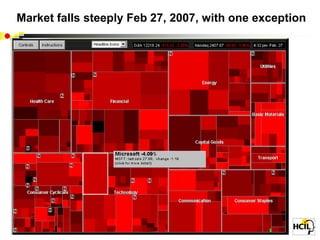
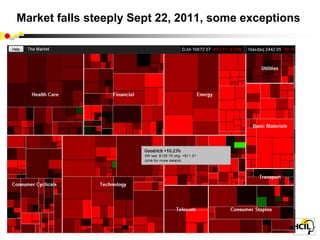
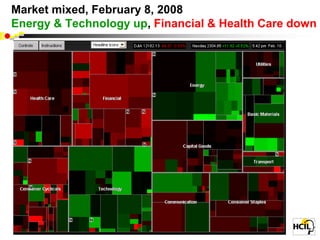
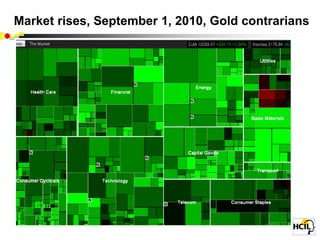
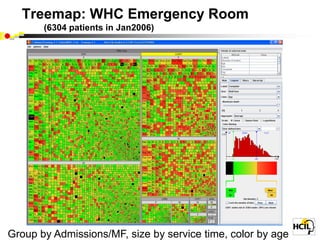
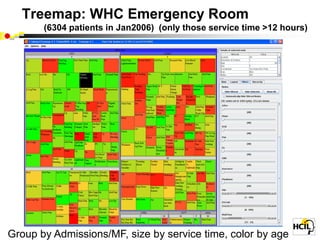
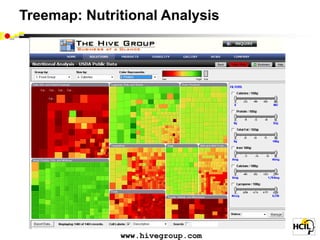
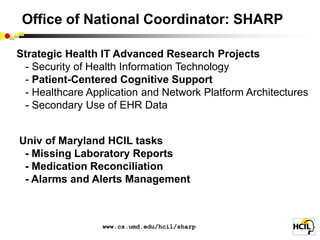
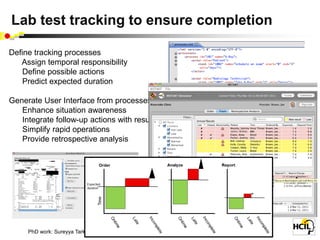
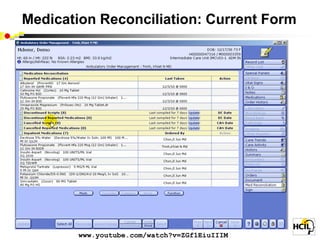
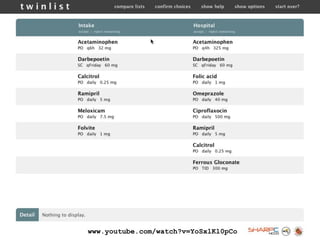
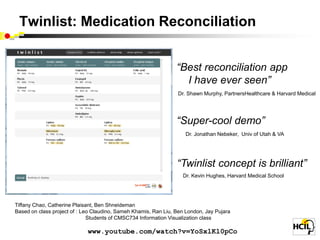
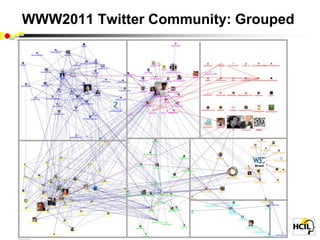
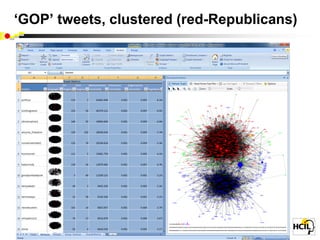
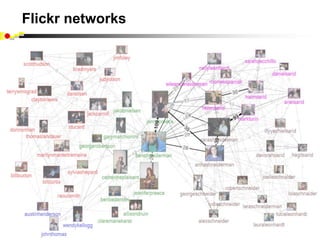
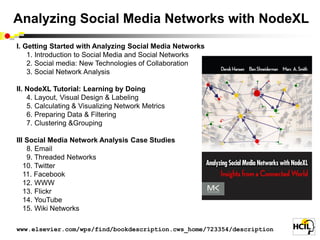

The document focuses on information visualization in medical informatics and highlights various design issues, data types, and visualization strategies used in healthcare. It discusses challenges in creating meaningful visual displays of massive data, interaction designs, and the application of visualization tools like treemaps and network analysis to improve healthcare operations and patient management. Additionally, it touches on significant acquisitions in the visualization space and references ongoing academic research and projects at the University of Maryland's Human-Computer Interaction Lab.


![ONFH[AVN HIP] -TRIPLE REGIME -A NOVAL SURGICAL CONCEPT .pptx](https://cdn.slidesharecdn.com/ss_thumbnails/onfhavnhip2026koaconcalicutdrgokuldevdrmashraf-260210064517-213ec005-thumbnail.jpg?width=640&height=640&fit=bounds)


![CTEV [ clubfoot] DR ARUN LAL ,DR MOHAMED ASHRAF travancore medical college k...](https://cdn.slidesharecdn.com/ss_thumbnails/ctevclubfootdrarunlaldrmohamedashraftravancoremedicalcollegekollamkeralaindia-260208063247-18fc466c-thumbnail.jpg?width=640&height=640&fit=bounds)