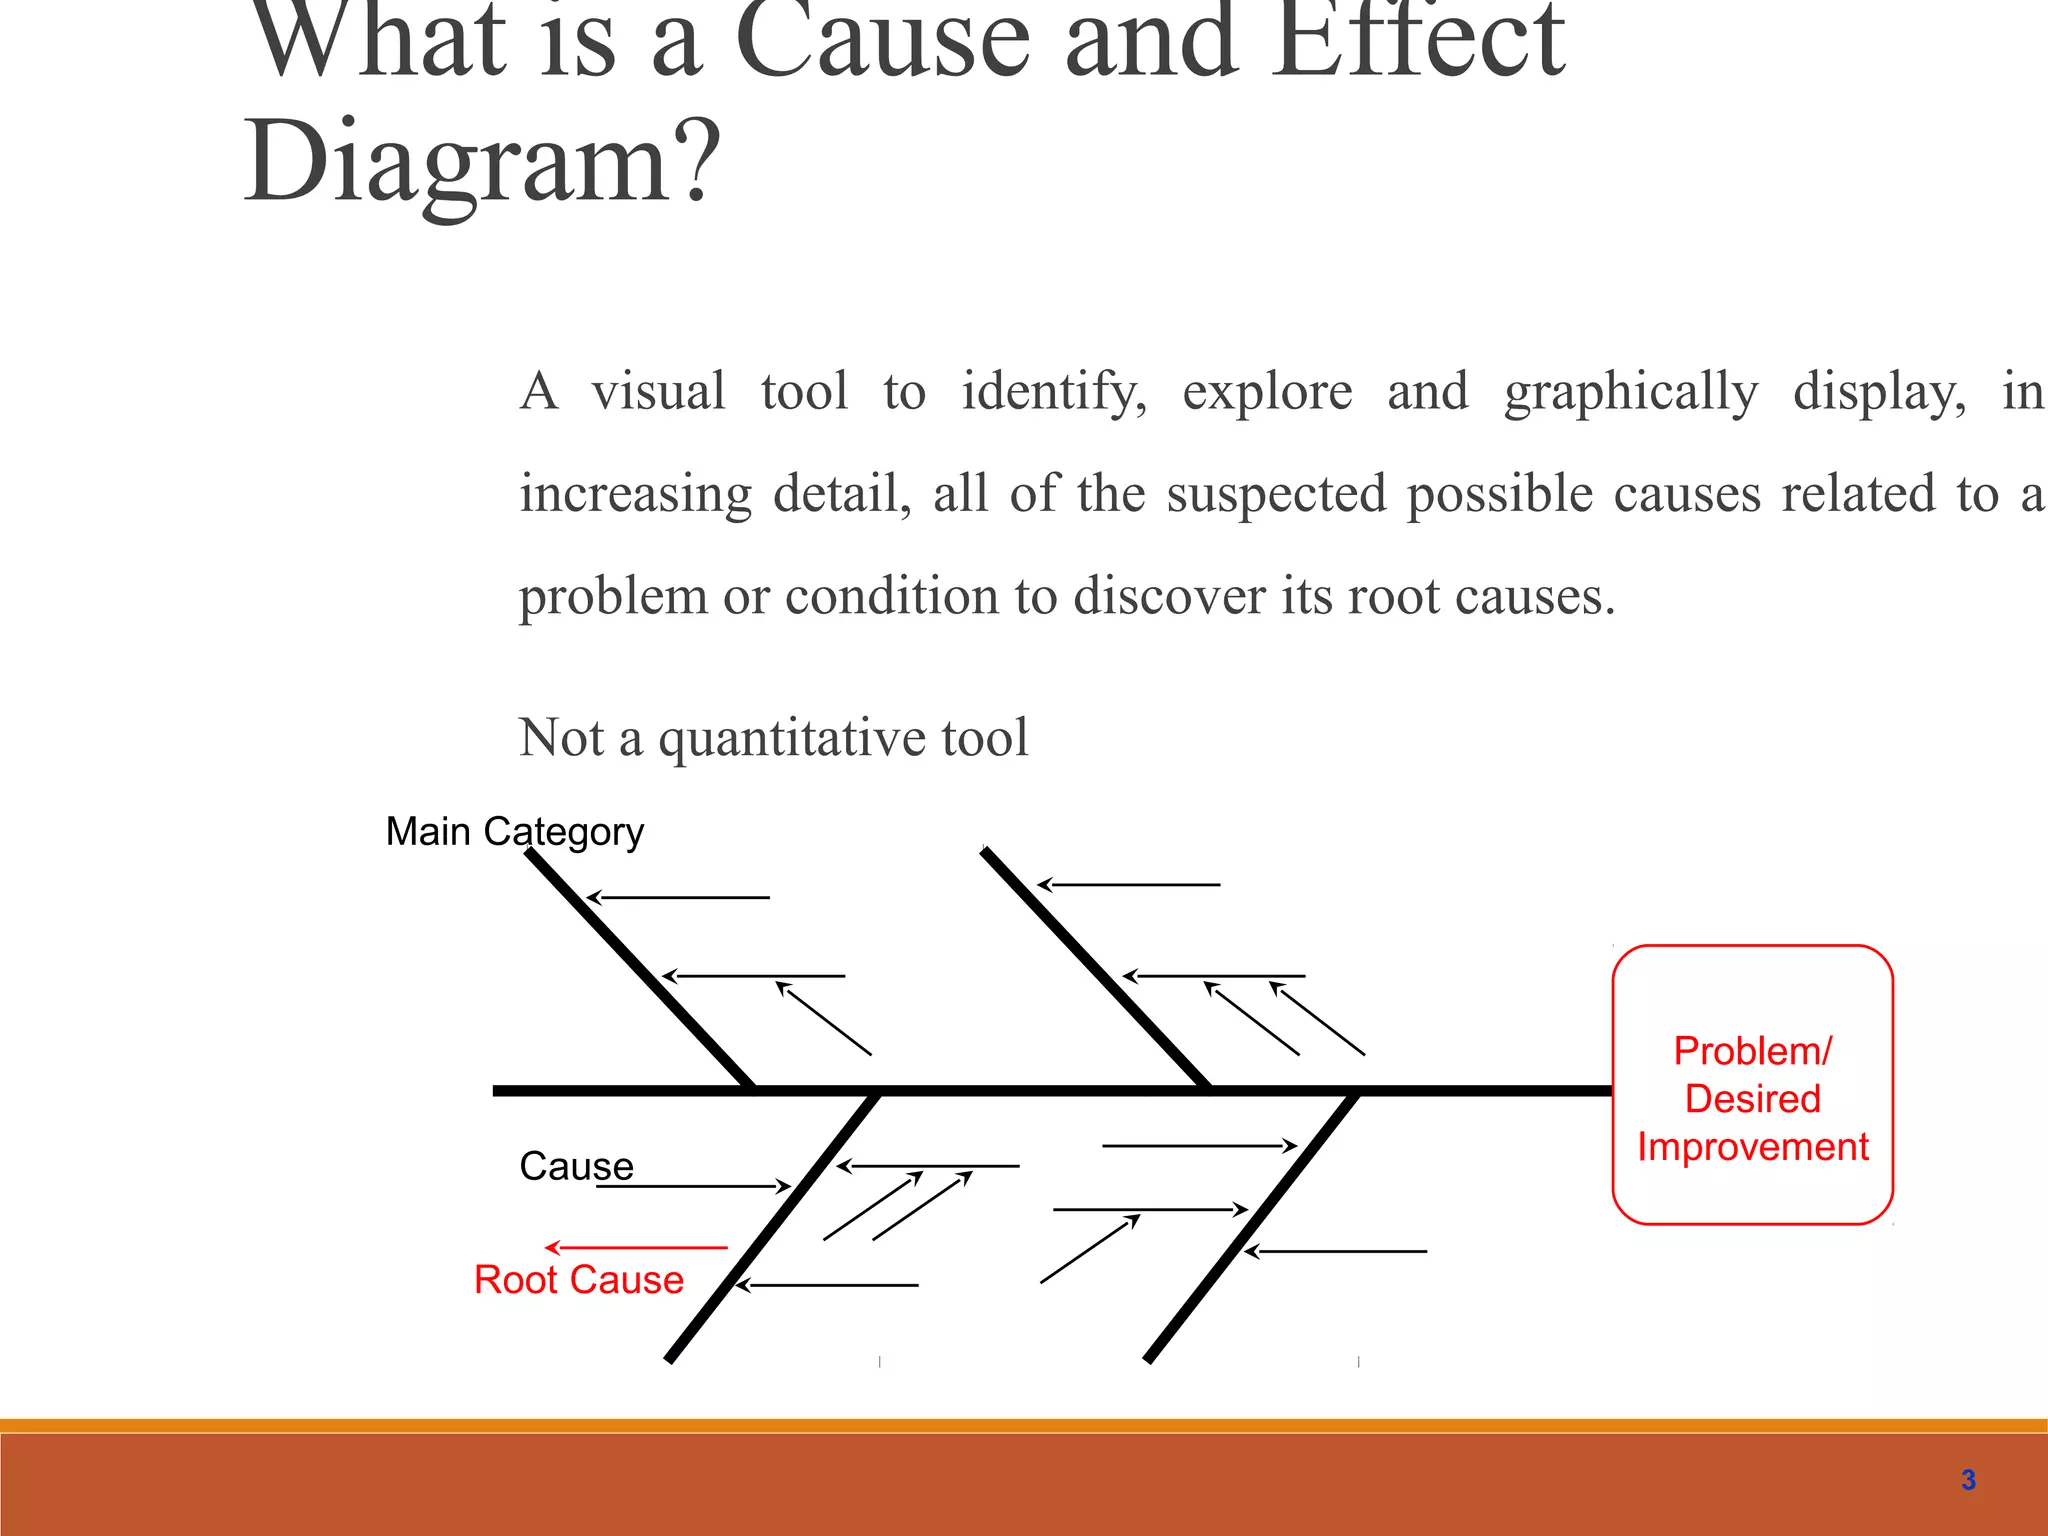
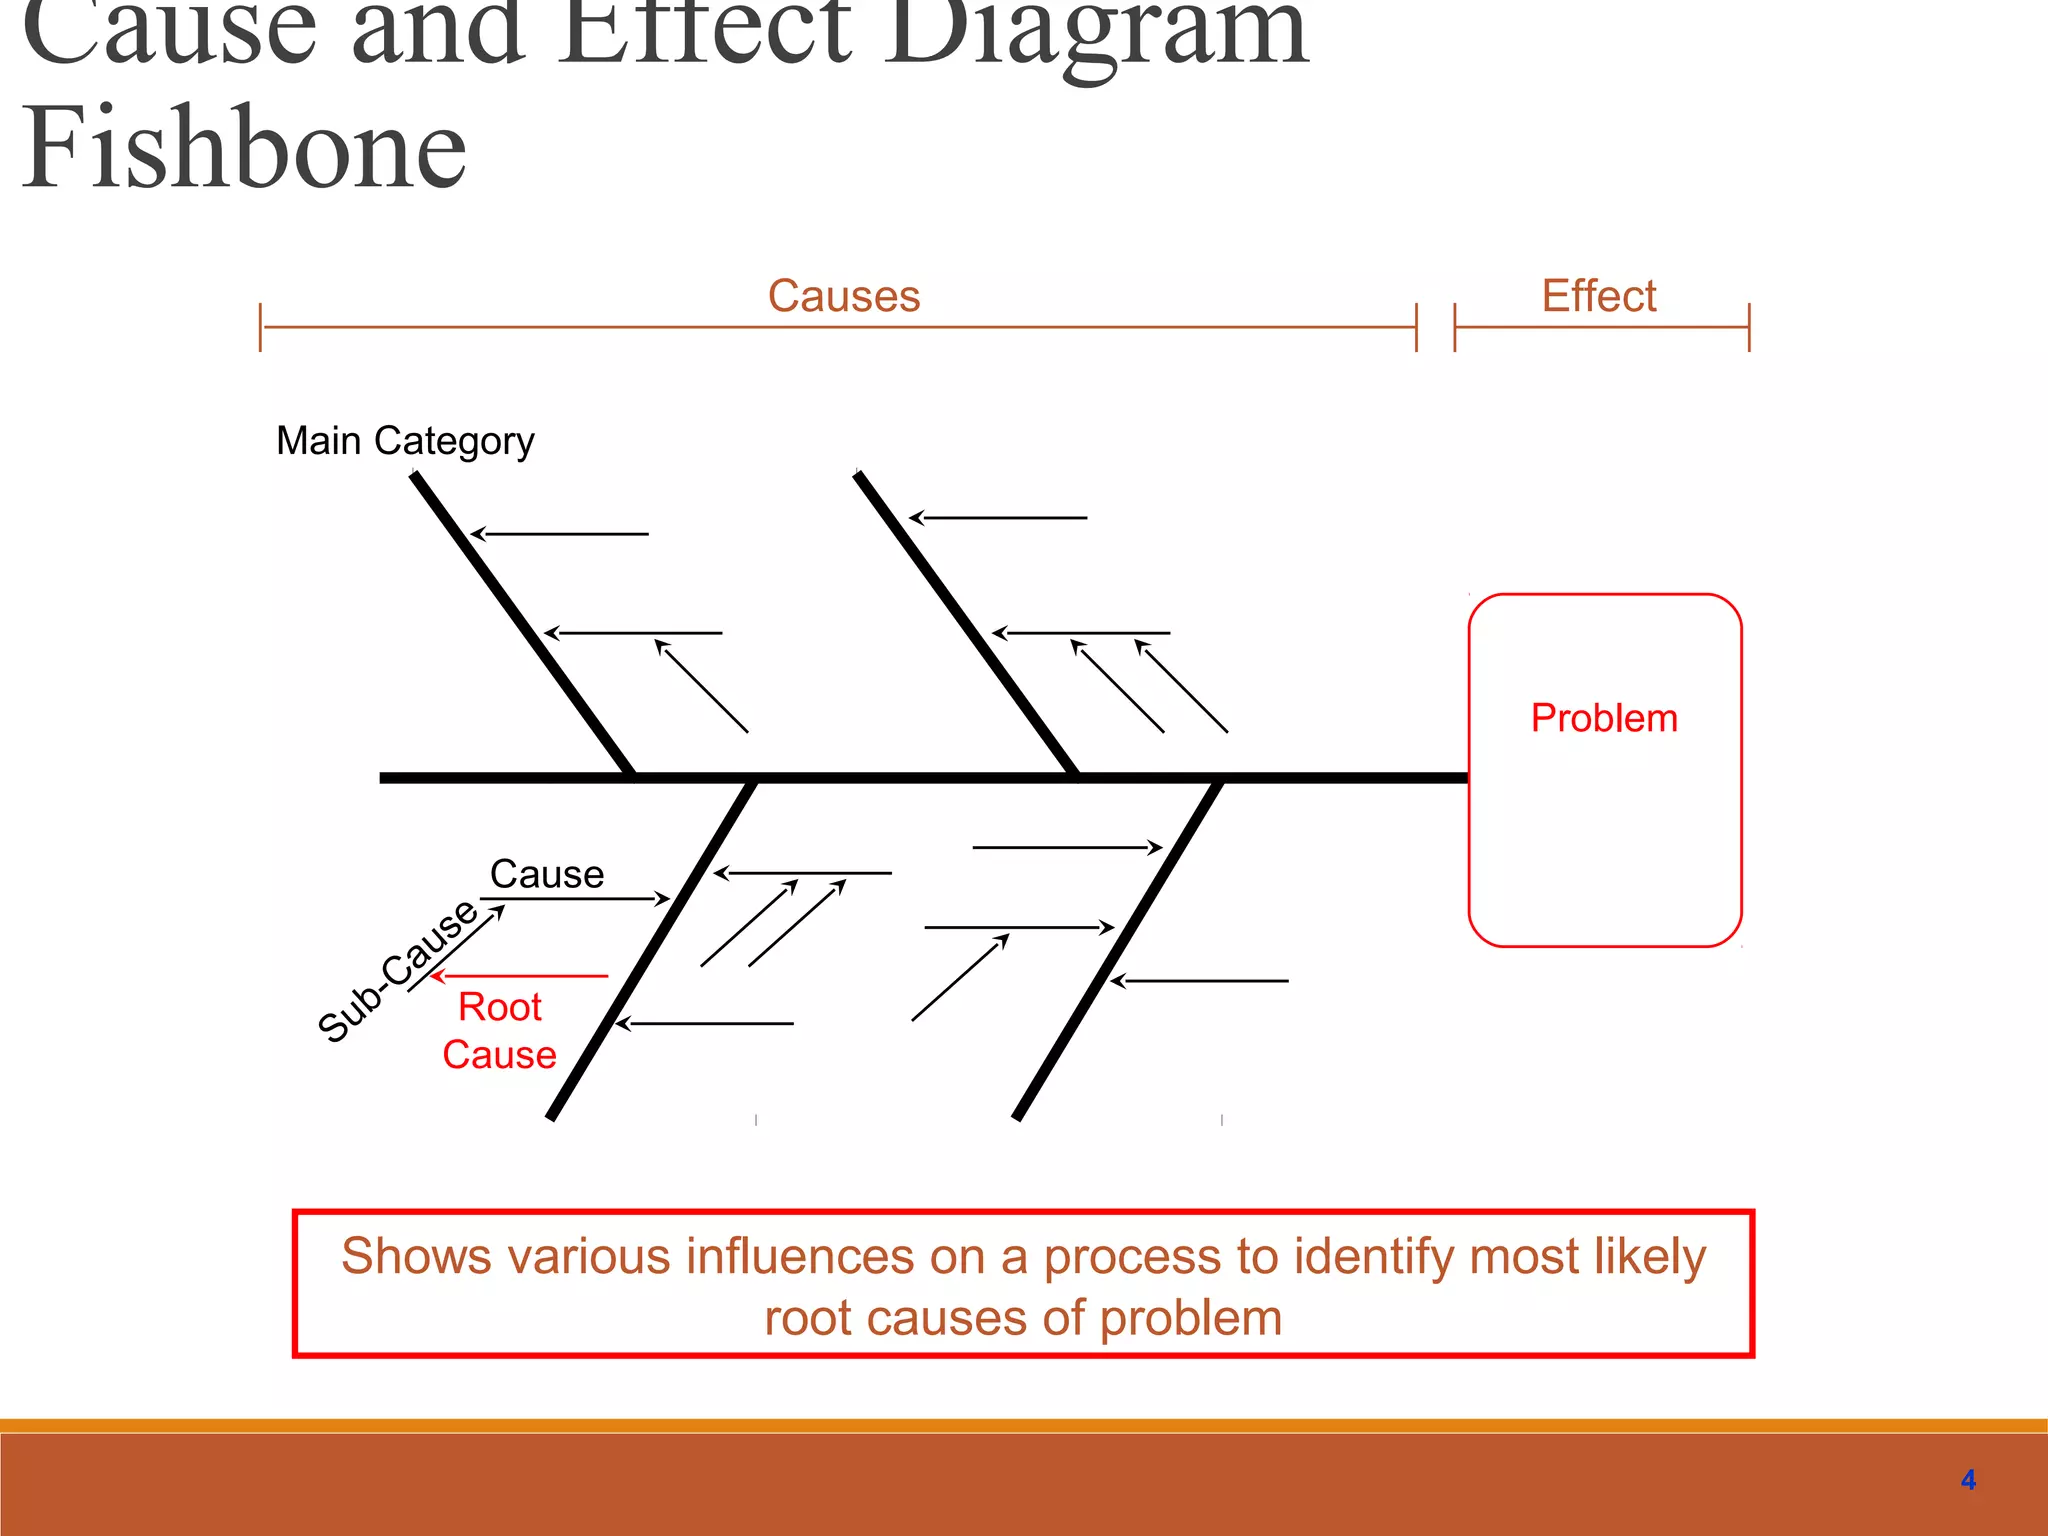
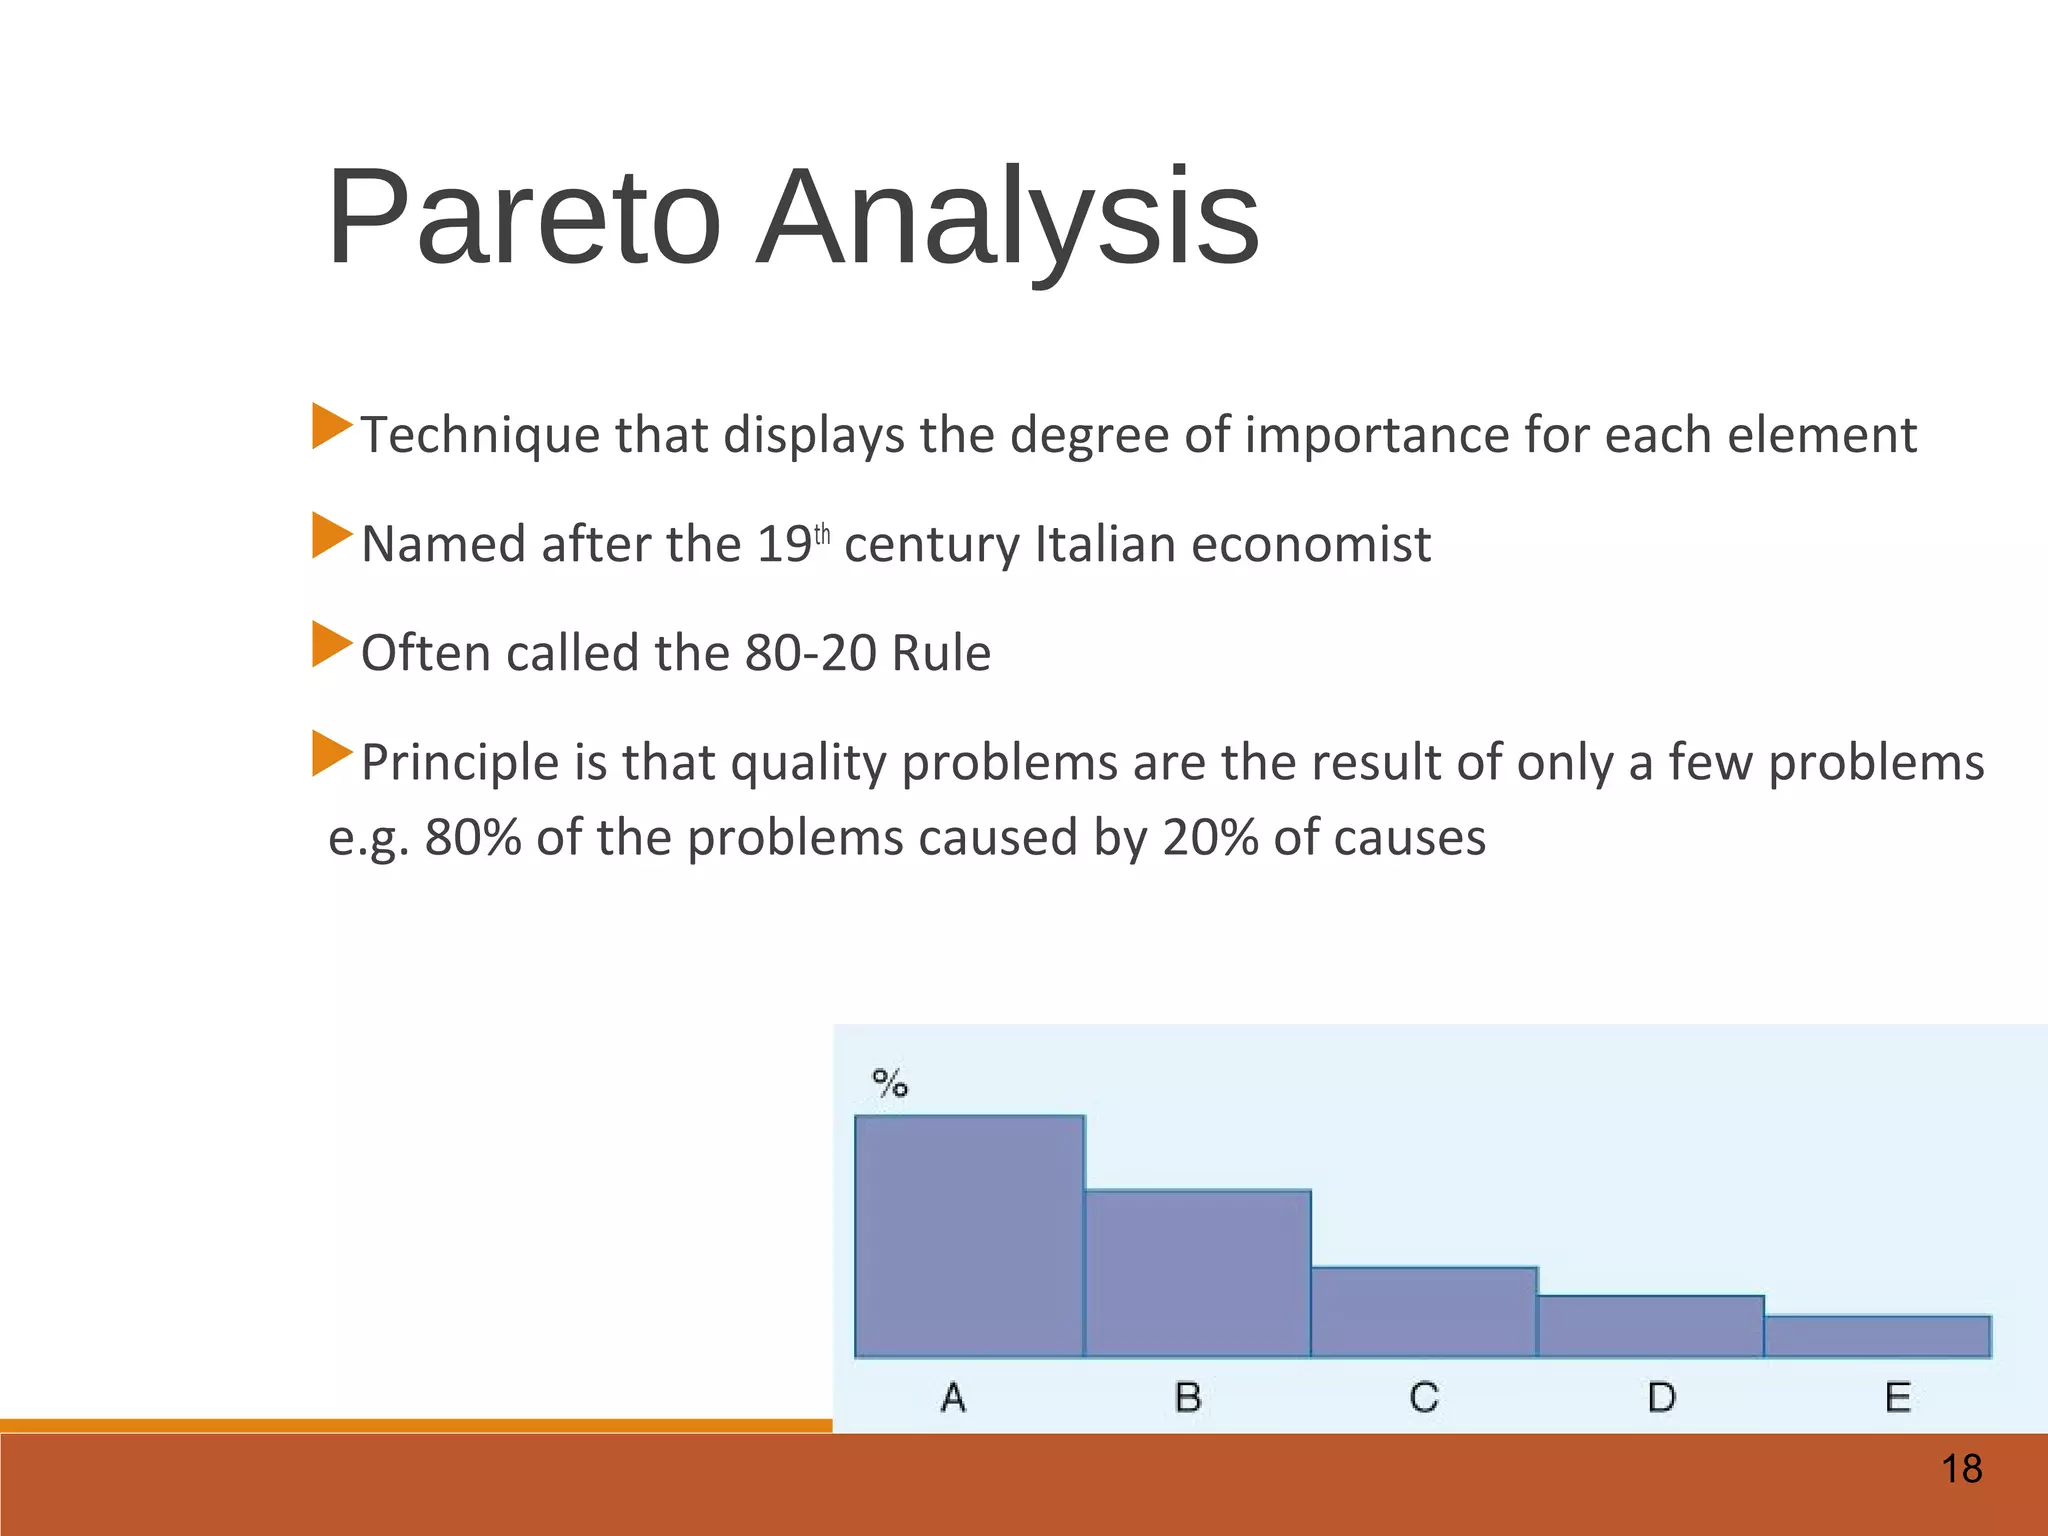
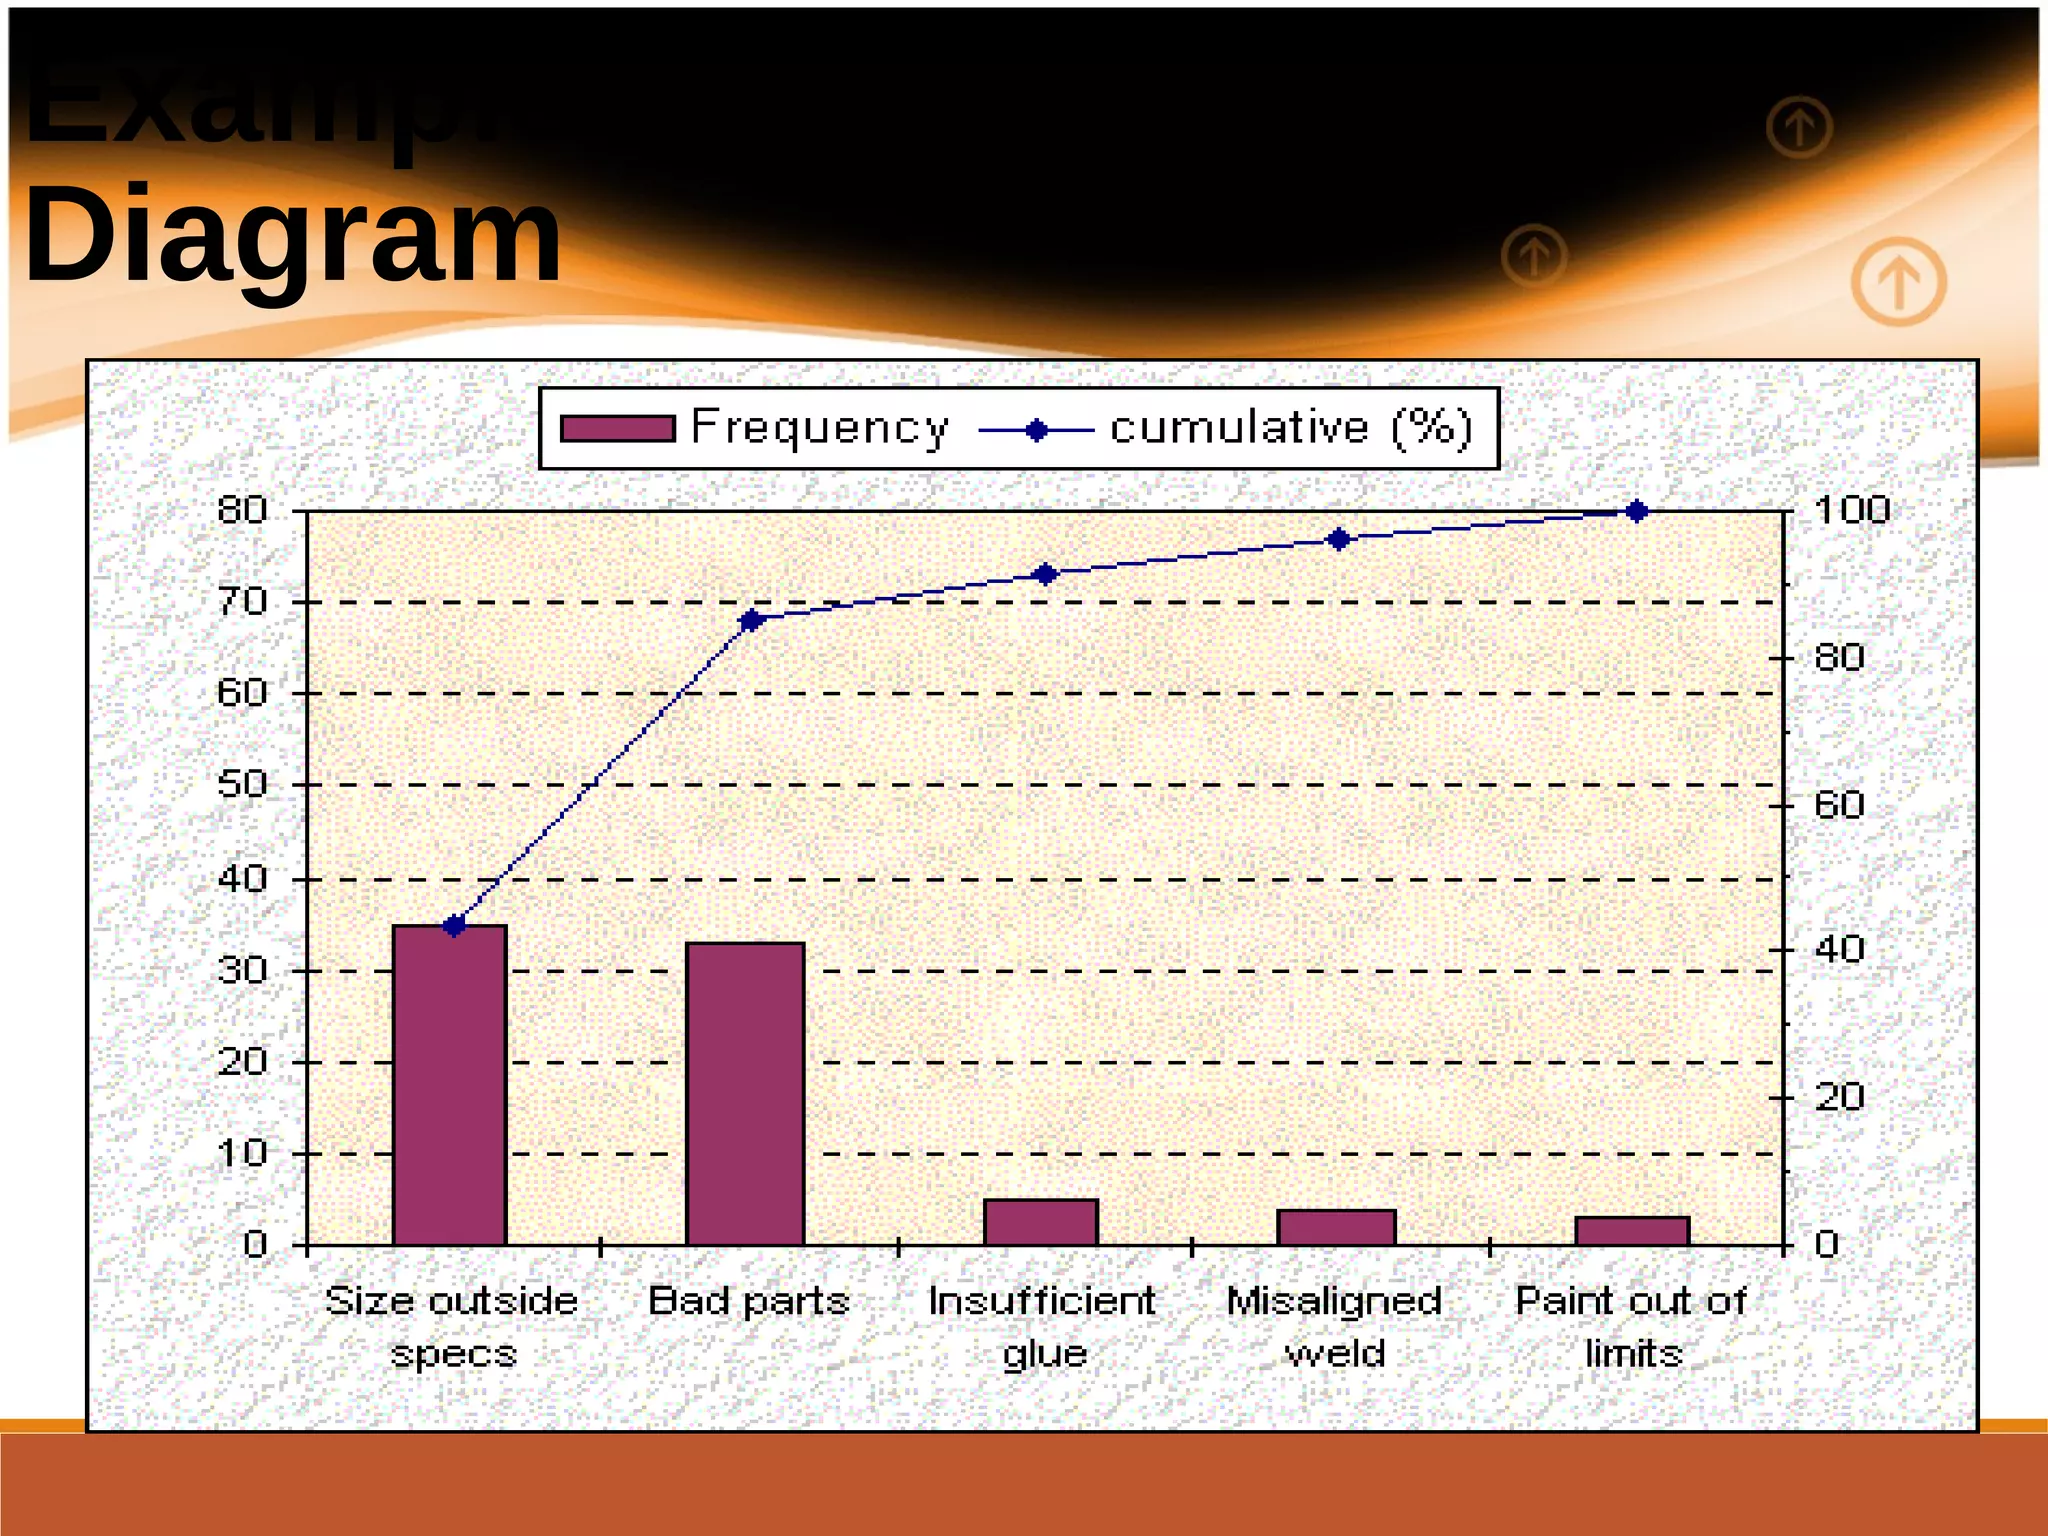
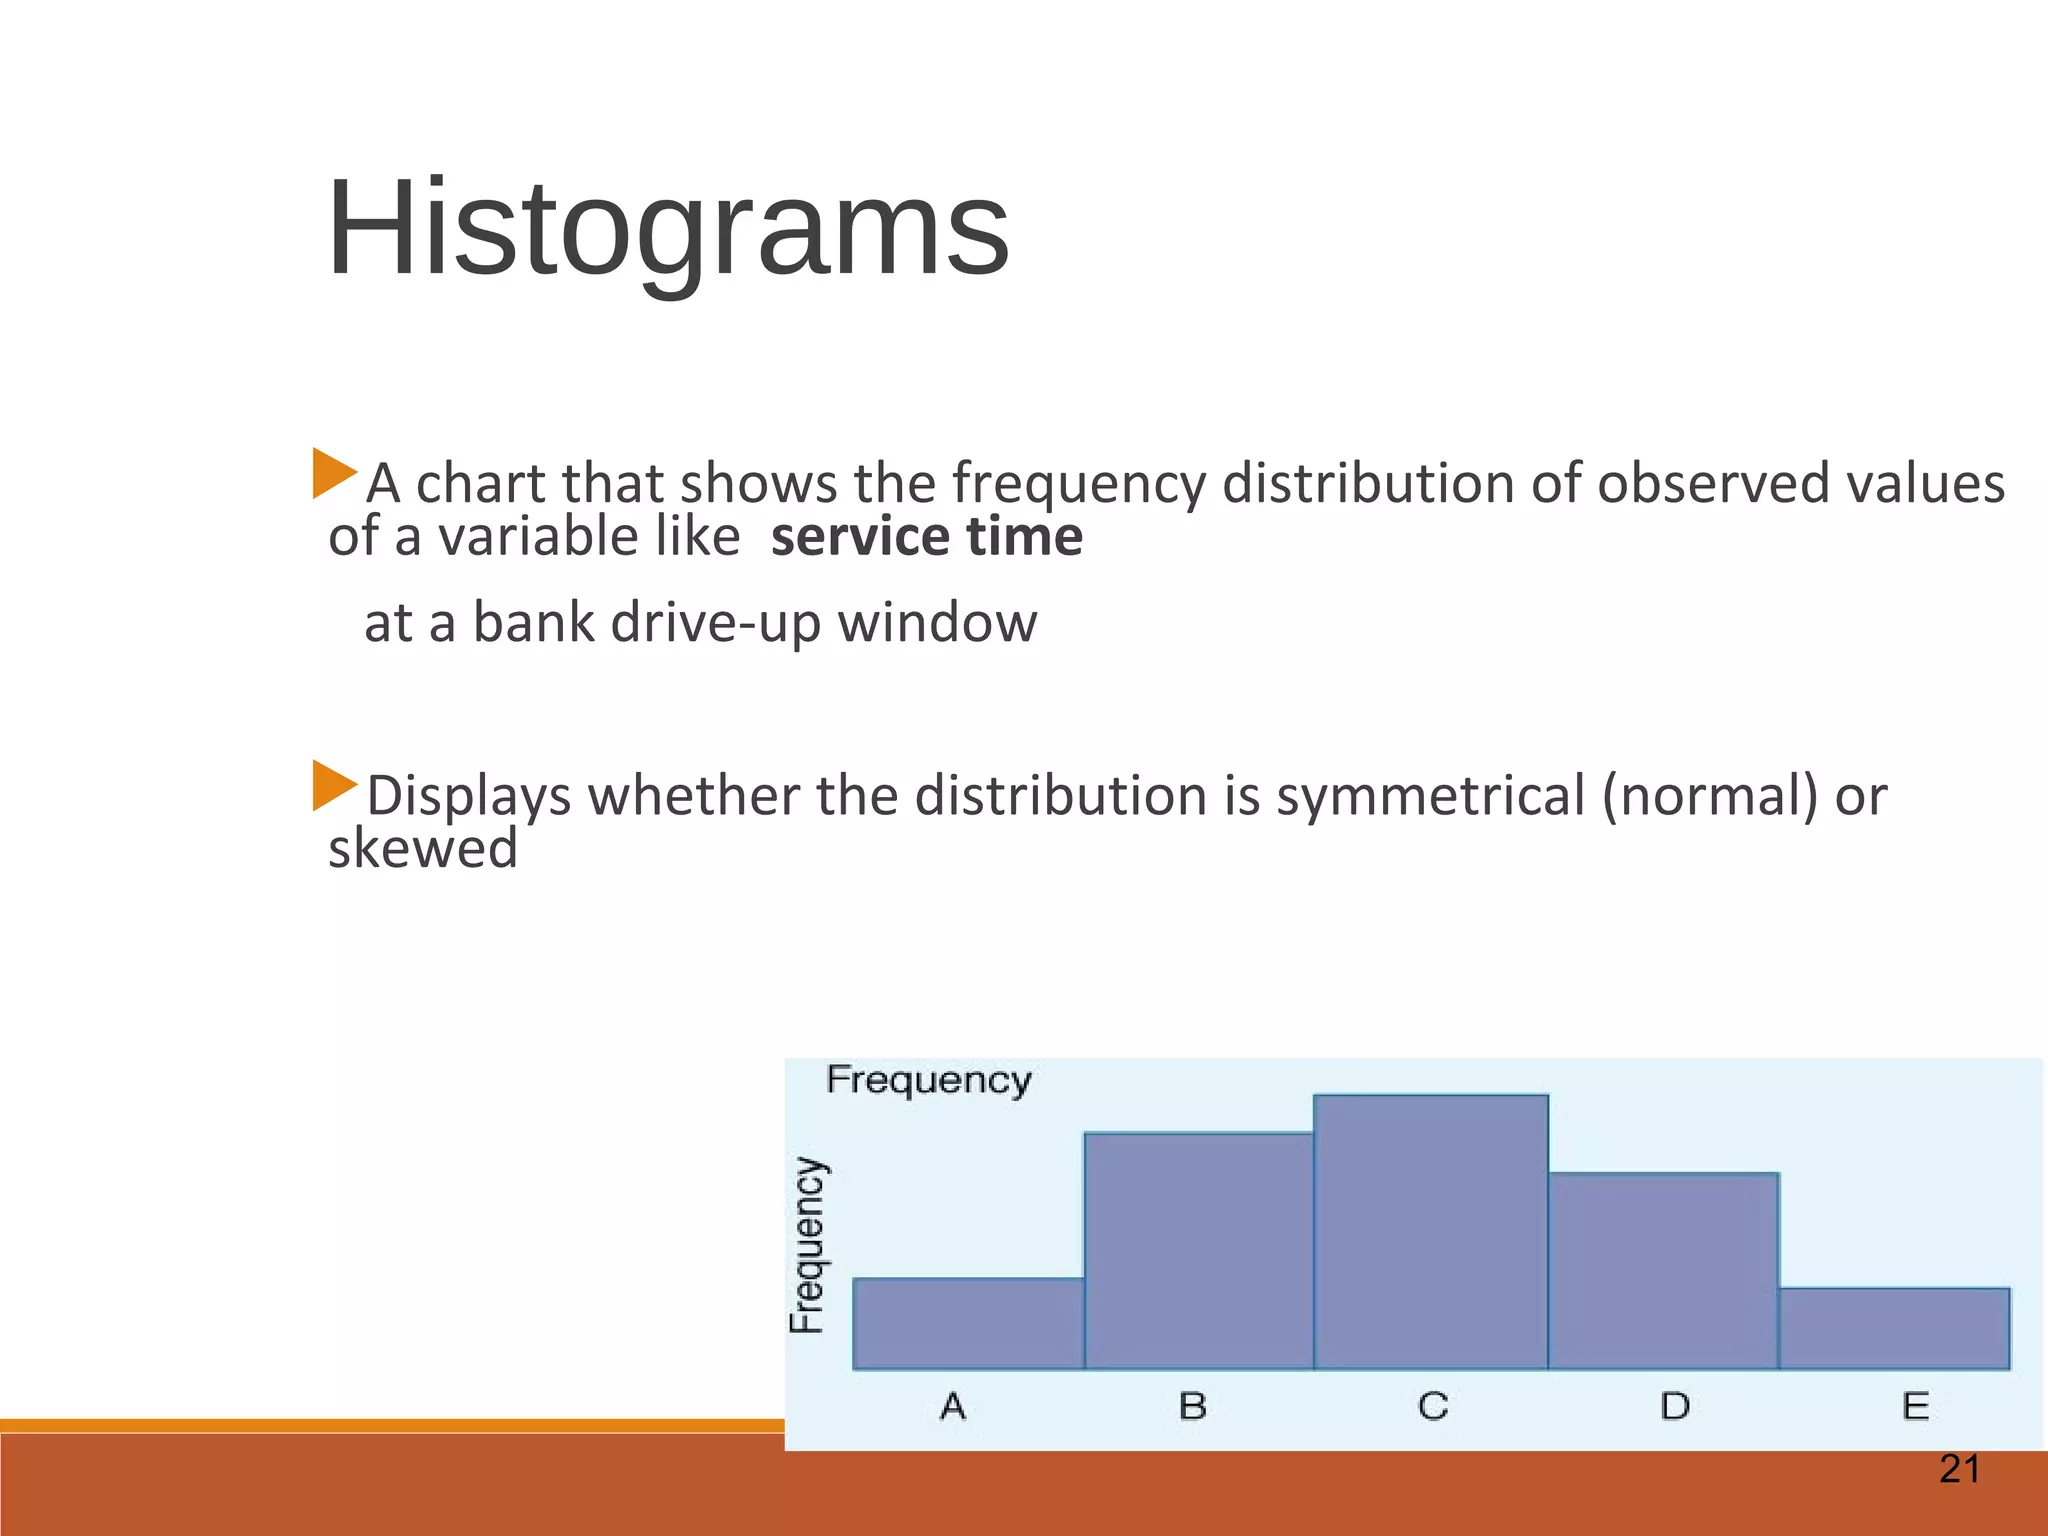
1
Basic Seven Tools of Quality
Cause-and-Effect Diagrams
Flowcharts
Checklists
Control Charts
Scatter Diagrams
Pareto Analysis
Histograms
Cause and Effect Diagram?
 Ishakawa Diagram for the inventor, Dr. Kaoru Ishakawa.
 It is also known as a Fishbone Diagram or Ishikawa Diagram or
herringbone diagrams or Fishikawa.
 The most useful tool for identifying the causes of problems.
 Common uses of the Ishikawa diagram are productdesign and
quality defect prevention to identify potential factors causing an
overall effect.
3
What is a Cause and Effect
Diagram?
A visual tool to identify, explore and graphically display, in
increasing detail, all of the suspected possible causes related to a
problem or condition to discover its root causes.
Not a quantitative tool
Problem/
Desired
Improvement
Main Category
Cause
Root Cause
4
Causes Effect
Shows various influences on a process to identify most likely
root causes of problem
Problem
Main Category
Cause
Sub-Cause
Root
Cause
Cause and Effect Diagram
Fishbone
5
Why Use Cause & Effect Diagrams?
Focuses team on the content of the problem
Creates a snapshot of the collective knowledge of team
Creates consensus of the causes of a problem
Builds support for resulting solutions
Focuses the team on causes not symptoms
To discover the most probable causes for further analysis
To visualize possible relationships between causes for any problem current or future
To pinpoint conditions causing customer complaints, process errors or non-conforming products
To provide focus for discussion
6
MethodsMaterials
Machinery Manpower
Maintenance
Problem/
Brainstorm to determine root causes and
add those as small branches off major bones
Constructing Cause & Effect Diagrams
7
Construction
constructed two ways:
1.Paper and pen
Usually more effective when working in a team
May take multiple sheets of flip chart paper
Many teams find it helpful to do the flip chart method first
because it lends itself to group dynamics. Everyone can
see and participate easier.
1. Minitab software
Very helpful when sharing diagram with an audience
outside of your team
8
Example: Delayed Flight Departures
Equipment Personnel
Procedure
Material
Other
Aircraft late to gate
Late arrival
Gate occupied
Mechanical failures
late pushback tug
Weather
Air traffic
Late food service
Late fuel
Late baggage to aircraft
Gate agents cannot process passengers quickly enough
Too few agents
Agents undertrained
Agents undermotivated
Agents arrive at gate late
Late cabin cleaners
late or unavailable cockpit crews
Late or unavailable cabin crews
poor announcement of departures
weight an balance sheet late
Delayed checkin procedure
Confused seat selection
Passengers bypass checkin counter
Checking oversize baggage
Issuance of boarding pass
Acceptance of late passengers
cutoff too close to departure time
Desire to protect late passengers
Desire to help company’s income
Poor gate locations
Delayed
Flight
Departures
9
Flowcharts
This is a picture of a process that shows the sequence of steps performed.
It is also called a process map.
Used to document the detailed steps in a process
Often the first step in Process Re-Engineering
10
Example: Process at Departure
Gate
 Scatter diagrams illustrate relationships between variables. Typically the
variables represent possible causes and effects obtained from cause-and-
effect diagrams.
Scatter Diagrams
13
Checklist
Simple data check-off sheet designed to identify type of
quality problems at each work station; per shift, per
machine, per operator
14
Control Charts
Important tool used in Statistical Process Control – Chapter 6
The UCL and LCL are calculated limits used to show when process is
in or out of control
Control Chart
Control charts are considered as the backbone of statistical process control
and were first proposed by Walter Shewhart.
16
Scatter Diagrams
A graph that shows how two variables are related to one
another
Data can be used in a regression analysis to establish
equation for the relationship
Pareto Diagrams
Pareto analysis is a technique for prioritizing types or sources of problems. It
separates the “vital few” from the “trivial many” and provides help in
selecting directions for improvement.
18
Pareto Analysis
Technique that displays the degree of importance for each element
Named after the 19th
century Italian economist
Often called the 80-20 Rule
Principle is that quality problems are the result of only a few problems
e.g. 80% of the problems caused by 20% of causes
Example of a Pareto
Diagram
Histograms
This is a graphical representation of the variation in a set of data. It shows the
frequency or number of observations of a particular value or within a specified
group.
It provides clues about the characteristics of the population from which a
sample is taken.
21
Histograms
A chart that shows the frequency distribution of observed values
of a variable like service time
at a bank drive-up window
Displays whether the distribution is symmetrical (normal) or
skewed
What is BenchmarkingWhat is Benchmarking
A method for identifying and importing bestA method for identifying and importing best
practices in order to improve performancepractices in order to improve performance
The process of learning, adapting, andThe process of learning, adapting, and
measuring outstanding practices and processesmeasuring outstanding practices and processes
from any organization to improve performancefrom any organization to improve performance
Why BenchmarkWhy Benchmark
Identify opportunities to improveIdentify opportunities to improve
performanceperformance
Learn from others’ experiencesLearn from others’ experiences
Set realistic but ambitious targetsSet realistic but ambitious targets
Uncover strengths in one’s own organizationUncover strengths in one’s own organization
Better prioritize and allocate resourcesBetter prioritize and allocate resources
Citizens demand effective and responsiveCitizens demand effective and responsive
governmentgovernment
Voters resent waste of tax dollarsVoters resent waste of tax dollars
People ask for greater accountability ofPeople ask for greater accountability of
governmentgovernment
Weak economy forces government to provideWeak economy forces government to provide
more services with less resourcemore services with less resource
Public SectorPublic Sector
BenchmarkingBenchmarking
Types of Benchmarking: 1Types of Benchmarking: 1
Strategic BenchmarkingStrategic Benchmarking
How public, private, and nonprofitHow public, private, and nonprofit
organizations compare with each other. Itorganizations compare with each other. It
moves across industries and cities to determinemoves across industries and cities to determine
what are the best strategic outcomes.what are the best strategic outcomes.
Types of Benchmarking: 2Types of Benchmarking: 2
Performance BenchmarkingPerformance Benchmarking
How public, private, and nonprofitHow public, private, and nonprofit
organizations compare themselves with eachorganizations compare themselves with each
other in terms of product and service. Itother in terms of product and service. It
focuses on elements of cost, technical quality,focuses on elements of cost, technical quality,
service features, speed, reliability, and otherservice features, speed, reliability, and other
performance comparisons.performance comparisons.
Types of Benchmarking: 3Types of Benchmarking: 3
Process BenchmarkingProcess Benchmarking
How public, private, and nonprofitHow public, private, and nonprofit
organizations compare through theorganizations compare through the
identification of the most effective operatingidentification of the most effective operating
practices from many organizations that performpractices from many organizations that perform
similar work processes.similar work processes.
When not to BenchmarkWhen not to Benchmark
Target is not critical to the core businessTarget is not critical to the core business
functionsfunctions
Customer’s requirement is not clearCustomer’s requirement is not clear
Key stakeholders are not involvedKey stakeholders are not involved
Inadequate resources to carry throughInadequate resources to carry through
No plan for implementing findingsNo plan for implementing findings
Fear of sharing information with otherFear of sharing information with other
organizationsorganizations
Benchmarking ProcessBenchmarking Process
Planning
Collecting
Data
Analysis
Improving
Practices
1. Planning1. Planning
Determine the purpose and scope of theDetermine the purpose and scope of the
projectproject
Select the process to be benchmarkedSelect the process to be benchmarked
Choose the teamChoose the team
Define the scopeDefine the scope
Develop a flow chart for the processDevelop a flow chart for the process
Establish process measuresEstablish process measures
Identify benchmarking partnersIdentify benchmarking partners
2. Collecting Data2. Collecting Data
Conduct background research to gainConduct background research to gain
thorough understanding on the process andthorough understanding on the process and
partnering organizationspartnering organizations
Use questionnaires to gather informationUse questionnaires to gather information
necessary for benchmarkingnecessary for benchmarking
Conduct site visits if additional information isConduct site visits if additional information is
neededneeded
Conduct interviews if more detail informationConduct interviews if more detail information
is neededis needed
3. Analysis3. Analysis
Analyze quantitative data of partneringAnalyze quantitative data of partnering
organizations and your organizationorganizations and your organization
Analyze qualitative data of partneringAnalyze qualitative data of partnering
organizations and your organizationorganizations and your organization
Determine the performance gapDetermine the performance gap
4. Improving Practices4. Improving Practices
Report findings and brief managementReport findings and brief management
Develop an improvement implementationDevelop an improvement implementation
planplan
Implement process improvementsImplement process improvements
Monitor performance measurements andMonitor performance measurements and
track progresstrack progress
Recalibrate the process as neededRecalibrate the process as needed
Failure Modes Effect Analysis
(FMEA)
Benefits
Allows us to identify areas of our process that most impact our
customers
Helps us identify how our process is most likely to fail
Points to process failures that are most difficult to detect
35
Application Examples
Manufacturing: A manager is responsible for moving a
manufacturing operation to a new facility. He/she wants to
be sure the move goes as smoothly as possible and that
there are no surprises.
Design: A design engineer wants to think of all the
possible ways a product being designed could fail so that
robustness can be built into the product.
Software: A software engineer wants to think of possible
problems a software product could fail when scaled up to
large databases. This is a core issue for the Internet.
36
What Is A Failure Mode?
A Failure Mode is:
◦ The way in which the component, subassembly, product, input, or process
could fail to perform its intended function
◦Failure modes may be the result of upstream operations
or may cause downstream operations to fail
◦ Things that could go wrong
37
What Can Go
Wrong?
FMEAWhy
◦ Methodology that facilitates process improvement
◦ Identifies and eliminates concerns early in the development of a process or
design
◦ Improve internal and external customer satisfaction
◦ Focuses on prevention
◦ FMEA may be a customer requirement (likely contractual)
◦ FMEA may be required by an applicable
Quality Management System Standard (possibly ISO)
38
FMEA
A structured approach to:
◦ Identifying the ways in which a product or process can fail
◦ Estimating risk associated with specific causes
◦ Prioritizing the actions that should be taken to reduce risk
◦ Evaluating design validation plan (design FMEA) or current control plan
(process FMEA)
39
When to Conduct an
FMEA
Early in the process improvement investigation
When new systems, products, and processes are being
designed
When existing designs or processes are being changed
When carry-over designs are used in new applications
After system, product, or process functions are defined,
but before specific hardware is selected or released to
manufacturing
40
History of FMEA
First used in the 1960’s in the Aerospace industry
during the Apollo missions
In 1974, the Navy developed MIL-STD-1629
regarding the use of FMEA
In the late 1970’s, the automotive industry was
driven by liability costs to use FMEA
Later, the automotive industry saw the advantages
of using this tool to reduce risks related to poor
quality
41
Examples
The FMEA Form
42
Identify failure modes
and their effects
Identify causes of the
failure modes
and controls
Prioritize Determine and
assess actions
A Closer Look
Types of FMEAs
Design
◦ Analyzes product design before release to production, with a focus on
product function
◦ Analyzes systems and subsystems in early concept and design stages
Process
◦ Used to analyze manufacturing and assembly processes after they are
implemented
43
Specialized
Uses
FMEA: A Team Tool
A team approach is necessary.
Team should be led by the Process Owner who is the responsible
manufacturing engineer or technical person, or other similar individual
familiar with FMEA.
The following should be considered for team members:
– Design Engineers – Operators
– Process Engineers – Reliability
– Materials Suppliers – Suppliers
– Customers
44
Team Input
Required
FMEA Procedure
1. For each process input (start with high value inputs),
determine the ways in which the input can go wrong
(failure mode)
2. For each failure mode, determine effects
Select a severity level for each effect
3. Identify potential causes of each failure mode
Select an occurrence level for each cause
4. List current controls for each cause
Select a detection level for each cause
45
Process Steps
FMEA Procedure (Cont.)
5. Calculate the Risk Priority Number (RPN)
6. Develop recommended actions, assign responsible
persons, and take actions
◦Give priority to high RPNs
◦MUST look at severities rated a 10
7. Assign the predicted severity, occurrence, and detection
levels and compare RPNs
46
Process Steps
FMEA Inputs and Outputs
47
FMEA
C&E Matrix
Process Map
Process History
Procedures
Knowledge
Experience
List of actions to prevent
causes or detect failure
modes
History of actions taken
Inputs Outputs
Information
Flow
Severity, Occurrence,
and Detection
Severity
◦ Importance of the effect on customer requirements
Occurrence
◦ Frequency with which a given cause occurs and
creates failure modes (obtain from past data if possible)
Detection
◦ The ability of the current control scheme to detect
(then prevent) a given cause (may be difficult to estimate early in process
operations).
48
Analyzing
Failure &
Effects
Rating Scales
There are a wide variety of scoring “anchors”,
both quantitative or qualitative
Two types of scales are 1-5 or 1-10
The 1-5 scale makes it easier for the teams to
decide on scores
The 1-10 scale may allow for better precision in
estimates and a wide variation in scores (most
common)
49
Assigning
Rating
Weights
Rating Scales
Severity
◦ 1 = Not Severe, 10 = Very Severe
Occurrence
◦ 1 = Not Likely, 10 = Very Likely
Detection
◦ 1 = Easy to Detect, 10 = Not easy to Detect
50
Assigning
Rating
Weights
Risk Priority Number
(RPN)
RPN is the product of the severity, occurrence, and detection
scores.
51
Severity Occurrence Detection RPNRPNX X =
Calculating a
Composite
Score

Total Quality Management tool

  • 1.
    1 Basic Seven Toolsof Quality Cause-and-Effect Diagrams Flowcharts Checklists Control Charts Scatter Diagrams Pareto Analysis Histograms
  • 2.
    Cause and EffectDiagram?  Ishakawa Diagram for the inventor, Dr. Kaoru Ishakawa.  It is also known as a Fishbone Diagram or Ishikawa Diagram or herringbone diagrams or Fishikawa.  The most useful tool for identifying the causes of problems.  Common uses of the Ishikawa diagram are productdesign and quality defect prevention to identify potential factors causing an overall effect.
  • 3.
    3 What is aCause and Effect Diagram? A visual tool to identify, explore and graphically display, in increasing detail, all of the suspected possible causes related to a problem or condition to discover its root causes. Not a quantitative tool Problem/ Desired Improvement Main Category Cause Root Cause
  • 4.
    4 Causes Effect Shows variousinfluences on a process to identify most likely root causes of problem Problem Main Category Cause Sub-Cause Root Cause Cause and Effect Diagram Fishbone
  • 5.
    5 Why Use Cause& Effect Diagrams? Focuses team on the content of the problem Creates a snapshot of the collective knowledge of team Creates consensus of the causes of a problem Builds support for resulting solutions Focuses the team on causes not symptoms To discover the most probable causes for further analysis To visualize possible relationships between causes for any problem current or future To pinpoint conditions causing customer complaints, process errors or non-conforming products To provide focus for discussion
  • 6.
    6 MethodsMaterials Machinery Manpower Maintenance Problem/ Brainstorm todetermine root causes and add those as small branches off major bones Constructing Cause & Effect Diagrams
  • 7.
    7 Construction constructed two ways: 1.Paperand pen Usually more effective when working in a team May take multiple sheets of flip chart paper Many teams find it helpful to do the flip chart method first because it lends itself to group dynamics. Everyone can see and participate easier. 1. Minitab software Very helpful when sharing diagram with an audience outside of your team
  • 8.
    8 Example: Delayed FlightDepartures Equipment Personnel Procedure Material Other Aircraft late to gate Late arrival Gate occupied Mechanical failures late pushback tug Weather Air traffic Late food service Late fuel Late baggage to aircraft Gate agents cannot process passengers quickly enough Too few agents Agents undertrained Agents undermotivated Agents arrive at gate late Late cabin cleaners late or unavailable cockpit crews Late or unavailable cabin crews poor announcement of departures weight an balance sheet late Delayed checkin procedure Confused seat selection Passengers bypass checkin counter Checking oversize baggage Issuance of boarding pass Acceptance of late passengers cutoff too close to departure time Desire to protect late passengers Desire to help company’s income Poor gate locations Delayed Flight Departures
  • 9.
    9 Flowcharts This is apicture of a process that shows the sequence of steps performed. It is also called a process map. Used to document the detailed steps in a process Often the first step in Process Re-Engineering
  • 10.
    10 Example: Process atDeparture Gate
  • 11.
     Scatter diagramsillustrate relationships between variables. Typically the variables represent possible causes and effects obtained from cause-and- effect diagrams.
  • 12.
  • 13.
    13 Checklist Simple data check-offsheet designed to identify type of quality problems at each work station; per shift, per machine, per operator
  • 14.
    14 Control Charts Important toolused in Statistical Process Control – Chapter 6 The UCL and LCL are calculated limits used to show when process is in or out of control
  • 15.
    Control Chart Control chartsare considered as the backbone of statistical process control and were first proposed by Walter Shewhart.
  • 16.
    16 Scatter Diagrams A graphthat shows how two variables are related to one another Data can be used in a regression analysis to establish equation for the relationship
  • 17.
    Pareto Diagrams Pareto analysisis a technique for prioritizing types or sources of problems. It separates the “vital few” from the “trivial many” and provides help in selecting directions for improvement.
  • 18.
    18 Pareto Analysis Technique thatdisplays the degree of importance for each element Named after the 19th century Italian economist Often called the 80-20 Rule Principle is that quality problems are the result of only a few problems e.g. 80% of the problems caused by 20% of causes
  • 19.
    Example of aPareto Diagram
  • 20.
    Histograms This is agraphical representation of the variation in a set of data. It shows the frequency or number of observations of a particular value or within a specified group. It provides clues about the characteristics of the population from which a sample is taken.
  • 21.
    21 Histograms A chart thatshows the frequency distribution of observed values of a variable like service time at a bank drive-up window Displays whether the distribution is symmetrical (normal) or skewed
  • 22.
    What is BenchmarkingWhatis Benchmarking A method for identifying and importing bestA method for identifying and importing best practices in order to improve performancepractices in order to improve performance The process of learning, adapting, andThe process of learning, adapting, and measuring outstanding practices and processesmeasuring outstanding practices and processes from any organization to improve performancefrom any organization to improve performance
  • 23.
    Why BenchmarkWhy Benchmark Identifyopportunities to improveIdentify opportunities to improve performanceperformance Learn from others’ experiencesLearn from others’ experiences Set realistic but ambitious targetsSet realistic but ambitious targets Uncover strengths in one’s own organizationUncover strengths in one’s own organization Better prioritize and allocate resourcesBetter prioritize and allocate resources
  • 24.
    Citizens demand effectiveand responsiveCitizens demand effective and responsive governmentgovernment Voters resent waste of tax dollarsVoters resent waste of tax dollars People ask for greater accountability ofPeople ask for greater accountability of governmentgovernment Weak economy forces government to provideWeak economy forces government to provide more services with less resourcemore services with less resource Public SectorPublic Sector BenchmarkingBenchmarking
  • 25.
    Types of Benchmarking:1Types of Benchmarking: 1 Strategic BenchmarkingStrategic Benchmarking How public, private, and nonprofitHow public, private, and nonprofit organizations compare with each other. Itorganizations compare with each other. It moves across industries and cities to determinemoves across industries and cities to determine what are the best strategic outcomes.what are the best strategic outcomes.
  • 26.
    Types of Benchmarking:2Types of Benchmarking: 2 Performance BenchmarkingPerformance Benchmarking How public, private, and nonprofitHow public, private, and nonprofit organizations compare themselves with eachorganizations compare themselves with each other in terms of product and service. Itother in terms of product and service. It focuses on elements of cost, technical quality,focuses on elements of cost, technical quality, service features, speed, reliability, and otherservice features, speed, reliability, and other performance comparisons.performance comparisons.
  • 27.
    Types of Benchmarking:3Types of Benchmarking: 3 Process BenchmarkingProcess Benchmarking How public, private, and nonprofitHow public, private, and nonprofit organizations compare through theorganizations compare through the identification of the most effective operatingidentification of the most effective operating practices from many organizations that performpractices from many organizations that perform similar work processes.similar work processes.
  • 28.
    When not toBenchmarkWhen not to Benchmark Target is not critical to the core businessTarget is not critical to the core business functionsfunctions Customer’s requirement is not clearCustomer’s requirement is not clear Key stakeholders are not involvedKey stakeholders are not involved Inadequate resources to carry throughInadequate resources to carry through No plan for implementing findingsNo plan for implementing findings Fear of sharing information with otherFear of sharing information with other organizationsorganizations
  • 29.
  • 30.
    1. Planning1. Planning Determinethe purpose and scope of theDetermine the purpose and scope of the projectproject Select the process to be benchmarkedSelect the process to be benchmarked Choose the teamChoose the team Define the scopeDefine the scope Develop a flow chart for the processDevelop a flow chart for the process Establish process measuresEstablish process measures Identify benchmarking partnersIdentify benchmarking partners
  • 31.
    2. Collecting Data2.Collecting Data Conduct background research to gainConduct background research to gain thorough understanding on the process andthorough understanding on the process and partnering organizationspartnering organizations Use questionnaires to gather informationUse questionnaires to gather information necessary for benchmarkingnecessary for benchmarking Conduct site visits if additional information isConduct site visits if additional information is neededneeded Conduct interviews if more detail informationConduct interviews if more detail information is neededis needed
  • 32.
    3. Analysis3. Analysis Analyzequantitative data of partneringAnalyze quantitative data of partnering organizations and your organizationorganizations and your organization Analyze qualitative data of partneringAnalyze qualitative data of partnering organizations and your organizationorganizations and your organization Determine the performance gapDetermine the performance gap
  • 33.
    4. Improving Practices4.Improving Practices Report findings and brief managementReport findings and brief management Develop an improvement implementationDevelop an improvement implementation planplan Implement process improvementsImplement process improvements Monitor performance measurements andMonitor performance measurements and track progresstrack progress Recalibrate the process as neededRecalibrate the process as needed
  • 34.
    Failure Modes EffectAnalysis (FMEA)
  • 35.
    Benefits Allows us toidentify areas of our process that most impact our customers Helps us identify how our process is most likely to fail Points to process failures that are most difficult to detect 35
  • 36.
    Application Examples Manufacturing: Amanager is responsible for moving a manufacturing operation to a new facility. He/she wants to be sure the move goes as smoothly as possible and that there are no surprises. Design: A design engineer wants to think of all the possible ways a product being designed could fail so that robustness can be built into the product. Software: A software engineer wants to think of possible problems a software product could fail when scaled up to large databases. This is a core issue for the Internet. 36
  • 37.
    What Is AFailure Mode? A Failure Mode is: ◦ The way in which the component, subassembly, product, input, or process could fail to perform its intended function ◦Failure modes may be the result of upstream operations or may cause downstream operations to fail ◦ Things that could go wrong 37 What Can Go Wrong?
  • 38.
    FMEAWhy ◦ Methodology thatfacilitates process improvement ◦ Identifies and eliminates concerns early in the development of a process or design ◦ Improve internal and external customer satisfaction ◦ Focuses on prevention ◦ FMEA may be a customer requirement (likely contractual) ◦ FMEA may be required by an applicable Quality Management System Standard (possibly ISO) 38
  • 39.
    FMEA A structured approachto: ◦ Identifying the ways in which a product or process can fail ◦ Estimating risk associated with specific causes ◦ Prioritizing the actions that should be taken to reduce risk ◦ Evaluating design validation plan (design FMEA) or current control plan (process FMEA) 39
  • 40.
    When to Conductan FMEA Early in the process improvement investigation When new systems, products, and processes are being designed When existing designs or processes are being changed When carry-over designs are used in new applications After system, product, or process functions are defined, but before specific hardware is selected or released to manufacturing 40
  • 41.
    History of FMEA Firstused in the 1960’s in the Aerospace industry during the Apollo missions In 1974, the Navy developed MIL-STD-1629 regarding the use of FMEA In the late 1970’s, the automotive industry was driven by liability costs to use FMEA Later, the automotive industry saw the advantages of using this tool to reduce risks related to poor quality 41 Examples
  • 42.
    The FMEA Form 42 Identifyfailure modes and their effects Identify causes of the failure modes and controls Prioritize Determine and assess actions A Closer Look
  • 43.
    Types of FMEAs Design ◦Analyzes product design before release to production, with a focus on product function ◦ Analyzes systems and subsystems in early concept and design stages Process ◦ Used to analyze manufacturing and assembly processes after they are implemented 43 Specialized Uses
  • 44.
    FMEA: A TeamTool A team approach is necessary. Team should be led by the Process Owner who is the responsible manufacturing engineer or technical person, or other similar individual familiar with FMEA. The following should be considered for team members: – Design Engineers – Operators – Process Engineers – Reliability – Materials Suppliers – Suppliers – Customers 44 Team Input Required
  • 45.
    FMEA Procedure 1. Foreach process input (start with high value inputs), determine the ways in which the input can go wrong (failure mode) 2. For each failure mode, determine effects Select a severity level for each effect 3. Identify potential causes of each failure mode Select an occurrence level for each cause 4. List current controls for each cause Select a detection level for each cause 45 Process Steps
  • 46.
    FMEA Procedure (Cont.) 5.Calculate the Risk Priority Number (RPN) 6. Develop recommended actions, assign responsible persons, and take actions ◦Give priority to high RPNs ◦MUST look at severities rated a 10 7. Assign the predicted severity, occurrence, and detection levels and compare RPNs 46 Process Steps
  • 47.
    FMEA Inputs andOutputs 47 FMEA C&E Matrix Process Map Process History Procedures Knowledge Experience List of actions to prevent causes or detect failure modes History of actions taken Inputs Outputs Information Flow
  • 48.
    Severity, Occurrence, and Detection Severity ◦Importance of the effect on customer requirements Occurrence ◦ Frequency with which a given cause occurs and creates failure modes (obtain from past data if possible) Detection ◦ The ability of the current control scheme to detect (then prevent) a given cause (may be difficult to estimate early in process operations). 48 Analyzing Failure & Effects
  • 49.
    Rating Scales There area wide variety of scoring “anchors”, both quantitative or qualitative Two types of scales are 1-5 or 1-10 The 1-5 scale makes it easier for the teams to decide on scores The 1-10 scale may allow for better precision in estimates and a wide variation in scores (most common) 49 Assigning Rating Weights
  • 50.
    Rating Scales Severity ◦ 1= Not Severe, 10 = Very Severe Occurrence ◦ 1 = Not Likely, 10 = Very Likely Detection ◦ 1 = Easy to Detect, 10 = Not easy to Detect 50 Assigning Rating Weights
  • 51.
    Risk Priority Number (RPN) RPNis the product of the severity, occurrence, and detection scores. 51 Severity Occurrence Detection RPNRPNX X = Calculating a Composite Score