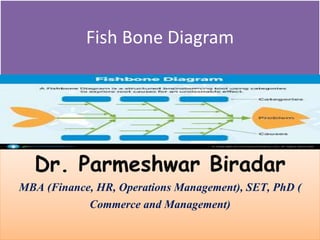
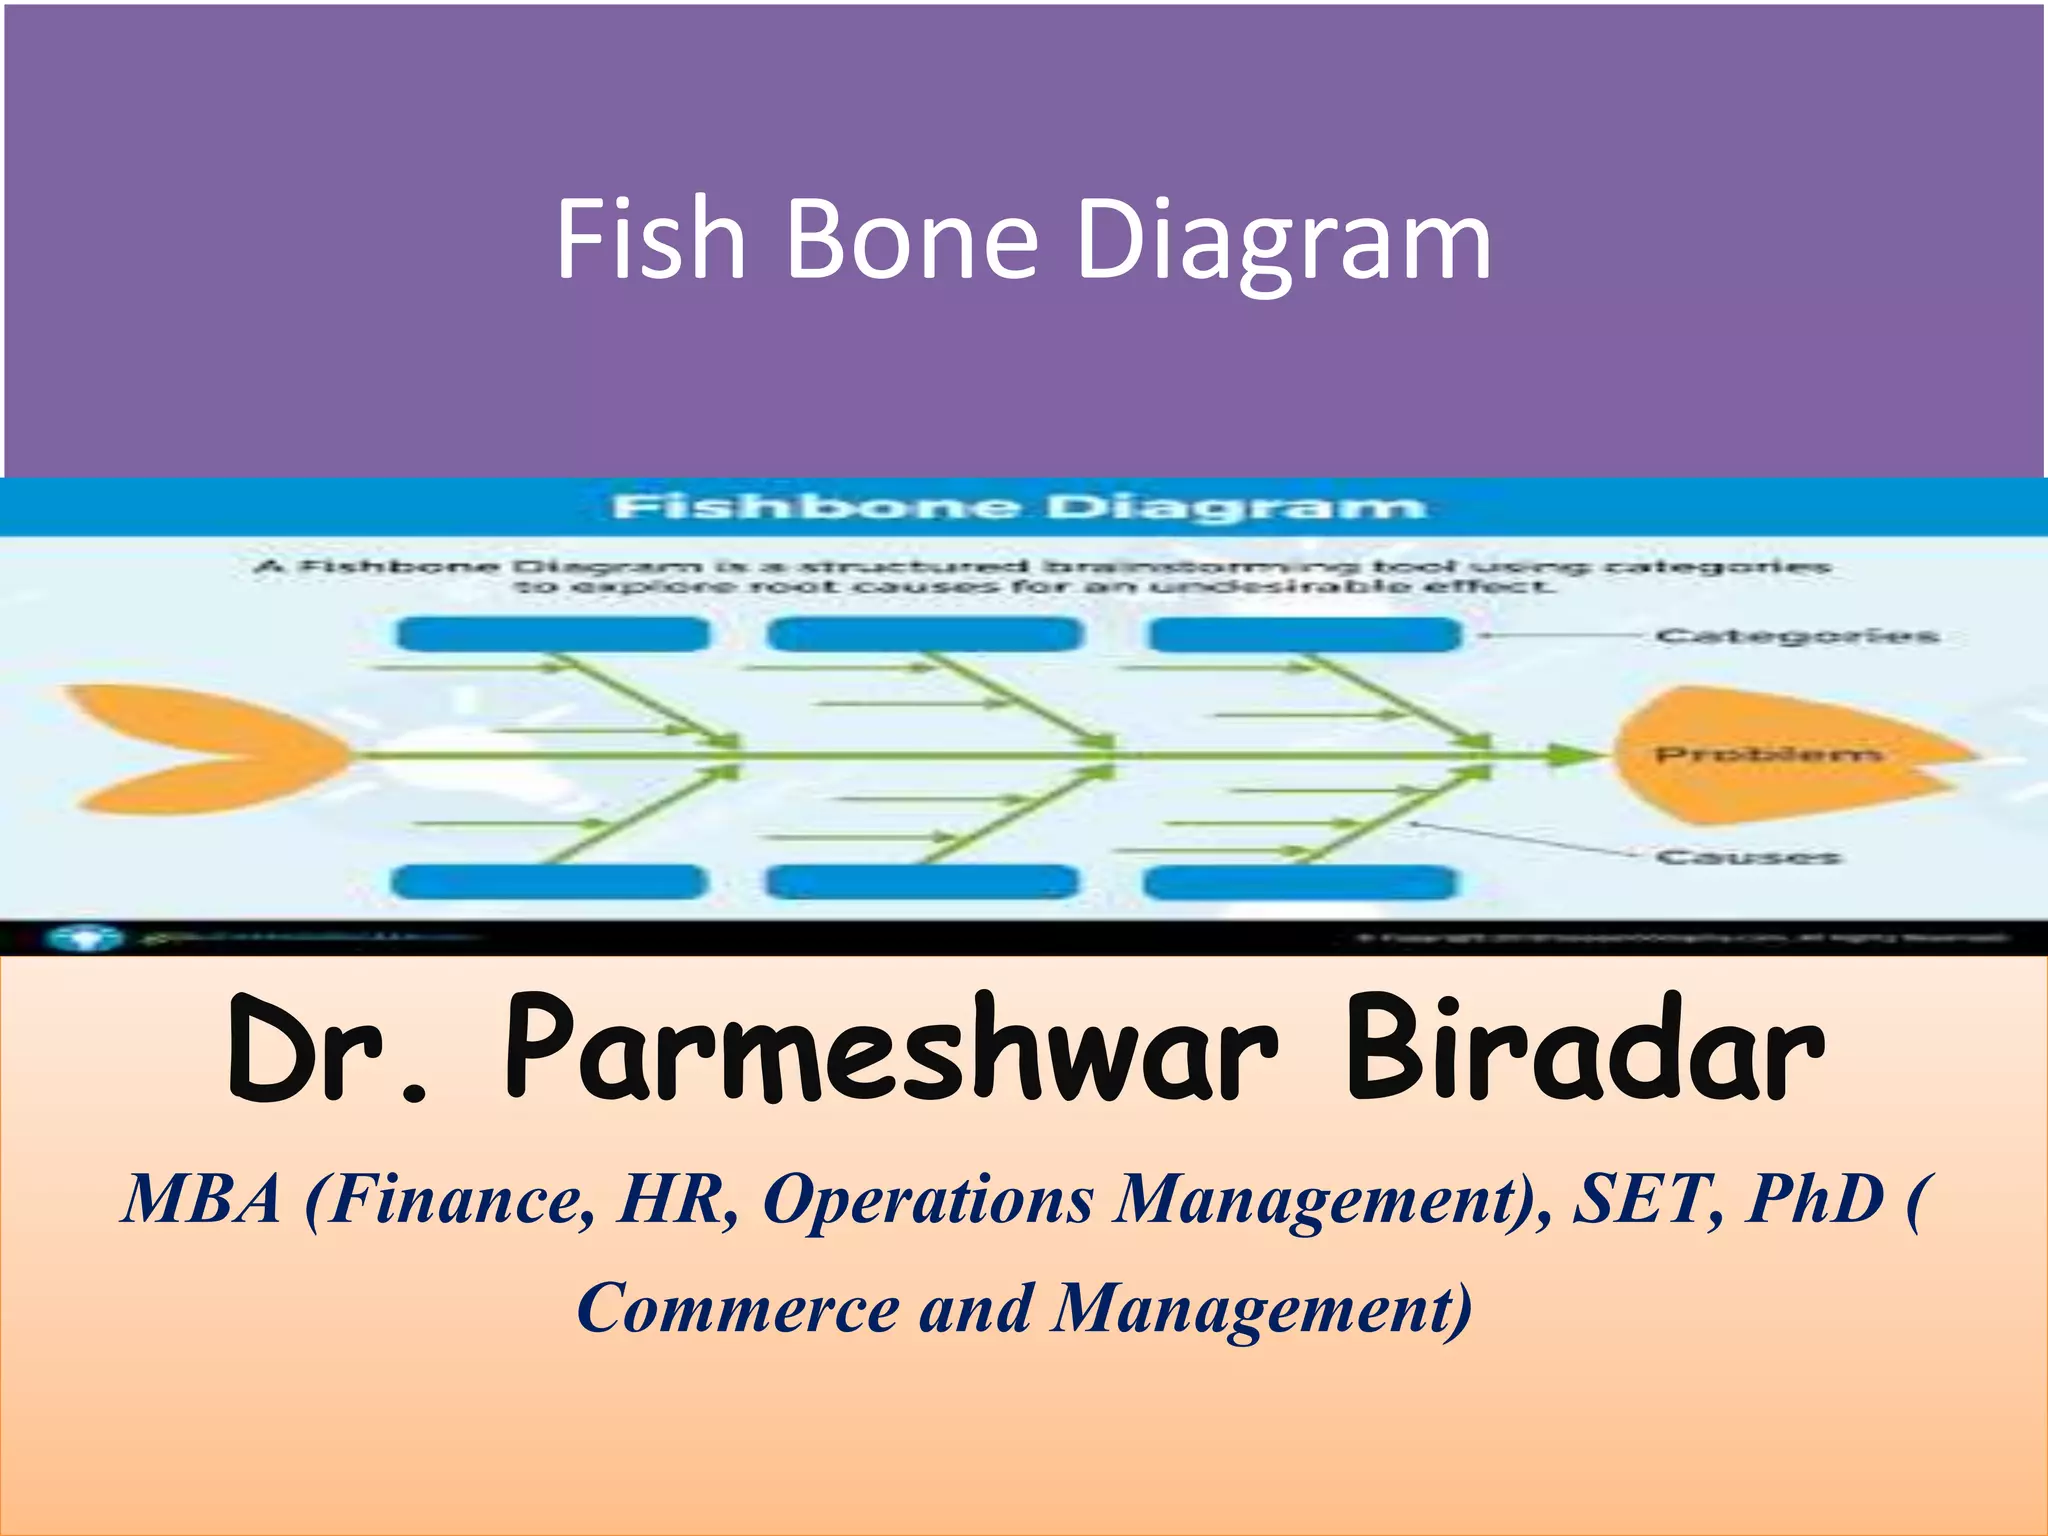
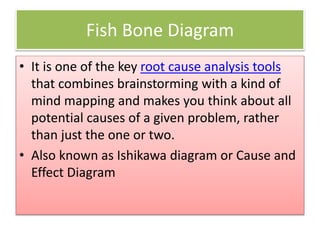
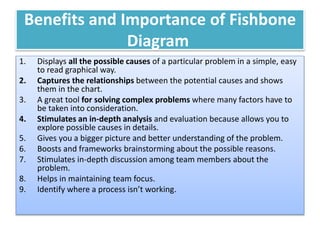
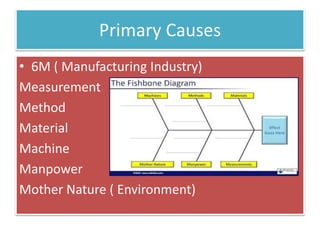
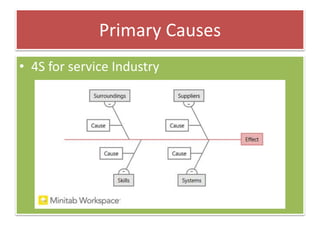
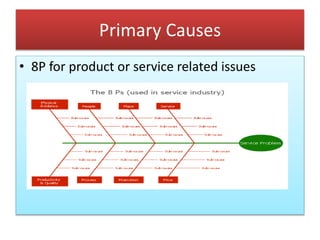
The fishbone diagram is a tool for root cause analysis that combines brainstorming and mind mapping. It displays the potential causes of a problem in graphical form and helps categorize causes. The benefits include providing an easy to understand visual of relationships between causes, stimulating in-depth discussion to explore all possible causes, and helping identify where processes are not working. Potential causes are typically grouped into primary categories like 6M's for manufacturing or 8P's for products.


![7 qc tools training material[1]](https://cdn.slidesharecdn.com/ss_thumbnails/7qctoolstrainingmaterial1-120925054558-phpapp02-thumbnail.jpg?width=640&height=640&fit=bounds)


![Fishbone[1]](https://cdn.slidesharecdn.com/ss_thumbnails/fishbone12615-thumbnail.jpg?width=640&height=640&fit=bounds)
![Fishbone[1]](https://cdn.slidesharecdn.com/ss_thumbnails/fishbone1368-thumbnail.jpg?width=640&height=640&fit=bounds)


