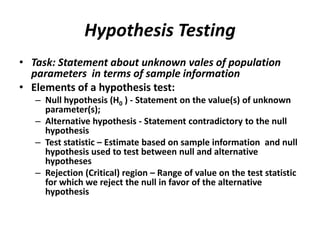
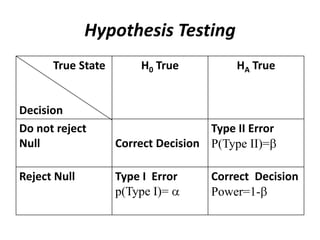
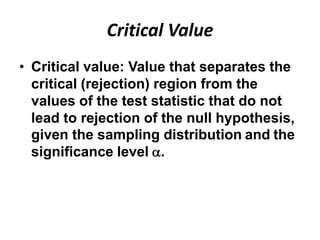
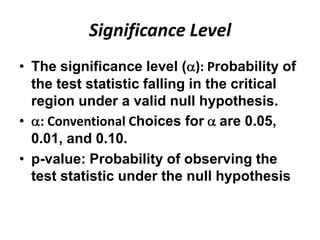
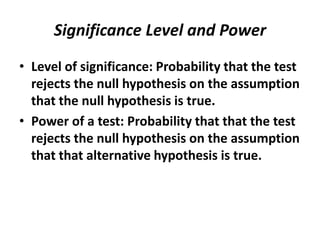
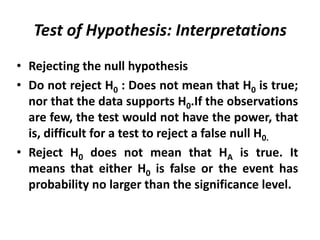
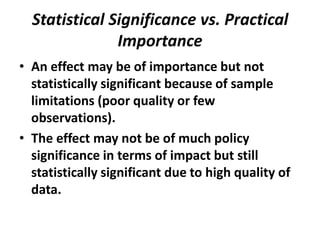
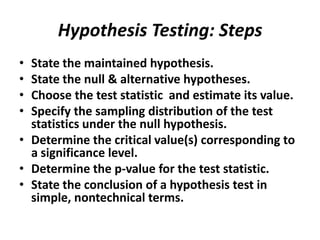
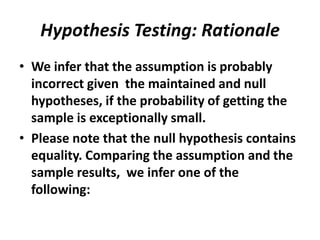
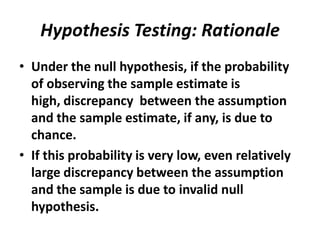
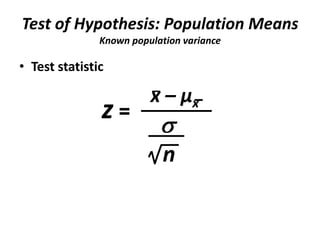
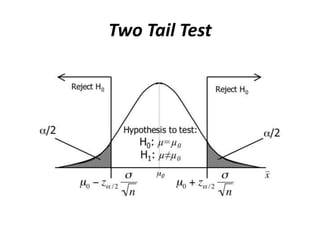
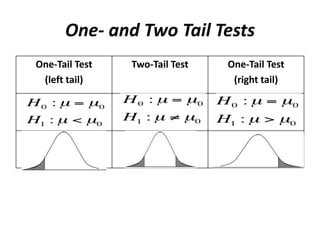
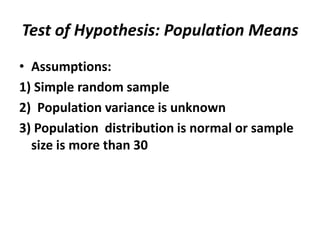
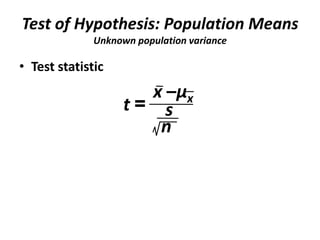
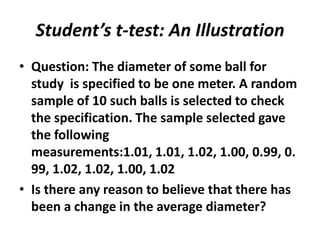
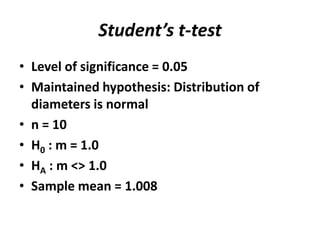
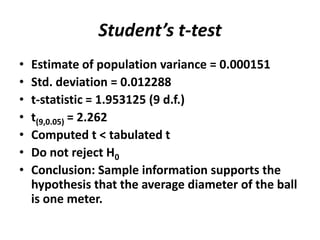
Statistical Inference
Hypothesis Testing
•   What is a statistical hypothesis?
•   What is so important about it?
•   What is a rejection region?
•   What does it mean to say that a finding is
    statistically significant?
•   Describe Type I and Type II errors.
Hypothesis Testing
• Task: Statement about unknown vales of population
  parameters in terms of sample information
• Elements of a hypothesis test:
   – Null hypothesis (H0 ) - Statement on the value(s) of unknown
     parameter(s);
   – Alternative hypothesis - Statement contradictory to the null
     hypothesis
   – Test statistic – Estimate based on sample information and null
     hypothesis used to test between null and alternative
     hypotheses
   – Rejection (Critical) region – Range of value on the test statistic
     for which we reject the null in favor of the alternative
     hypothesis
Hypothesis Testing
      True State        H0 True          HA True


Decision
Do not reject                       Type II Error
Null               Correct Decision P(Type II)=

Reject Null        Type I Error      Correct Decision
                   p(Type I)=        Power=1-
Critical Value
• Critical value: Value that separates the
  critical (rejection) region from the
  values of the test statistic that do not
  lead to rejection of the null hypothesis,
  given the sampling distribution and the
  significance level .
Significance Level
• The significance level ( ): Probability of
  the test statistic falling in the critical
  region under a valid null hypothesis.
• : Conventional Choices for are 0.05,
  0.01, and 0.10.
• p-value: Probability of observing the
  test statistic under the null hypothesis
Significance Level and Power
• Level of significance: Probability that the test
  rejects the null hypothesis on the assumption
  that the null hypothesis is true.
• Power of a test: Probability that that the test
  rejects the null hypothesis on the assumption
  that that alternative hypothesis is true.
Test of Hypothesis: Interpretations
• Rejecting the null hypothesis
• Do not reject H0 : Does not mean that H0 is true;
  nor that the data supports H0.If the observations
  are few, the test would not have the power, that
  is, difficult for a test to reject a false null H0.
• Reject H0 does not mean that HA is true. It
  means that either H0 is false or the event has
  probability no larger than the significance level.
Statistical Significance vs. Practical
               Importance
• An effect may be of importance but not
  statistically significant because of sample
  limitations (poor quality or few
  observations).
• The effect may not be of much policy
  significance in terms of impact but still
  statistically significant due to high quality of
  data.
Hypothesis Testing: Steps
• State the maintained hypothesis.
• State the null & alternative hypotheses.
• Choose the test statistic and estimate its value.
• Specify the sampling distribution of the test
  statistics under the null hypothesis.
• Determine the critical value(s) corresponding to
  a significance level.
• Determine the p-value for the test statistic.
• State the conclusion of a hypothesis test in
  simple, nontechnical terms.
Hypothesis Testing: Rationale
• We infer that the assumption is probably
  incorrect given the maintained and null
  hypotheses, if the probability of getting the
  sample is exceptionally small.
• Please note that the null hypothesis contains
  equality. Comparing the assumption and the
  sample results, we infer one of the
  following:
Hypothesis Testing: Rationale
• Under the null hypothesis, if the probability
  of observing the sample estimate is
  high, discrepancy between the assumption
  and the sample estimate, if any, is due to
  chance.
• If this probability is very low, even relatively
  large discrepancy between the assumption
  and the sample is due to invalid null
  hypothesis.
Test of Hypothesis: Population Means
• Assumptions:
1) Simple random sample
2) Population variance is known
3) Population distribution is normal or sample
  size is more than 30
Test of Hypothesis: Population Means
               Known population variance

• Test statistic

                         x – µx
               z=
                            n
Two Tail Test
One- and Two Tail Tests
One-Tail Test   Two-Tail Test   One-Tail Test
 (left tail)                     (right tail)
Test of Hypothesis: Population Means
• Assumptions:
1) Simple random sample
2) Population variance is unknown
3) Population distribution is normal or sample
  size is more than 30
Test of Hypothesis: Population Means
              Unknown population variance

• Test statistic
                      x –µx
                    t= s
                       n
Student’s t-test: An Illustration
• Question: The diameter of some ball for
  study is specified to be one meter. A random
  sample of 10 such balls is selected to check
  the specification. The sample selected gave
  the following
  measurements:1.01, 1.01, 1.02, 1.00, 0.99, 0.
  99, 1.02, 1.02, 1.00, 1.02
• Is there any reason to believe that there has
  been a change in the average diameter?
Student’s t-test
• Level of significance = 0.05
• Maintained hypothesis: Distribution of
  diameters is normal
• n = 10
• H0 : m = 1.0
• HA : m <> 1.0
• Sample mean = 1.008
Student’s t-test
•   Estimate of population variance = 0.000151
•   Std. deviation = 0.012288
•   t-statistic = 1.953125 (9 d.f.)
•   t(9,0.05) = 2.262
•   Computed t < tabulated t
•   Do not reject H0
•   Conclusion: Sample information supports the
    hypothesis that the average diameter of the ball
    is one meter.
What would be the sampling
distribution of a sample mean from
a normally distributed population?
      Sample mean from a normal
    population will also be normally
    distributed for any sample size n
Central Limit Theorem
• The sampling distribution of mean of n
  sample observations from any population
  would be approximately normal when n is
  sufficiently large.

Topic 7 stat inference

  • 1.
  • 2.
    Hypothesis Testing • What is a statistical hypothesis? • What is so important about it? • What is a rejection region? • What does it mean to say that a finding is statistically significant? • Describe Type I and Type II errors.
  • 3.
    Hypothesis Testing • Task:Statement about unknown vales of population parameters in terms of sample information • Elements of a hypothesis test: – Null hypothesis (H0 ) - Statement on the value(s) of unknown parameter(s); – Alternative hypothesis - Statement contradictory to the null hypothesis – Test statistic – Estimate based on sample information and null hypothesis used to test between null and alternative hypotheses – Rejection (Critical) region – Range of value on the test statistic for which we reject the null in favor of the alternative hypothesis
  • 4.
    Hypothesis Testing True State H0 True HA True Decision Do not reject Type II Error Null Correct Decision P(Type II)= Reject Null Type I Error Correct Decision p(Type I)= Power=1-
  • 5.
    Critical Value • Criticalvalue: Value that separates the critical (rejection) region from the values of the test statistic that do not lead to rejection of the null hypothesis, given the sampling distribution and the significance level .
  • 6.
    Significance Level • Thesignificance level ( ): Probability of the test statistic falling in the critical region under a valid null hypothesis. • : Conventional Choices for are 0.05, 0.01, and 0.10. • p-value: Probability of observing the test statistic under the null hypothesis
  • 7.
    Significance Level andPower • Level of significance: Probability that the test rejects the null hypothesis on the assumption that the null hypothesis is true. • Power of a test: Probability that that the test rejects the null hypothesis on the assumption that that alternative hypothesis is true.
  • 8.
    Test of Hypothesis:Interpretations • Rejecting the null hypothesis • Do not reject H0 : Does not mean that H0 is true; nor that the data supports H0.If the observations are few, the test would not have the power, that is, difficult for a test to reject a false null H0. • Reject H0 does not mean that HA is true. It means that either H0 is false or the event has probability no larger than the significance level.
  • 9.
    Statistical Significance vs.Practical Importance • An effect may be of importance but not statistically significant because of sample limitations (poor quality or few observations). • The effect may not be of much policy significance in terms of impact but still statistically significant due to high quality of data.
  • 10.
    Hypothesis Testing: Steps •State the maintained hypothesis. • State the null & alternative hypotheses. • Choose the test statistic and estimate its value. • Specify the sampling distribution of the test statistics under the null hypothesis. • Determine the critical value(s) corresponding to a significance level. • Determine the p-value for the test statistic. • State the conclusion of a hypothesis test in simple, nontechnical terms.
  • 11.
    Hypothesis Testing: Rationale •We infer that the assumption is probably incorrect given the maintained and null hypotheses, if the probability of getting the sample is exceptionally small. • Please note that the null hypothesis contains equality. Comparing the assumption and the sample results, we infer one of the following:
  • 12.
    Hypothesis Testing: Rationale •Under the null hypothesis, if the probability of observing the sample estimate is high, discrepancy between the assumption and the sample estimate, if any, is due to chance. • If this probability is very low, even relatively large discrepancy between the assumption and the sample is due to invalid null hypothesis.
  • 13.
    Test of Hypothesis:Population Means • Assumptions: 1) Simple random sample 2) Population variance is known 3) Population distribution is normal or sample size is more than 30
  • 14.
    Test of Hypothesis:Population Means Known population variance • Test statistic x – µx z= n
  • 15.
  • 16.
    One- and TwoTail Tests One-Tail Test Two-Tail Test One-Tail Test (left tail) (right tail)
  • 17.
    Test of Hypothesis:Population Means • Assumptions: 1) Simple random sample 2) Population variance is unknown 3) Population distribution is normal or sample size is more than 30
  • 18.
    Test of Hypothesis:Population Means Unknown population variance • Test statistic x –µx t= s n
  • 19.
    Student’s t-test: AnIllustration • Question: The diameter of some ball for study is specified to be one meter. A random sample of 10 such balls is selected to check the specification. The sample selected gave the following measurements:1.01, 1.01, 1.02, 1.00, 0.99, 0. 99, 1.02, 1.02, 1.00, 1.02 • Is there any reason to believe that there has been a change in the average diameter?
  • 20.
    Student’s t-test • Levelof significance = 0.05 • Maintained hypothesis: Distribution of diameters is normal • n = 10 • H0 : m = 1.0 • HA : m <> 1.0 • Sample mean = 1.008
  • 21.
    Student’s t-test • Estimate of population variance = 0.000151 • Std. deviation = 0.012288 • t-statistic = 1.953125 (9 d.f.) • t(9,0.05) = 2.262 • Computed t < tabulated t • Do not reject H0 • Conclusion: Sample information supports the hypothesis that the average diameter of the ball is one meter.
  • 22.
    What would bethe sampling distribution of a sample mean from a normally distributed population? Sample mean from a normal population will also be normally distributed for any sample size n
  • 23.
    Central Limit Theorem •The sampling distribution of mean of n sample observations from any population would be approximately normal when n is sufficiently large.