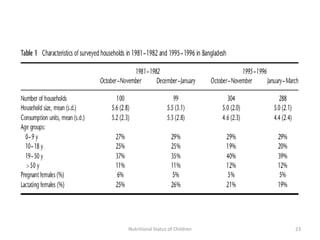
Malnutrition in children can be measured in several ways:
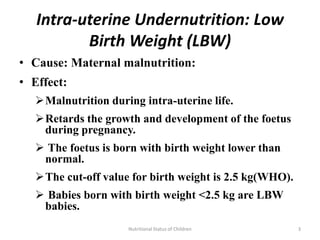
1) Low birth weight indicates intra-uterine undernutrition from maternal malnutrition.
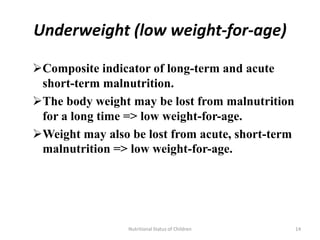
2) Childhood malnutrition has severe consequences if it occurs early in life, negatively impacting growth, health, development and productivity.
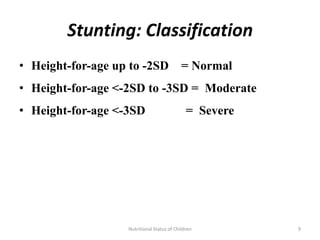
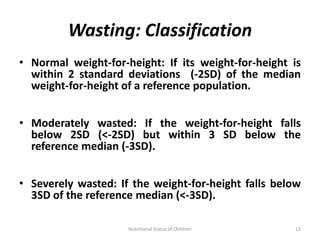
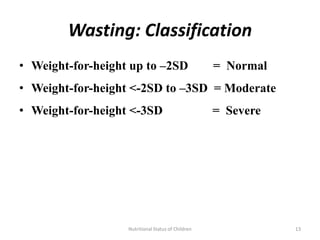
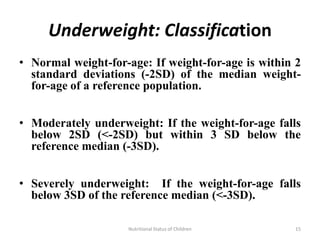
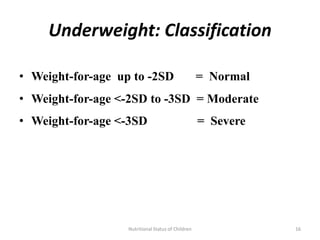
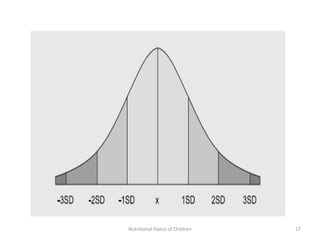
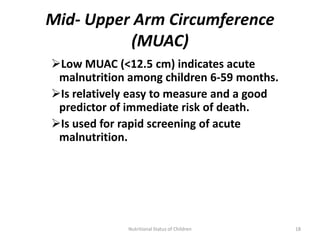
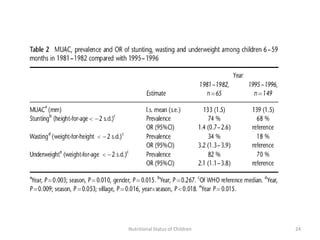
3) Common anthropometric indicators used to measure nutritional status in children under 5 include height-for-age, weight-for-age, weight-for-height, and mid-upper arm circumference. Stunting, wasting and underweight are classifications based on these measures.


![ONFH[AVN HIP] -TRIPLE REGIME -A NOVAL SURGICAL CONCEPT .pptx](https://cdn.slidesharecdn.com/ss_thumbnails/onfhavnhip2026koaconcalicutdrgokuldevdrmashraf-260210064517-213ec005-thumbnail.jpg?width=640&height=640&fit=bounds)


