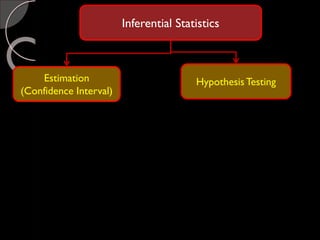
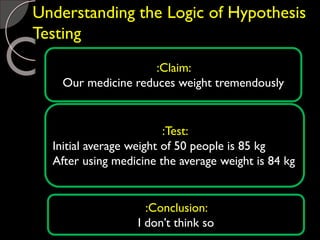
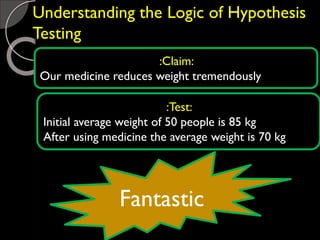
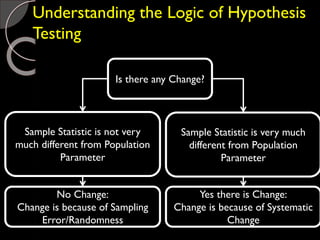
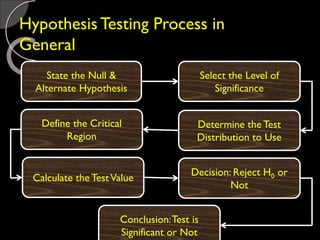
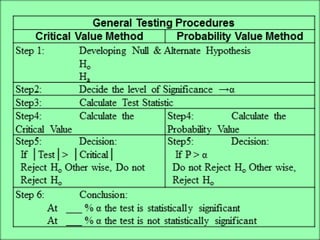
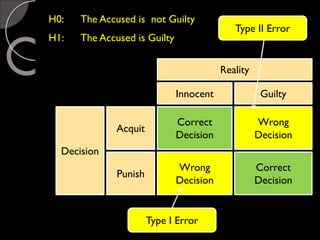
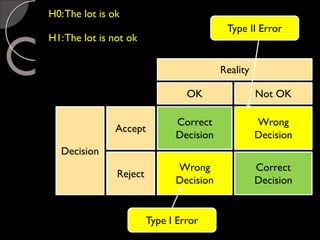
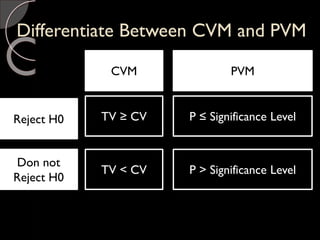
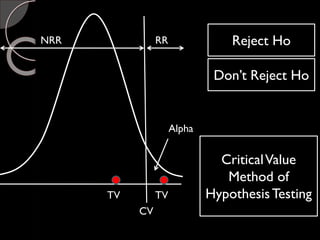
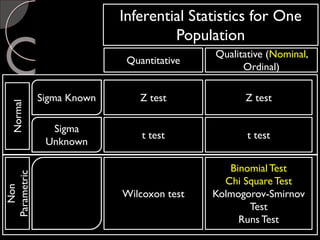
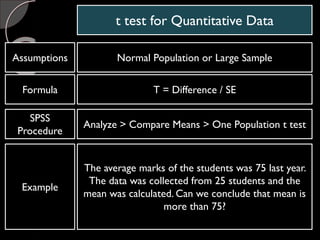
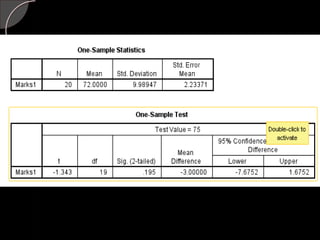
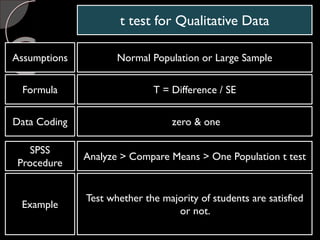
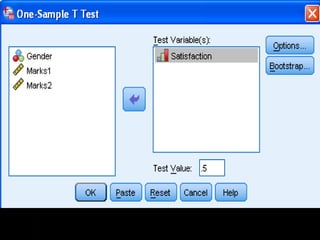
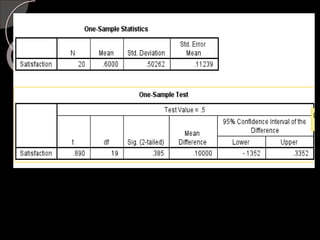
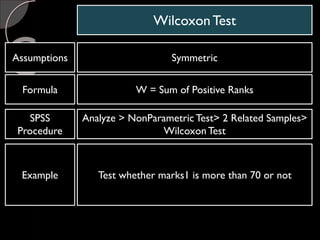
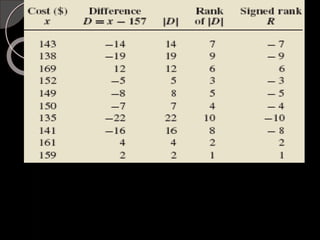
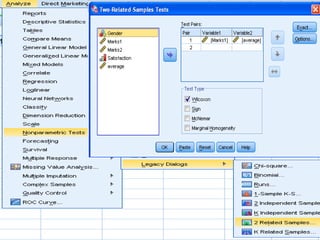
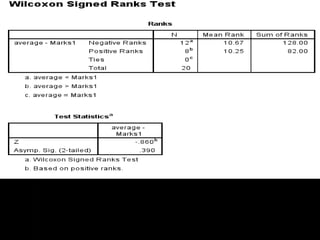
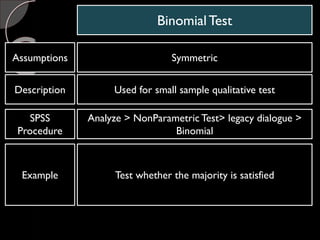
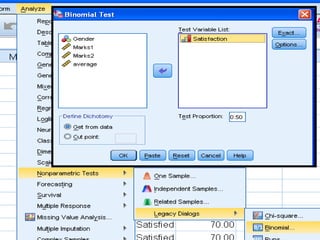
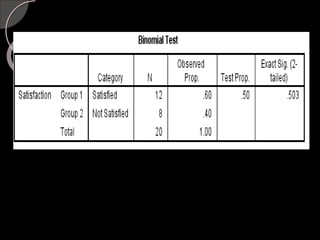
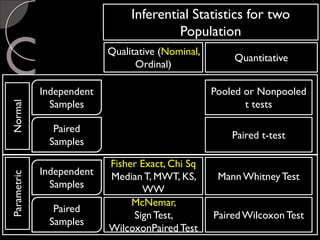
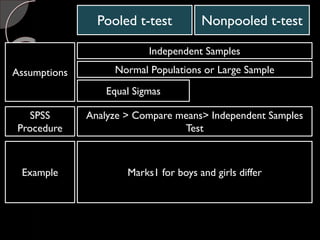
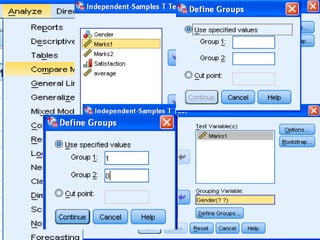
Inferential Statistics
HypothesisTestingEstimation
(Confidence Interval)
Understanding the Logic of Hypothesis
Testing
:Claim:
Our medicine reduces weight tremendously
:Test:
Initial average weight of 50 people is 85 kg
After using medicine the average weight is 84 kg
:Conclusion:
I don’t think so
Understanding the Logic of Hypothesis
Testing
:Claim:
Our medicine reduces weight tremendously
:Test:
Initial average weight of 50 people is 85 kg
After using medicine the average weight is 70 kg
Fantastic
Understanding the Logic of Hypothesis
Testing
Is there any Change?
Sample Statistic is very much
different from Population
Parameter
Sample Statistic is not very
much different from Population
Parameter
No Change:
Change is because of Sampling
Error/Randomness
Yes there is Change:
Change is because of Systematic
Change
Hypothesis Testing Process in
General
State the Null &
Alternate Hypothesis
Select the Level of
Significance
Determine the Test
Distribution to Use
Define the Critical
Region
Calculate the TestValue
Decision: Reject H0 or
Not
Conclusion:Test is
Significant or Not
Reality
Innocent Guilty
Decision
Acquit
Punish
Correct
Decision
Wrong
Decision
Wrong
Decision
Correct
Decision
H1: The Accused is Guilty
Type I Error
Type II Error
H0: The Accused is not Guilty
H0:The Accused is innocent
Reality
OK Not OK
Decision
Accept
Reject
Correct
Decision
Wrong
Decision
Wrong
Decision
Correct
Decision
H0:The lot is ok
H1:The lot is not ok
Type I Error
Type II Error
Differentiate Between CVM and PVM
CVM PVM
Reject H0
Don not
Reject H0
TV ≥ CV
TV < CV
P ≤ Significance Level
P > Significance Level
CV
Alpha
NRR RR Reject Ho
Don’t Reject Ho
TV TV
CriticalValue
Method of
HypothesisTesting
Alpha
NRR RR
Reject Ho as P ≤Alpha
Don’t Reject Ho as
P > Alpha
TV ProbabilityValue
Method of
HypothesisTesting
P
P
TV
Inferential Statistics for One
Population
Quantitative
Qualitative (Nominal,
Ordinal)
Sigma Known
Sigma
Unknown
Normal
Non
Parametric
Z test
t test
Z test
t test
Wilcoxon test
Binomial Test
Chi SquareTest
Kolmogorov-Smirnov
Test
Runs Test
t test for Quantitative Data
Assumptions Normal Population or Large Sample
Formula T = Difference / SE
SPSS
Procedure
Analyze > Compare Means > One Population t test
Example
The average marks of the students was 75 last year.
The data was collected from 25 students and the
mean was calculated. Can we conclude that mean is
more than 75?
t test for Qualitative Data
Assumptions Normal Population or Large Sample
Formula T = Difference / SE
SPSS
Procedure
Analyze > Compare Means > One Population t test
Example
Test whether the majority of students are satisfied
or not.
Data Coding zero & one
WilcoxonTest
Assumptions Symmetric
Formula W = Sum of Positive Ranks
SPSS
Procedure
Analyze > NonParametric Test> 2 Related Samples>
WilcoxonTest
Example Test whether marks1 is more than 70 or not
BinomialTest
Assumptions Symmetric
Description Used for small sample qualitative test
SPSS
Procedure
Analyze > NonParametric Test> legacy dialogue >
Binomial
Example Test whether the majority is satisfied
Inferential Statistics for two
Population
Qualitative (Nominal,
Ordinal)
Quantitative
Independent
Samples
Paired
Samples
NormalParametric
Pooled or Nonpooled
t tests
Paired t-test
Mann WhitneyTestIndependent
Samples
Paired
Samples
Paired WilcoxonTest
Fisher Exact, Chi Sq
Median T, MWT, KS,
WW
McNemar,
SignTest,
WilcoxonPaired Test
Pooled t-test
Assumptions
Independent Samples
SPSS
Procedure
Analyze > Compare means> Independent Samples
Test
Example Marks1 for boys and girls differ
Nonpooled t-test
Normal Populations or Large Sample
Equal Sigmas
Paired t-test
Assumptions
Dependent Samples
SPSS
Procedure
Analyze > Compare means> Paired t-test
Example Marks1 is different from marks2
Normal Differences or Large Sample
Sigma not known
Same Results obtained
taking differences of
Marks1 and Marks2 and
then applying t-test for
1 sample
MannWhitneyTest
Assumptions
Independent Samples
SPSS
Procedure
Analyze > NonParametric Test> 2 independent
Samples
Example Marks1 is different from marks2
Same Shape Distribution
Variable inferential statistics

Variable inferential statistics