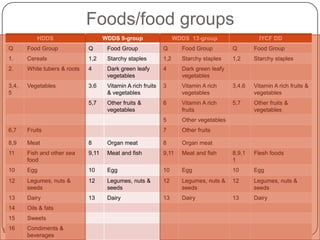
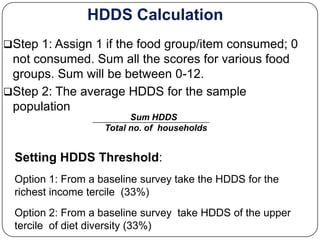
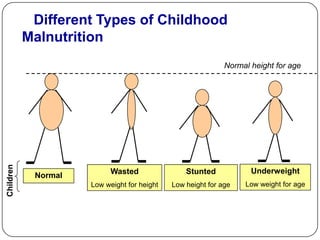
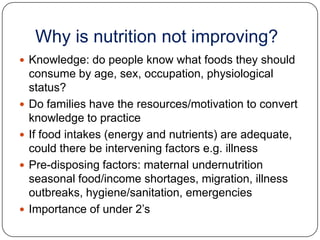
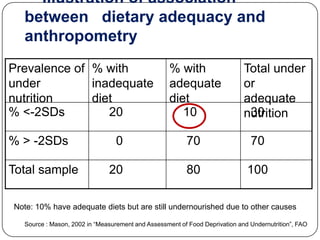
INTRODUCTION TO
 NUTRITION ANALYSIS :
 POLICY PARAMETERS
                  Lalita Bhattacharjee
                      Nutritionist
 Training Workshop on Analysis of Data for Measuring
Availability, Access and Nutritional Status Assessment
                  of Nutritional Status
                 14 -26 January 2012
DIETARY ASSESSMENT AND
NUTRITIONAL
      ASSESSMENT : KEY TERMS
 A DIETARY ASSESMENT : comprehensive evaluation of a person's
  food intake. It is one of the established methods of nutritional
  assessment. Dietary assessment techniques range from food records
  to questionnaires and biological markers.

 NUTRITIONAL ASSESSMENT : more comprehensive and includes
  determining nutritional status by analyzing the individual’s brief socio
  economic background, medical history, dietary, anthropometric,
  biochemical, clinical data and drug –nutrient interactions

 NUTRITIONAL STATUS : measurement of the extent to which an
  individual’s physiologic need for nutrients is being met

 NUTRIENT INTAKE : depends on actual food consumption which is
  influenced by factors such as economic situation, eating behaviour,
  emotional climate, cultural influences, effects of disease states on
  appetite and the ability to absorb nutrients

 NUTRIENT REQUIREMENTS : are determined and influenced by age,
  sex, BMR, physiological status, activity patterns, physiologic stressors
  (infection, disease) and psychological stress
OPTIMAL NUTRITIONAL
STATUS


                Source: Mahan and Stump, 2000
DIETARY ASSESSMENT
  PRINCIPLES
Adequacy : a diet that provides enough energy and nutrients to
            meet the needs according to the recommended dietary
            intakes/allowances (for healthy and active life)

Balance : a diet that provides enough, but not too much of each
type of food ( adequacy of basic food groups)

Variety : a diet that includes a wide selection of foods within each
food group (dietary diversity/ includes biodiversity – species, varieties, cultivars)

Nutrient Density : a diet that includes foods that provide the
  most nutrients for the least number of calories
  (nutrient dense foods)

Moderation : A diet that limits intake of foods high in sugar
              and fat (nutrient intake goals/guidelines)
WHAT IS DIETARY DIVERSITY
 Dietary diversity is
a qualitative
measure of food
consumption that
reflects household
access to a variety
of foods and is
also a proxy for
nutrient adequacy
of the diet of
individuals
HHDDS and IDDS

Measures no. of different food groups
 consumed over a given reference period
 i.e. 24 hours/1 day


HDD is also a proxy for HH socio
 economic status, whereas IDD is purely a
 proxy measure of an individual’s quality of
 diet.
WHEN TO MEASURE DIETARY
DIVERSITY
Objective                            Timing
Assessment of the typical diet of    When food supplies are still
HHs/individuals                      adequate (may be 4-5 mo after the
                                     main harvest)
Assessment of the FS situation in    During periods of greatest food
rural, agriculture based communities shortage, such as immediately prior
                                     to the harvest/immediately after
                                     emergencies or natural disasters
Assessment of FS situation in non-   At the moment of concern to identify
agricultural communities             a possible food security problem
Monitoring of FS/N programmes or     Repeated measures to assess
agricultural interventions such as   impact of the intervention on the
crop/livelihood diversification      quality of the diet, conducted at the
                                     same time of the year as te baseline
                                     (avoid interference due to seasonal
                                     factors)
Foods/food groups
             HDDS                      WDDS 9-group                   WDDS 13-group                  IYCF DD
  Q      Food Group             Q       Food Group              Q       Food Group         Q       Food Group
  1.     Cereals                1,2     Starchy staples         1,2     Starchy staples    1,2     Starchy staples
  2.     White tubers & roots   4       Dark green leafy        4       Dark green leafy
                                        vegetables                      vegetables
  3,4,   Vegetables             3,6     Vitamin A rich fruits   3       Vitamin A rich     3,4,6   Vitamin A rich fruits &
  5                                     & vegetables                    vegetables                 vegetables
                                5,7     Other fruits &          6       Vitamin A rich     5,7     Other fruits &
                                        vegetables                      fruits                     vegetables
                                                                5       Other vegetables
  6,7    Fruits                                                 7       Other fruits

  8,9    Meat                   8       Organ meat              8       Organ meat
  11     Fish and other sea     9,11    Meat and fish           9,11    Meat and fish      8,9,1   Flesh foods
         food                                                                              1
  10     Egg                    10      Egg                     10      Egg                10      Egg
  12     Legumes, nuts &        12      Legumes, nuts &         12      Legumes, nuts &    12      Legumes, nuts &
         seeds                          seeds                           seeds                      seeds
  13     Dairy                  13      Dairy                   13      Dairy              13      Dairy
  14     Oils & fats
  15     Sweets

PracticalCondiments &
  16     Exercise 3: Use of dietary diversity in food security and nutrition surveillance – Jillian L. Waid
         beverages
Methods for data analysis
 Cut offs :Not universally defined
 FANTA 2: Less than 5 ( out of 9 or 13 food
 groups) is inadequate

 Programmatically :
 Goal to raise the mean overall to the mean of the
 top third of the respondents
HDDS Calculation
Step 1: Assign 1 if the food group/item consumed; 0
 not consumed. Sum all the scores for various food
 groups. Sum will be between 0-12.
Step 2: The average HDDS for the sample
 population
                         Sum HDDS
                   Total no. of households


 Setting HDDS Threshold:
 Option 1: From a baseline survey take the HDDS for the
 richest income tercile (33%)
 Option 2: From a baseline survey take HDDS of the upper
 tercile of diet diversity (33%)
Different Types of Childhood
           Malnutrition
                                                             Normal height for age
Children


                           Wasted                Stunted            Underweight
            Normal
                     Low weight for height   Low height for age   Low weight for age
Why is nutrition not improving?
 Knowledge: do people know what foods they should
    consume by age, sex, occupation, physiological
    status?
   Do families have the resources/motivation to convert
    knowledge to practice
   If food intakes (energy and nutrients) are adequate,
    could there be intervening factors e.g. illness
   Pre-disposing factors: maternal undernutrition
    seasonal food/income shortages, migration, illness
    outbreaks, hygiene/sanitation, emergencies
   Importance of under 2’s
Illustration of association
  between dietary adequacy and
  anthropometry
Prevalence of % with                               % with                   Total under
under         inadequate                           adequate                 or
nutrition     diet                                 diet                     adequate
% <-2SDs         20                                   10                     30
                                                                            nutrition

% > -2SDs                        0                       70                   70

Total sample                  20                         80                  100

Note: 10% have adequate diets but are still undernourished due to other causes

  Source : Mason, 2002 in “Measurement and Assessment of Food Deprivation and Undernutrition”, FAO

Topic 21 diet diversity

  • 1.
    INTRODUCTION TO NUTRITIONANALYSIS : POLICY PARAMETERS Lalita Bhattacharjee Nutritionist Training Workshop on Analysis of Data for Measuring Availability, Access and Nutritional Status Assessment of Nutritional Status 14 -26 January 2012
  • 2.
    DIETARY ASSESSMENT AND NUTRITIONAL ASSESSMENT : KEY TERMS  A DIETARY ASSESMENT : comprehensive evaluation of a person's food intake. It is one of the established methods of nutritional assessment. Dietary assessment techniques range from food records to questionnaires and biological markers.  NUTRITIONAL ASSESSMENT : more comprehensive and includes determining nutritional status by analyzing the individual’s brief socio economic background, medical history, dietary, anthropometric, biochemical, clinical data and drug –nutrient interactions  NUTRITIONAL STATUS : measurement of the extent to which an individual’s physiologic need for nutrients is being met  NUTRIENT INTAKE : depends on actual food consumption which is influenced by factors such as economic situation, eating behaviour, emotional climate, cultural influences, effects of disease states on appetite and the ability to absorb nutrients  NUTRIENT REQUIREMENTS : are determined and influenced by age, sex, BMR, physiological status, activity patterns, physiologic stressors (infection, disease) and psychological stress
  • 3.
    OPTIMAL NUTRITIONAL STATUS Source: Mahan and Stump, 2000
  • 4.
    DIETARY ASSESSMENT PRINCIPLES Adequacy : a diet that provides enough energy and nutrients to meet the needs according to the recommended dietary intakes/allowances (for healthy and active life) Balance : a diet that provides enough, but not too much of each type of food ( adequacy of basic food groups) Variety : a diet that includes a wide selection of foods within each food group (dietary diversity/ includes biodiversity – species, varieties, cultivars) Nutrient Density : a diet that includes foods that provide the most nutrients for the least number of calories (nutrient dense foods) Moderation : A diet that limits intake of foods high in sugar and fat (nutrient intake goals/guidelines)
  • 5.
    WHAT IS DIETARYDIVERSITY Dietary diversity is a qualitative measure of food consumption that reflects household access to a variety of foods and is also a proxy for nutrient adequacy of the diet of individuals
  • 6.
    HHDDS and IDDS Measuresno. of different food groups consumed over a given reference period i.e. 24 hours/1 day HDD is also a proxy for HH socio economic status, whereas IDD is purely a proxy measure of an individual’s quality of diet.
  • 7.
    WHEN TO MEASUREDIETARY DIVERSITY Objective Timing Assessment of the typical diet of When food supplies are still HHs/individuals adequate (may be 4-5 mo after the main harvest) Assessment of the FS situation in During periods of greatest food rural, agriculture based communities shortage, such as immediately prior to the harvest/immediately after emergencies or natural disasters Assessment of FS situation in non- At the moment of concern to identify agricultural communities a possible food security problem Monitoring of FS/N programmes or Repeated measures to assess agricultural interventions such as impact of the intervention on the crop/livelihood diversification quality of the diet, conducted at the same time of the year as te baseline (avoid interference due to seasonal factors)
  • 8.
    Foods/food groups HDDS WDDS 9-group WDDS 13-group IYCF DD Q Food Group Q Food Group Q Food Group Q Food Group 1. Cereals 1,2 Starchy staples 1,2 Starchy staples 1,2 Starchy staples 2. White tubers & roots 4 Dark green leafy 4 Dark green leafy vegetables vegetables 3,4, Vegetables 3,6 Vitamin A rich fruits 3 Vitamin A rich 3,4,6 Vitamin A rich fruits & 5 & vegetables vegetables vegetables 5,7 Other fruits & 6 Vitamin A rich 5,7 Other fruits & vegetables fruits vegetables 5 Other vegetables 6,7 Fruits 7 Other fruits 8,9 Meat 8 Organ meat 8 Organ meat 11 Fish and other sea 9,11 Meat and fish 9,11 Meat and fish 8,9,1 Flesh foods food 1 10 Egg 10 Egg 10 Egg 10 Egg 12 Legumes, nuts & 12 Legumes, nuts & 12 Legumes, nuts & 12 Legumes, nuts & seeds seeds seeds seeds 13 Dairy 13 Dairy 13 Dairy 13 Dairy 14 Oils & fats 15 Sweets PracticalCondiments & 16 Exercise 3: Use of dietary diversity in food security and nutrition surveillance – Jillian L. Waid beverages
  • 9.
    Methods for dataanalysis  Cut offs :Not universally defined  FANTA 2: Less than 5 ( out of 9 or 13 food groups) is inadequate  Programmatically :  Goal to raise the mean overall to the mean of the top third of the respondents
  • 10.
    HDDS Calculation Step 1:Assign 1 if the food group/item consumed; 0 not consumed. Sum all the scores for various food groups. Sum will be between 0-12. Step 2: The average HDDS for the sample population Sum HDDS Total no. of households Setting HDDS Threshold: Option 1: From a baseline survey take the HDDS for the richest income tercile (33%) Option 2: From a baseline survey take HDDS of the upper tercile of diet diversity (33%)
  • 11.
    Different Types ofChildhood Malnutrition Normal height for age Children Wasted Stunted Underweight Normal Low weight for height Low height for age Low weight for age
  • 12.
    Why is nutritionnot improving?  Knowledge: do people know what foods they should consume by age, sex, occupation, physiological status?  Do families have the resources/motivation to convert knowledge to practice  If food intakes (energy and nutrients) are adequate, could there be intervening factors e.g. illness  Pre-disposing factors: maternal undernutrition seasonal food/income shortages, migration, illness outbreaks, hygiene/sanitation, emergencies  Importance of under 2’s
  • 13.
    Illustration of association between dietary adequacy and anthropometry Prevalence of % with % with Total under under inadequate adequate or nutrition diet diet adequate % <-2SDs 20 10 30 nutrition % > -2SDs 0 70 70 Total sample 20 80 100 Note: 10% have adequate diets but are still undernourished due to other causes Source : Mason, 2002 in “Measurement and Assessment of Food Deprivation and Undernutrition”, FAO

Editor's Notes

  • #4 An individual’s nutritional status reflects the degree to which physiologic needs for nutrients are being met. The balance between nutrient intake and nutrient requirements for optimal health is shown in the figure. Nutrient intake depends upon actual food consumption, which is influenced by factors such as economic situation, eating behaviour, emotional climate, cultural influences, effects of various disease states on appetite, and the ability to consume and absorb adequate nutrients. Nutrient requirements are also influenced by many factors –including physiologic stressors such as infection, chronic or acute disease, fever, trauma; normal anabolic states of growth, pregnancy, or rehabilitation; body maintenance and well being; and psychological stress. When adequate nutrients are consumed to support the body’s daily needs and any increased metabolic demands, the person develops an optimal nutritional status. Appropriate assessment techniques can detect a nutritional deficiency in the early stages of development, allowing dietary intake to be improved through nutritional support and counselling before a more severe condition develops.
  • #5 Most commonly, nutrient density is defined as a ratio of nutrient content (in grams) to the total energy content (in kilocalories or joules) ; Nutrient-dense food is opposite to energy-dense food (also called &quot;empty calorie&quot; food). According to the Dietary Guidelines for Americans 2005, nutrient-dense foods are those foods that provide substantial amounts of vitamins and minerals and relatively few calories. Fruits and vegetables are the nutrient-dense foods, while products containing added sugars, processed cereals, and alcohol are not.Second, nutrient density is defined as a ratio of food energy from carbohydrate, protein or fat to the total food energy. To calculate nutrient density (in percent), divide the food energy (in calories or joules) from one particular nutrient by the total food energy in the given food.Third, nutrient density is understood as the ratio of the nutrient composition of a given food to the nutrient requirements of the human body. Therefore, a nutrient-dense food is the food that delivers a complete nutritional package.
  • #14 The relationship between anthropometric and dietary energy inadequacy is not symmetric as ill health can cause growth failure in the presence of adequate food access. Food intake often will be reduced owing to poor appetite in sickness even in the presence of adequate food supply; however in a stable situation, people will not be of adequate body size with inadequate food energy even if health is good. The implications are illustrated in the table. Treating this association by placing individuals in categories depends crucially on the cut offs and implies that the cut off of – 2 z score for W/A used in the illustration is related to energy intake below requirement ( i.e hunger). In this case the cut off may be approximately correct. Crucially in a steady situation there should be no one in inadequate energy – adequate weight category (note bottom left cell is equal to 0). It is not possible to maintain an adequate weight with inadequate energy. This may help relate the indicators to each other to some extent, referring again to the table. DES indicators should go in the same direction as anthropometric indicators. Need for combination of methods support individual dietary intake surveys, including qualitative methods from HIES surveys and other HH surveys such as DHS and UNICEF – MICS surveys