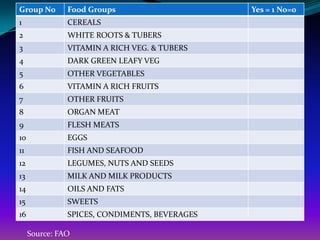
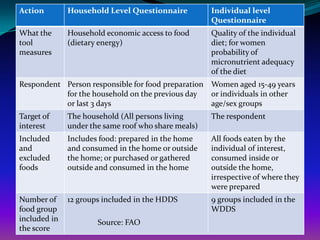
Srinivasulu Rajendran
 Centre for the Study of Regional Development (CSRD)


Jawaharlal Nehru University (JNU)
                      New Delhi
                        India
              r.srinivasulu@gmail.com
Objective of the session


1. To measure dietary diversity scores that a
   household has consumed over the preceding
   3 days or 24 hrs
1. How to calculate Dietary diversity scores
   and

2.How to create other indicators of interest
  from dietary diversity data
The Household Dietary Diversity Score (HDDS)


     It is a simple COUNT
      OF FOOD GROUPS
    that a household or an
          individual has
      consumed over the
      preceding 24 hours
       (FAO Guidelines)
Food Groups?
Group No       Food Groups                     Yes = 1 No=0
1              CEREALS
2              WHITE ROOTS & TUBERS
3              VITAMIN A RICH VEG. & TUBERS
4              DARK GREEN LEAFY VEG
5              OTHER VEGETABLES
6              VITAMIN A RICH FRUITS
7              OTHER FRUITS
8              ORGAN MEAT
9              FLESH MEATS
10             EGGS
11             FISH AND SEAFOOD
12             LEGUMES, NUTS AND SEEDS
13             MILK AND MILK PRODUCTS
14             OILS AND FATS
15             SWEETS
16             SPICES, CONDIMENTS, BEVERAGES

     Source: FAO
Detailed commodity groups available
                 in
“Guidelines for Measuring Household
  and Individual Dietary Diversity”

               FAO
IT IS VERY IMPORTANT
TO UNDERSTAND THE
TYPE OF COMMODITY
  INCULDES WHEN IT
        COOKED
How HDDS reflect to Food
Security?

     HDDS is meant to reflect,
    in a snapshot form, the
     economic ability of a
 household to access a variety of
             foods .
             Source: FAO
Whereas, Individual Dietary
 Diversity Scores aim to reflect
 nutrient adequacy, BUT there
some evidences Women Dietary
  Diversity Score (WDDS) also
 reflects Household Economic
         Access to Food
             Source: FAO
Difference between
Household and Individual
         Levels
Action        Household Level Questionnaire          Individual level
                                                     Questionnaire
What the      Household economic access to food      Quality of the individual
tool          (dietary energy)                       diet; for women
measures                                             probability of
                                                     micronutrient adequacy
                                                     of the diet
Respondent Person responsible for food preparation Women aged 15-49 years
           for the household on the previous day   or individuals in other
           or last 3 days                          age/sex groups
Target of     The household (All persons living      The respondent
interest      under the same roof who share meals)
Included      Includes food: prepared in the home    All foods eaten by the
and           and consumed in the home or outside    individual of interest,
excluded      the home; or purchased or gathered     consumed inside or
foods         outside and consumed in the home       outside the home,
                                                     irrespective of where they
                                                     were prepared
Number of     12 groups included in the HDDS         9 groups included in the
food group                                           WDDS
included in           Source: FAO
the score
BUT
Today we are
focusing on
“The Household Dietary
Diversity Score (HDDS)”
Data Sources
     The
 Household
   Dietary                         Anthropometric
Diversity Score                       indictors
   (HDDS)


                           Bangladesh Demographic
Chronic Poverty Study -   and Health Survey (BDHS) -
        IFPRI                        2007
Reference Period

 FAO uses a reference period of the
  previous 24 hrs, whereas IFPRI uses 3
  days recall period.
 The recall period of 24 hrs was chosen
  by FAO as it is less subject to recall
  error, less cumbersome for the
  respondent and also conforms to the
  recall time period
When to measure dietary diversity?
 The optimal time of year to measure dietary diversity of
  households or individuals depends on the objective of the
  survey or monitoring activity.
 There are several scenarios to assist potential users in
  planning surveys.
 More details please refer:


“Guidelines for Measuring Households
 and Individual Dietary Diversity”
Source: FAO
Activities to undertake before beginning data collection

 Translation and adaption steps
(i) Basic translation
(ii) First Review
(iii) Key informant and community meeting to refine the food lists and
    translations

 Technical issues to discuss prior to beginning data collection
 (i) Minimum quantities
 (ii) Individual food items that could be classified into more than one
  food group (decide appropriate food group)
 (iii) mixed dishes: team will need to agree on a way to disaggregate
  mixed dishes in order to record all of the individual components in
  their respective food groups.

 Training Survey interviewers

 Source: FAO
How to Create Dietary Diversity Scores

 As per FAO, Dietary Diversity Scores are calculated by
  summing the number of food groups consumed in the
  household or by the individual respondent over the 24
  hrs recall period.
 Whereas, we are measuring on the basis of 3 days
  recall period due to non-availability of data on 24 hrs
  recall period.


Source: FAO
Step 1
 Create new food group variables for those food groups
  that need to be aggregated.
 For example: HDDS the food group “Starchy staples” is
  a combination of “Cereals” and “White roots and
  tubers”. A new variable termed “Starchy staples”
  should be created by combining the answers to
  “Cereals” and White roots and tubers”.
 STATA Command:
 gen star_staple = 0
 replace star_staple = 1 if cereal ==1 | white_root == 1
 As a check, run a “Frequencies” test on all newly
  created variables and make sure that all value are
  either 0 or 1. There should be no values > 1 for the
  newly created variable
Step 2
USING AND INTERPRETING RESULTS


 There are no established cut-off points in terms of
  number of food groups to indicate adequate or
  inadequate dietary diversity for the HDDS.
 Because of this, it is recommended to use the mean
  score or distribution of scores for analytical purpose
  and to set the programme targets.
When interpreting
    the dietary
diversity score, it is
important to keep
   in mind that
1. The dietary diversity score does not
   indicate the quantity of food consumed
2.Diet varies across seasons and some foods
   can be available in large quantities and at
   low cost for short periods
3.There may be urban/rural differentials in
   dietary diversity. Variety is often much
   greater in urban and peri-urban centres
   where food markets are adequately
   supplied and easily accessible

Topic 21 diet diversity stata

  • 1.
    Srinivasulu Rajendran Centrefor the Study of Regional Development (CSRD) Jawaharlal Nehru University (JNU) New Delhi India r.srinivasulu@gmail.com
  • 2.
    Objective of thesession 1. To measure dietary diversity scores that a household has consumed over the preceding 3 days or 24 hrs
  • 3.
    1. How tocalculate Dietary diversity scores and 2.How to create other indicators of interest from dietary diversity data
  • 4.
    The Household DietaryDiversity Score (HDDS) It is a simple COUNT OF FOOD GROUPS that a household or an individual has consumed over the preceding 24 hours (FAO Guidelines)
  • 5.
  • 6.
    Group No Food Groups Yes = 1 No=0 1 CEREALS 2 WHITE ROOTS & TUBERS 3 VITAMIN A RICH VEG. & TUBERS 4 DARK GREEN LEAFY VEG 5 OTHER VEGETABLES 6 VITAMIN A RICH FRUITS 7 OTHER FRUITS 8 ORGAN MEAT 9 FLESH MEATS 10 EGGS 11 FISH AND SEAFOOD 12 LEGUMES, NUTS AND SEEDS 13 MILK AND MILK PRODUCTS 14 OILS AND FATS 15 SWEETS 16 SPICES, CONDIMENTS, BEVERAGES Source: FAO
  • 7.
    Detailed commodity groupsavailable in “Guidelines for Measuring Household and Individual Dietary Diversity” FAO
  • 8.
    IT IS VERYIMPORTANT TO UNDERSTAND THE TYPE OF COMMODITY INCULDES WHEN IT COOKED
  • 9.
    How HDDS reflectto Food Security? HDDS is meant to reflect, in a snapshot form, the economic ability of a household to access a variety of foods . Source: FAO
  • 10.
    Whereas, Individual Dietary Diversity Scores aim to reflect nutrient adequacy, BUT there some evidences Women Dietary Diversity Score (WDDS) also reflects Household Economic Access to Food Source: FAO
  • 11.
  • 12.
    Action Household Level Questionnaire Individual level Questionnaire What the Household economic access to food Quality of the individual tool (dietary energy) diet; for women measures probability of micronutrient adequacy of the diet Respondent Person responsible for food preparation Women aged 15-49 years for the household on the previous day or individuals in other or last 3 days age/sex groups Target of The household (All persons living The respondent interest under the same roof who share meals) Included Includes food: prepared in the home All foods eaten by the and and consumed in the home or outside individual of interest, excluded the home; or purchased or gathered consumed inside or foods outside and consumed in the home outside the home, irrespective of where they were prepared Number of 12 groups included in the HDDS 9 groups included in the food group WDDS included in Source: FAO the score
  • 13.
  • 14.
  • 15.
    Data Sources The Household Dietary Anthropometric Diversity Score indictors (HDDS) Bangladesh Demographic Chronic Poverty Study - and Health Survey (BDHS) - IFPRI 2007
  • 16.
    Reference Period  FAOuses a reference period of the previous 24 hrs, whereas IFPRI uses 3 days recall period.  The recall period of 24 hrs was chosen by FAO as it is less subject to recall error, less cumbersome for the respondent and also conforms to the recall time period
  • 17.
    When to measuredietary diversity?  The optimal time of year to measure dietary diversity of households or individuals depends on the objective of the survey or monitoring activity.  There are several scenarios to assist potential users in planning surveys.  More details please refer: “Guidelines for Measuring Households and Individual Dietary Diversity” Source: FAO
  • 18.
    Activities to undertakebefore beginning data collection  Translation and adaption steps (i) Basic translation (ii) First Review (iii) Key informant and community meeting to refine the food lists and translations  Technical issues to discuss prior to beginning data collection  (i) Minimum quantities  (ii) Individual food items that could be classified into more than one food group (decide appropriate food group)  (iii) mixed dishes: team will need to agree on a way to disaggregate mixed dishes in order to record all of the individual components in their respective food groups.  Training Survey interviewers Source: FAO
  • 19.
    How to CreateDietary Diversity Scores  As per FAO, Dietary Diversity Scores are calculated by summing the number of food groups consumed in the household or by the individual respondent over the 24 hrs recall period.  Whereas, we are measuring on the basis of 3 days recall period due to non-availability of data on 24 hrs recall period. Source: FAO
  • 20.
  • 21.
     Create newfood group variables for those food groups that need to be aggregated.  For example: HDDS the food group “Starchy staples” is a combination of “Cereals” and “White roots and tubers”. A new variable termed “Starchy staples” should be created by combining the answers to “Cereals” and White roots and tubers”.  STATA Command:  gen star_staple = 0  replace star_staple = 1 if cereal ==1 | white_root == 1  As a check, run a “Frequencies” test on all newly created variables and make sure that all value are either 0 or 1. There should be no values > 1 for the newly created variable
  • 22.
  • 23.
    USING AND INTERPRETINGRESULTS  There are no established cut-off points in terms of number of food groups to indicate adequate or inadequate dietary diversity for the HDDS.  Because of this, it is recommended to use the mean score or distribution of scores for analytical purpose and to set the programme targets.
  • 24.
    When interpreting the dietary diversity score, it is important to keep in mind that
  • 25.
    1. The dietarydiversity score does not indicate the quantity of food consumed 2.Diet varies across seasons and some foods can be available in large quantities and at low cost for short periods 3.There may be urban/rural differentials in dietary diversity. Variety is often much greater in urban and peri-urban centres where food markets are adequately supplied and easily accessible