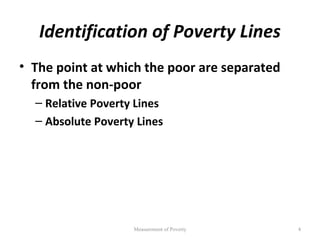
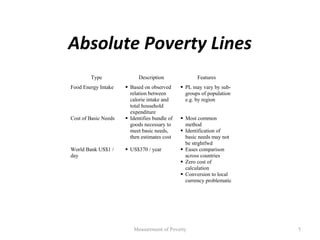
This document discusses concepts and methods for measuring poverty. It notes that while governments collect many statistics on poverty, the data ultimately comes from individual reports that may not be accurate. There are practical concerns in measuring poverty, including defining the poverty line, what unit to measure (individual, household), and what indicators to use. Common methods for setting the poverty line include the food energy intake method and cost of basic needs approach. The food energy intake method sets the poverty line based on the expenditure needed to meet minimum daily calorie requirements. The cost of basic needs approach identifies items in a basic consumption bundle and determines the total cost. Poverty lines may vary by region due to differences in prices and publicly provided goods and services.
Lewis theory, Rani-Fie-Lewis Theory on unlimited supplies of Labour and Todaro Model of Rural Urban Migration are famous theories on Rural_Urban Migration in Development economics
Poverty Reduction Policies in Low Income Countriestutor2u
This revision presentation covers some of the main causes of continued high levels of extreme poverty in low and middle income countries and considers a range of pro-poor government interventions designed to increase productivity and regular employment and waged income in formal labour markets.
Zorica Nedovic Budic GeoICT for Planning & PolicyOECD CFE
Presentation by by Zorica Nedovic-Budic, Head of School of Geography, Planning and Environmental Policy, University College of Dublin, Ireland
9th Annual Meeting of the OECD LEED Forum on Partnerships and Local Governance (Dublin-Kilkenny, Ireland), 26/27 March 2013.
http://www.oecd.org/cfe/leed/9thfplgmeeting.htm
Presented at the 2nd Phase Planning and Review Workshop of the Indo-Ganges Basin Focal Project, 24-25 February, 2009, Haryana, India. Visit http://cpwfbfp.pbwiki.com for additional information
Jeremy Bird, Director General of IWMI, discusses the huge water management challenges facing India and shows how IWMI’s research can contribute to effective and sustainable solutions.
- Video recording of this lecture in English language: https://youtu.be/lK81BzxMqdo
- Video recording of this lecture in Arabic language: https://youtu.be/Ve4P0COk9OI
- Link to download the book free: https://nephrotube.blogspot.com/p/nephrotube-nephrology-books.html
- Link to NephroTube website: www.NephroTube.com
- Link to NephroTube social media accounts: https://nephrotube.blogspot.com/p/join-nephrotube-on-social-media.html
Ozempic: Preoperative Management of Patients on GLP-1 Receptor Agonists Saeid Safari
Preoperative Management of Patients on GLP-1 Receptor Agonists like Ozempic and Semiglutide
ASA GUIDELINE
NYSORA Guideline
2 Case Reports of Gastric Ultrasound
The prostate is an exocrine gland of the male mammalian reproductive system
It is a walnut-sized gland that forms part of the male reproductive system and is located in front of the rectum and just below the urinary bladder
Function is to store and secrete a clear, slightly alkaline fluid that constitutes 10-30% of the volume of the seminal fluid that along with the spermatozoa, constitutes semen
A healthy human prostate measures (4cm-vertical, by 3cm-horizontal, 2cm ant-post ).
It surrounds the urethra just below the urinary bladder. It has anterior, median, posterior and two lateral lobes
It’s work is regulated by androgens which are responsible for male sex characteristics
Generalised disease of the prostate due to hormonal derangement which leads to non malignant enlargement of the gland (increase in the number of epithelial cells and stromal tissue)to cause compression of the urethra leading to symptoms (LUTS
Knee anatomy and clinical tests 2024.pdfvimalpl1234
This includes all relevant anatomy and clinical tests compiled from standard textbooks, Campbell,netter etc..It is comprehensive and best suited for orthopaedicians and orthopaedic residents.
Report Back from SGO 2024: What’s the Latest in Cervical Cancer?bkling
Are you curious about what’s new in cervical cancer research or unsure what the findings mean? Join Dr. Emily Ko, a gynecologic oncologist at Penn Medicine, to learn about the latest updates from the Society of Gynecologic Oncology (SGO) 2024 Annual Meeting on Women’s Cancer. Dr. Ko will discuss what the research presented at the conference means for you and answer your questions about the new developments.
Flu Vaccine Alert in Bangalore Karnatakaaddon Scans
As flu season approaches, health officials in Bangalore, Karnataka, are urging residents to get their flu vaccinations. The seasonal flu, while common, can lead to severe health complications, particularly for vulnerable populations such as young children, the elderly, and those with underlying health conditions.
Dr. Vidisha Kumari, a leading epidemiologist in Bangalore, emphasizes the importance of getting vaccinated. "The flu vaccine is our best defense against the influenza virus. It not only protects individuals but also helps prevent the spread of the virus in our communities," he says.
This year, the flu season is expected to coincide with a potential increase in other respiratory illnesses. The Karnataka Health Department has launched an awareness campaign highlighting the significance of flu vaccinations. They have set up multiple vaccination centers across Bangalore, making it convenient for residents to receive their shots.
To encourage widespread vaccination, the government is also collaborating with local schools, workplaces, and community centers to facilitate vaccination drives. Special attention is being given to ensuring that the vaccine is accessible to all, including marginalized communities who may have limited access to healthcare.
Residents are reminded that the flu vaccine is safe and effective. Common side effects are mild and may include soreness at the injection site, mild fever, or muscle aches. These side effects are generally short-lived and far less severe than the flu itself.
Healthcare providers are also stressing the importance of continuing COVID-19 precautions. Wearing masks, practicing good hand hygiene, and maintaining social distancing are still crucial, especially in crowded places.
Protect yourself and your loved ones by getting vaccinated. Together, we can help keep Bangalore healthy and safe this flu season. For more information on vaccination centers and schedules, residents can visit the Karnataka Health Department’s official website or follow their social media pages.
Stay informed, stay safe, and get your flu shot today!
Acute scrotum is a general term referring to an emergency condition affecting the contents or the wall of the scrotum.
There are a number of conditions that present acutely, predominantly with pain and/or swelling
A careful and detailed history and examination, and in some cases, investigations allow differentiation between these diagnoses. A prompt diagnosis is essential as the patient may require urgent surgical intervention
Testicular torsion refers to twisting of the spermatic cord, causing ischaemia of the testicle.
Testicular torsion results from inadequate fixation of the testis to the tunica vaginalis producing ischemia from reduced arterial inflow and venous outflow obstruction.
The prevalence of testicular torsion in adult patients hospitalized with acute scrotal pain is approximately 25 to 50 percent
Couples presenting to the infertility clinic- Do they really have infertility...Sujoy Dasgupta
Dr Sujoy Dasgupta presented the study on "Couples presenting to the infertility clinic- Do they really have infertility? – The unexplored stories of non-consummation" in the 13th Congress of the Asia Pacific Initiative on Reproduction (ASPIRE 2024) at Manila on 24 May, 2024.
Ethanol (CH3CH2OH), or beverage alcohol, is a two-carbon alcohol
that is rapidly distributed in the body and brain. Ethanol alters many
neurochemical systems and has rewarding and addictive properties. It
is the oldest recreational drug and likely contributes to more morbidity,
mortality, and public health costs than all illicit drugs combined. The
5th edition of the Diagnostic and Statistical Manual of Mental Disorders
(DSM-5) integrates alcohol abuse and alcohol dependence into a single
disorder called alcohol use disorder (AUD), with mild, moderate,
and severe subclassifications (American Psychiatric Association, 2013).
In the DSM-5, all types of substance abuse and dependence have been
combined into a single substance use disorder (SUD) on a continuum
from mild to severe. A diagnosis of AUD requires that at least two of
the 11 DSM-5 behaviors be present within a 12-month period (mild
AUD: 2–3 criteria; moderate AUD: 4–5 criteria; severe AUD: 6–11 criteria).
The four main behavioral effects of AUD are impaired control over
drinking, negative social consequences, risky use, and altered physiological
effects (tolerance, withdrawal). This chapter presents an overview
of the prevalence and harmful consequences of AUD in the U.S.,
the systemic nature of the disease, neurocircuitry and stages of AUD,
comorbidities, fetal alcohol spectrum disorders, genetic risk factors, and
pharmacotherapies for AUD.
Explore natural remedies for syphilis treatment in Singapore. Discover alternative therapies, herbal remedies, and lifestyle changes that may complement conventional treatments. Learn about holistic approaches to managing syphilis symptoms and supporting overall health.
New Directions in Targeted Therapeutic Approaches for Older Adults With Mantl...i3 Health
i3 Health is pleased to make the speaker slides from this activity available for use as a non-accredited self-study or teaching resource.
This slide deck presented by Dr. Kami Maddocks, Professor-Clinical in the Division of Hematology and
Associate Division Director for Ambulatory Operations
The Ohio State University Comprehensive Cancer Center, will provide insight into new directions in targeted therapeutic approaches for older adults with mantle cell lymphoma.
STATEMENT OF NEED
Mantle cell lymphoma (MCL) is a rare, aggressive B-cell non-Hodgkin lymphoma (NHL) accounting for 5% to 7% of all lymphomas. Its prognosis ranges from indolent disease that does not require treatment for years to very aggressive disease, which is associated with poor survival (Silkenstedt et al, 2021). Typically, MCL is diagnosed at advanced stage and in older patients who cannot tolerate intensive therapy (NCCN, 2022). Although recent advances have slightly increased remission rates, recurrence and relapse remain very common, leading to a median overall survival between 3 and 6 years (LLS, 2021). Though there are several effective options, progress is still needed towards establishing an accepted frontline approach for MCL (Castellino et al, 2022). Treatment selection and management of MCL are complicated by the heterogeneity of prognosis, advanced age and comorbidities of patients, and lack of an established standard approach for treatment, making it vital that clinicians be familiar with the latest research and advances in this area. In this activity chaired by Michael Wang, MD, Professor in the Department of Lymphoma & Myeloma at MD Anderson Cancer Center, expert faculty will discuss prognostic factors informing treatment, the promising results of recent trials in new therapeutic approaches, and the implications of treatment resistance in therapeutic selection for MCL.
Target Audience
Hematology/oncology fellows, attending faculty, and other health care professionals involved in the treatment of patients with mantle cell lymphoma (MCL).
Learning Objectives
1.) Identify clinical and biological prognostic factors that can guide treatment decision making for older adults with MCL
2.) Evaluate emerging data on targeted therapeutic approaches for treatment-naive and relapsed/refractory MCL and their applicability to older adults
3.) Assess mechanisms of resistance to targeted therapies for MCL and their implications for treatment selection
NVBDCP.pptx Nation vector borne disease control programSapna Thakur
NVBDCP was launched in 2003-2004 . Vector-Borne Disease: Disease that results from an infection transmitted to humans and other animals by blood-feeding arthropods, such as mosquitoes, ticks, and fleas. Examples of vector-borne diseases include Dengue fever, West Nile Virus, Lyme disease, and malaria.
2. Measurement of Poverty
“The governments are very keen on
amassing statistics. They collect them,
add them, raise them to the nth power
and take the cubed root and prepare
wonderful diagrams.
But you must never forget that every
one of these figures comes in the first
instance from the village watchman who
just puts down whatever he damn well
pleases.”
- Sir Josiah Stamp Measurement of Poverty 2
3. Measurement of Poverty Practical
Concerns
• Identification of Poverty Line
• Defining the Unit of Measurement
• Selecting the Indicator of Well-being
Measurement of Poverty 3
4. Identification of Poverty Lines
• The point at which the poor are separated
from the non-poor
– Relative Poverty Lines
– Absolute Poverty Lines
Measurement of Poverty 4
5. Absolute Poverty Lines
Type Description Features
Food Energy Intake Based on observed PL may vary by sub-
relation between groups of population
calorie intake and e.g. by region
total household
expenditure
Cost of Basic Needs Identifies bundle of Most common
goods necessary to method
meet basic needs, Identification of
then estimates cost basic needs may not
be strghtfwd
World Bank US$1 / US$370 / year Eases comparison
day across countries
Zero cost of
calculation
Conversion to local
currency problematic
Measurement of Poverty 5
6. Food Energy Intake Method
• Sets PL at the level of expenditure at which FEI is
just sufficient to meet basic nutrition requirements
• STEP ONE: Establish the minimum nutrition
requirements.
• STEP TWO: Examine the observed spending pattern
to see at what average expenditure household just
achieve minimum nutrition requirement.
Measurement of Poverty 6
7. Food Energy Intake Method
Food
Energy
Intake
Min Nutrition
Standard (eg 2100
cals.)
PL Expenditure
(or Income)
Measurement of Poverty 7
8. Food Energy Intake Method
• The PL determined by the FEI method may
vary across regions due to differences in:
Preferences: if more expensive animal protein and
less food grain is eaten.
Relative Prices: in urban areas it may cost more to
obtain basic nutrition because food prices are higher.
Publicly Provided Goods: in capital city transport
to/from work may be cheaper than in provincial cities,
allowing for lower expenditure level to meet
minimum FEI.
Measurement of Poverty 8
9. Food Energy Intake Method
• This method does take account of non-food
purchases.
Measurement of Poverty 9
10. Cost of Basic Needs
• PL is equal to the value of a bundle of
consumption goods necessary to meet basic
needs
May include just food (extreme poverty)
But more commonly includes non-food items
Measurement of Poverty 10
11. Cost of Basic Needs
• STEP ONE: Establish the minimum
consumption bundle necessary to meet basic
needs
Measurement of Poverty 11
12. Cost of Basic Needs
• STEP TWO: Establish the cost for the items in
the basic consumption bundle
Measurement of Poverty 12
13. Additional Considerations in Setting
Poverty Lines
• Regional Poverty Lines
Significant regional price differences may exist
Urban / Rural poverty lines common
• Sensitivity Analysis
Typically near mode of distribution
Multiple poverty lines often tried
Measurement of Poverty 13
14. Distribution of Expenditure
Mexico, 1992
0.18
0.16 Poverty Line
0.14
Population Share
0.12
0.1
0.08
0.06
0.04
0.02
0
6000
11000
16000
21000
31000
36000
41000
46000
51000
56000
61000
66000
71000
76000
81000
86000
91000
96000
10100
10600
1000
26000
Expenditure/Quarter (1984 pesos)
Measurement of Poverty 14
16. Measurement of Poverty Practical
Concerns
• Identification of Poverty Line
• Defining the Unit of Measurement
• Selecting the Indicator of Well-being
Measurement of Poverty 16
17. Defining the Unit of Measurement
Household vs. Individual
Adjusting for differences among HH
Adjusting for the age / gender of HH members
Adjusting for HH size
Measurement of Poverty 17
18. Defining the Unit of Measurement
• Example:
2 HH with monthly Y of $150
HH1 has 2 members…per capita Y = $75
HH2 has 3 members …per capita Y = $50
BUT:
• HH1 has 2 adult men
• HH2 has woman and 2 small children
Measurement of Poverty 18
19. Equivalence Scales and Economies of
Scale
• HH size is often measured in “adult
equivalent” units
each member of the HH counts as some fraction
of an adult male
Economies of scales can then be accounted for
by scaling the adult equivalent units
Measurement of Poverty 19
20. Equivalence Scales and Economies of
Scale
• Many different methodologies are followed
within two basic approaches
Fixed Scales
Estimated Scales
Measurement of Poverty 20
21. Fixed Scales
• Ex 1: Adult Equivalent Scale:
Adult Male = 1
Adult Female = 0.74
Child < 5 years = 0.6
• Ex 2: OECD Scale: AE=1+0.7*(A-1)+0.5*C
– First adult = 1
– Additional adults = 0.7
– Children < 14 = 0.5
Measurement of Poverty 21
22. Estimating AE Scales
• Based on examining HH data to see how
consumption varies with gender/age and size
Food share of expenditure is regressed on HH
size, HH composition
Measurement of Poverty 22
23. Examples of AE Estimated Scales
• Ex 1: Deaton and Meullbauer, Sri Lanka,
Indonesia
Adults = 1
Child 13-17 = 0.5
Child 7-12 = 0.3
Child < 7 = 0.2
Measurement of Poverty 23
24. Examples of AE Estimated Scales
• Ex 2: Deaton, India and Pakistan
– The AE value of adding another person to a HH
with 2 adults:
Age 0-4 = 0.48
Age 5-9 = 0.56
Age 10-14 = 0.60
Age 15-54 = 0.68
Measurement of Poverty 24
25. What is a HH?
• UN definition:
– “Group of people who eat together”
• But: how long must one be a resident to be counted
as part of a HH
– Students, migrant workers, etc.
Measurement of Poverty 25
26. Measurement of Poverty Practical
Concerns
• Identification of Poverty Line
• Defining the Unit of Measurement
• Selecting the Indicator of Well-being
Measurement of Poverty 26
27. Selecting the Indicator of
Well-being
• Monetary Measure of Welfare
Income
Expenditure
• Non-Monetary Measures of Welfare
Direct Measures
Subjective Measures
Measurement of Poverty 27
28. Income
• Definition: Y = C + ∆ in net worth
• Example
Assets start of year: $10K
Spending on consumption: $3K
Assets end of year: $11K
Annual Y: $4K
Measurement of Poverty 28
29. Problems with Income as Welfare
Measure
• Conceptual Problems
– Goal is to measure HH ability to meet basic
needs, but Y is just one factor
• access to credit, public services, access, etc. are other
factors that determine ability to meet basic needs
Measurement of Poverty 29
30. Problems with Income as Welfare
Measure
• Measurement Problems
– Understating of Y
Difficult to recall all of Y, especially when Y flow is
erratic as in the informal sector
Fear of tax collector
Illegally earned Y
Separating inputs from revenue in agriculture
Accounting for own consumption of output
Measurement of Poverty 30
31. Expenditure
• Generally preferred to Income
– Is more direct measure of what is consumed
– Less volatile than Y
• Consumption smoothing...
Measurement of Poverty 31
33. Calculating Y or Expenditure
for HH
• How do we measure Y / Expenditure?
• What is included?
• NB: HH may be both producers and
consumers
Measurement of Poverty 33
34. Measuring Y and Expenditure
HH as Consumer
Household
Household Y Expenditure
Wage Y Food expenditure
Agricultural Y C of own-produced food
Non-farm self-employment Housing expenditure
Rent and Imputed Rent Non-food expenditure
Net inter-HH transfers
Other Y
Measurement of Poverty 34
35. Measuring Y and Expenditure
Household as Producer
Receipts Outgoing
Revenue from sale of output Cash expenditure on inputs
Own-consumption for In-kind expenditure on inputs
produced output
Measurement of Poverty 35
36. Calculating Y and Expenditure
• Must not include:
Inputs into HH production, like money spent on
seeds, fertilizer
Expenditure on investment, like purchase of
tools
Measurement of Poverty 36
37. Calculating Y and Expenditure
• Should include:
Housing for owner-occupied dwellings
Expenditure on durable goods
Measurement of Poverty 37
38. Non-Monetary Measure
of Welfare
• Direct Welfare Measures
Nutrition Poverty
Health Poverty
Education Poverty
Measurement of Poverty 38
39. Nutrition Poverty
• Input
– Example: Calories per day
• Outcomes
– Example: Malnutrition
Measurement of Poverty 39
40. Health Poverty
• Outcomes
– Ex: life expectancy, infection rates
• Inputs
– Ex: vaccination rates
Measurement of Poverty 40
42. Subjective Measures
• HH may be asked directly about their welfare
• HH may be asked to establish minimum
standards
• Community indicators may be established
Measurement of Poverty 42
43. Poverty Measures
• We may want to measure poverty directly
instead of looking at Y and inequality
together
• The most commonly used poverty measures
are:
Head Count Index
Poverty Gap
Proportional Poverty Gap
Squared Poverty Gap
Measurement of Poverty 43
44. Head Count Index
• HCI = (# poor) / (population)
• Measures the “incidence” of poverty
– i.e. it tells us “How many poor”
Measurement of Poverty 44
45. Head Count Index
• Simplest and most commonly used measure
• Limitations:
Does not account for depth of poverty; i.e. it
does not tell us how far below the poverty line
the poor are.
• Advantages:
Simple to understand, straightforward
interpretation.
Additive across populations.
Measurement of Poverty 45
46. Regional Head Count Estimates
Extreme Poverty <$275/year
Millions of
HC People
SSA: .30 120
South Asia: .29 300
ME/NA: .21 40
LA / Car: .12 50
East Asia: .09 120
Measurement of Poverty 46
47. Regional Head Count Estimates
Moderate Poverty < $370/year
Millions of
HC People
SSA: .48 184
South Asia: .52 532
ME/NA: .31 60
LA / Car: .22 87
East Asia: .13 182
Measurement of Poverty 47
48. Absolute Poverty Gap
• PG = (# Poor) * (Y shortfall)
• PG = Σ(Z-Yi) ;
– where Z is PL, Yi is income of person i
• It tells us the total Y shortfall of the poor; i.e.
the absolute amount that would be needed
to raise all the poor up to the poverty line.
Measurement of Poverty 48
49. Absolute Poverty Gap
Poverty Gap
Y
PL
Population
(poorest to richest)
Measurement of Poverty 49
50. Absolute Poverty Gap
Y Y
Poverty
Gap
PL PL
Population Population
Relatively large Relatively small
poverty gap poverty gap
Measurement of Poverty 50
51. Proportional Poverty Gap
• PPG = (1/N)Σ{(Z-Yi)/Z}
• Measures the “depth” of poverty
• It gives some weight to how far below the
poverty line a poor individual is
– If a poor person’s income fall, the HC won’t
change, but the PPG will increase to reflect the
increase in the depth of poverty
Measurement of Poverty 51
52. Squared Poverty Gap(Foster-Greere
Thorbecke)
• PPG = (1/N)Σ{(Z-Yi)/Z}2
• Measures the “severity” of poverty
• Squares the difference between the poverty
line and each household’s income
– provides much greater weight to the poorest of
the poor because the farther the HH from the
poverty line, the greater the weight it is given
Measurement of Poverty 52
53. Poverty Measures
• Head Count • Income Distribution
• Proportional Poverty
Gap Y
• Squared Poverty Gap
• Absolute Poverty Gap
PL
Pop (poorest to richest)
Measurement of Poverty 53
54. Poverty Measures
• These first 3 poverty measures are often
referred to as the Foster-Greere-Thorbecke
family of indices
• They can all be written as:
– Pα= (1/N)Σ{(Z-Yi)/Z}α
• α=0 is HC
• α=1 is PPG
• α=2 is SPG
Measurement of Poverty 54
55. Poverty Measures from Mexico
HC PPG SPG
1984
Rural .90 .58 .42
Urban .72 .35 .21
1989
Rural .94 .62 .61
Urban .68 .32 .39
Measurement of Poverty 55
56. Human Development Index
• An attempt to account for some of the
limitations of using just income or
expenditure as a measure of welfare
• Tries to take seriously some of Sen’s
arguments about capabilities
– Sen argues that the goal is to increase
capabilities …to be well fed, educated, healthy
– These capabilities won’t always be perfectly
correlated with income
Measurement of Poverty 56
57. Income and Capabilities
Per Capita Share of Share of
Income Poorest 40% Richest 20%
Sri Lanka 2,990 22 39
Guatemala 3,350 8 63
Life Infant Adult
Expectancy Mortality Literacy
Sri Lanka 72 18 89
Guatemala 65 48 54
Measurement of Poverty 57
58. HDI
• Consists of 3 elements
• Life Expectancy
– Educational Attainment
2/3 Adult Literacy
1/3 School Enrolment
– Per Capita Income
Adjusted down for Y > $5K
• Each component scored on 0 - 1 scale
• Index is simple average of 3 components
Measurement of Poverty 58
59. Gender Development Index
• Motivated by inequality in the distribution of
resources across gender.
• Is there evidence that resources are
distributed unequally?
• The same 3 components as HDI, but gives
weight to relative equality in Y and
achievement of capabilities by gender.
Measurement of Poverty 59
60. Human Poverty Index
• Attempt by UNDP to take Sen’s capability
approach even more seriously
• Index combines 3 parts:
Vulnerability to early death
Access to education
Overall standard of living
• Health, water, nutrition
Measurement of Poverty 60
61. Measurement of Poverty
The secret of truth
is that there are no facts,
only stories.
- Joao Ubaldo Ribeira
Brazilian novelist
Measurement of Poverty 61