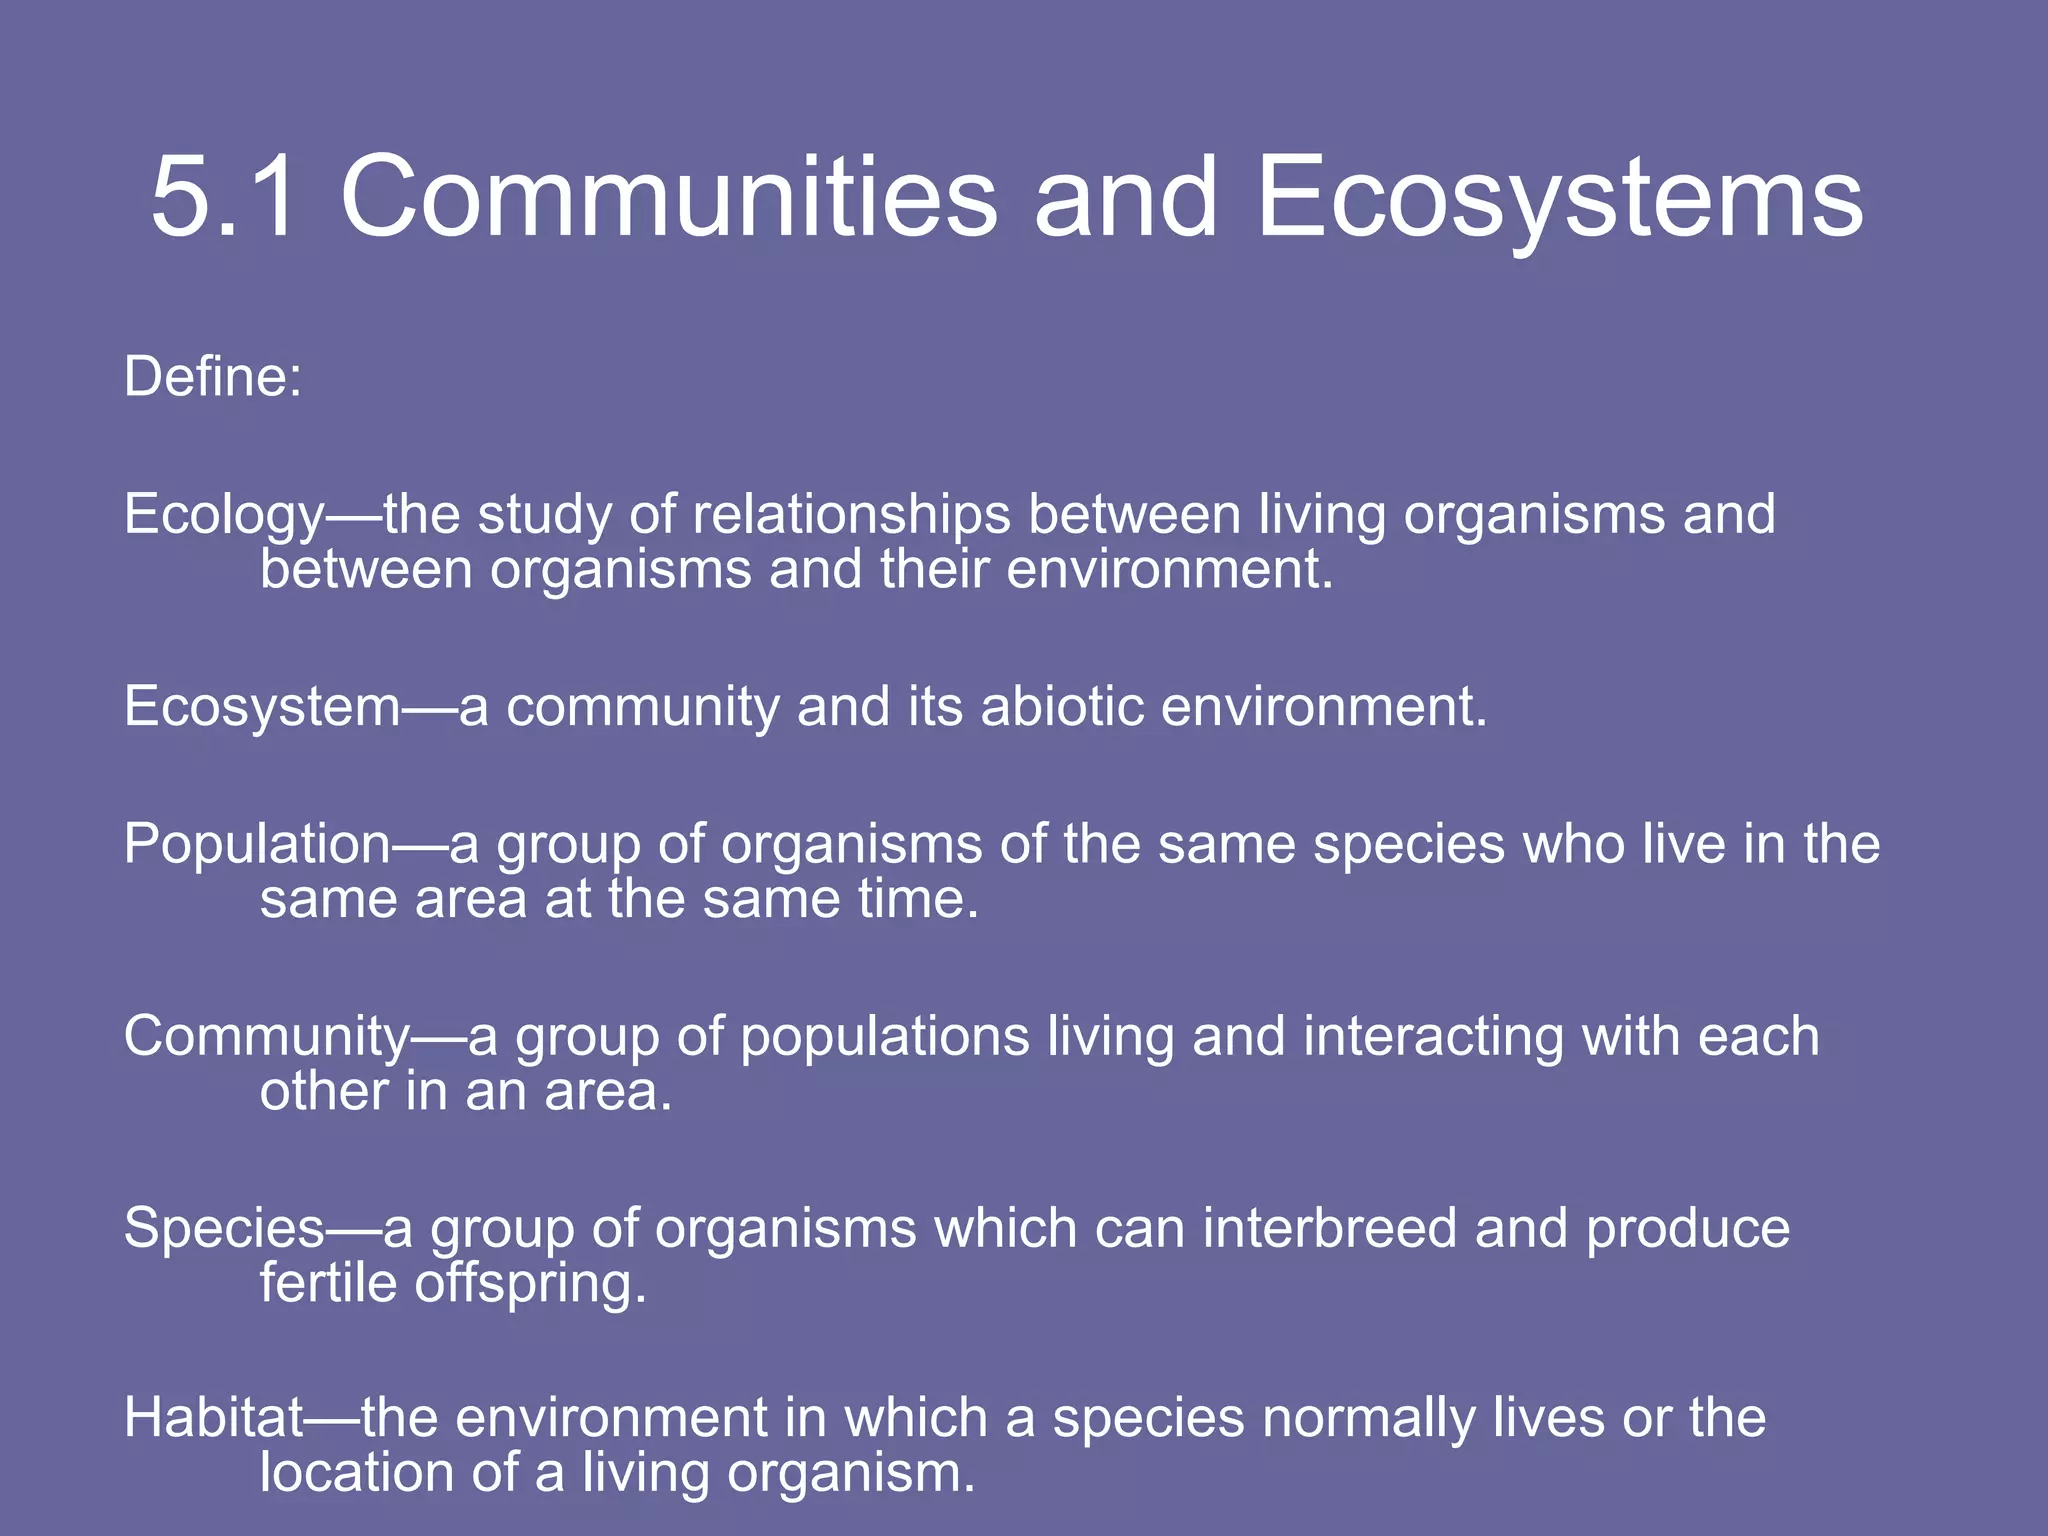
Topic 5 – Ecology & Evolution
5.1 Communities and Ecosystems
Define:
Ecology—the study of relationships between living organisms and
between organisms and their environment.
Ecosystem—a community and its abiotic environment.
Population—a group of organisms of the same species who live in the
same area at the same time.
Community—a group of populations living and interacting with each
other in an area.
Species—a group of organisms which can interbreed and produce
fertile offspring.
Habitat—the environment in which a species normally lives or the
location of a living organism.
5.1 Communities and Ecosystems
5.1.2
autotroph (producer) – organisms that use
an external energy source to produce
organic matter from inorganic raw
materials
Examples: trees, plants, algae, blue-green
bacteria
5.1 Communities and Ecosystems
heterotroph (consumer) – organisms that
use the energy in organic matter,
obtained from other organisms
Three Types:
1. consumers
2. detritivores
3. saprotrophs
5.1 Communities and Ecosystems
1. Consumers – feed on other living things
2. Detritivores – feed on dead organic
matter by ingesting it
3. Saprotrophs (decomposers) – feed on
dead organic material by secreting
digestive enzymes into it and absorbing
the products
5.1 Communities and Ecosystems
5.1.4
Describe what is meant by a food chain
giving three examples, each with at least
three linkages (four organisms).
A food chain is a sequence of relationships
between trophic levels where each
member feeds on the previous one.
5.1 Communities and Ecosystems
5.1.5
Describe what is meant by a food web.
A food web is a a diagram that shows the
feeding relationships in a community. The
arrows indicate the direction of energy
flow.
5.1 Communities and Ecosystems
5.1.6
Define trophic level.
A trophic level is where an organism is
positioned on a food web.
Producer
Primary consumer
Secondary consumer
Tertiary consumer
5.1 Communities and Ecosystems
5.1.7
Deduce the trophic level of organisms in a
food chain and a food web. (3)
• The student should be able to place an
organism at the level of producer, primary
consumer, secondary consumer etc, as
the terms herbivore and carnivore are not
always applicable.
5.1 Communities and Ecosystems
5.1.8
Construct a food web containing up to 10
organisms, using appropriate information.
5.1 Communities and Ecosystems
5.1.9
State that light is the initial energy source for
almost all communities.
• xref- Photosynthesis
5.1 Communities and Ecosystems
5.1.10
Explain the energy flow in a food chain.
• Energy losses between trophic levels
include material not consumed or material
not assimilated, and heat loss through cell
respiration.
5.1 Communities and Ecosystems
5.1.11
State that when energy transformations take
place, the process is never 100% efficient
5.1 Communities and Ecosystems
5.1.12
Explain reasons for the shape of pyramids
of energy.
• A pyramid of energy shows the flow of
energy from one trophic level to the next in
a community. The units of pyramids of
energy are therefore energy per unit area
per unit time, e.g. KJ m-2 yr-1
5.1 Communities and Ecosystems
5.1.13
Explain that energy enters and leaves ecosystems,
but nutrients must be recycled.
Energy enters as light and usually leaves as heat.
Nutrients do not usually enter an ecosystem and
must be used again and again (nutrient cycles).
Nutrients can be substances such as Carbon
dioxide, Nitrogen, and Phosphorus
Key processes in the Carbon cycle
•
•
•
•
•

Combustion
Cell respiration
Photosynthesis
Fossilisation
Interaction between living organisms
The layers of
the
atmosphere
The troposphere is the part of the
atmosphere in the biosphere
The stratosphere contains the
ozone layer
The stratosphere is also a zone of
warm air that keeps a lid on the
troposphere. It does not mix with
the upper atmosphere

© Text 2007 Paul Billiet ODWS

© Windows to the Universe
The Greenhouse Effect
• Earth has a natural greenhouse effect
• This is important to prevent large
fluctuations in temperature
• Without a greenhouse effect on Earth, we
would not have life as we know it.
Greenhouse Effect
Light from the sun has short wavelengths
and can pass through most of the
atmosphere.
This sunlight warms the Earth which in turn
emits long wave radiation.
This long wave radiation is bounced back by
the greenhouse gases, such as carbon
dioxide, methane, CFCs, water vapour,
and sulphur dioxide
The Greenhouse Effect
• The molecules of some gases in the
atmosphere absorb heat energy and
retain it
• This can be a good thing
• Without an atmosphere the Earth would
have same temperature as the moon
• Moon mean surface temperature -46°C
• Moon temperature range: -233 to +123°C
© 2007 Paul Billiet ODWS
The Greenhouse Gases
• H2O vapour
• CO2
• CH4
• NOx
• CFC
© Oceanworld 2005 Robert R Stewart

© Text 2007 Paul Billiet ODWS
The Greenhouse Gases

• Water vapour in the atmosphere is stable
• The atmosphere is saturated
• CO2 levels are currently rising
• They have varied in the past
• Methane levels are increasing:
as more cattle are farmed, as more paddy
fields are planted, as permafrost melts
• NOx levels increase due to increased
circulation of motor vehicles
© 2007 Paul Billiet ODWS
Mauna Loa Observatory

© Mauna Loa Observatory Site

© Earth

System Research Laboratory
© Earth System Research Laboratory
Carbon dioxide a greenhouse
gas

© Mauna Loa Observatory Site
South Pole Data
Samoa data
© Australian Antarctic Division

© New Scientist : Environment
Levels during the last ice age

© Dennis Hartmann: Universoty of Washington: Department of Atmospheric Sciences
Out of the ice age
Since the Industrial
Revolution

Concentration of Carbon Dioxide from trapped air measurements for the DE08 ice core near the summit
of Law Dome, Antarctica. (Data measured by CSIRO Division of Atmospheric Research from ice cores supplied by
Australian Antarctic Division)
Is it really getting warmer

1979
© NASA

2003
5.2

The ENHANCED greenhouse
effect

Phenomenon
The mean global temperature has
risen about 1 degree Celsius since
1856. We saw an increase
between 1910 and 1940, and from
1970 onwards.
5.2

Enhancing the greenhouse
Effect

Human Activities
• Increased burning of fossil fuels releasing greenhouse
gases (CO2, oxides of Nitrogen)
• Deforestation – less trees to convert CO2 back to O2
• Raising cattle and paddy fields release methane
• CFCs were used as a propellant in aerosols and as a
coolant in refrigerators, freezers and air conditioning
units. Old cooling machinery can still leak CFCs and
need to be disposed of carefully – CFCs are persistent
• Other industrial activities that release other
greenhouse gases
The Precautionary Principle
• The precautionary principle holds that, if the
effects of a human-induced change would be
very large, perhaps catastrophic, those
responsible for the change must prove that it
will not do harm before proceeding.
• This is the reverse of the normal situation where
those who are concerned about the change
would have to prove that it will do harm in order
to prevent such changes going ahead.
Evaluate the precautionary
principle…
• …..as a justification for strong action in response to the
threats posed by the enhanced greenhouse effect
• Economic harm Vs harm to environment for future
generations
• Should the health and wealth of future generations be
jeapardised?
• Is it right to knowingly damage the habitat of species
other than humans? Cause extinction?
• Need for international cooperation
• Inequality between those contributing most to the harm,
and those who will be most harmed
The consequences
• Sea level rise

Changing sea ice...
• Flooding coastal areas
Reduced agricultural land
Displacement of populations
• Climate change and changing weather patterns
• Displacement of ecosystems
Change in range of insect vectors of pathogens
Reduced biodiversity
© 2007 Paul Billiet ODWS
The consequences
• Increased rates of photosynthesis
• Increased agricultural production at high
latitudes
• BUT faster growth means:
less protein in cereals
trees taller and more exposed to storm
damage

© 2007 Paul Billiet ODWS
•
•
•
•

Knock-on effects

Increased temperature melts the permafrost
Frozen plant remains decompose
More methane released
Similarly soils will lose organic carbon (humus)
more rapidly in a warmer climate
• Ice caps melt more sea exposed
• Snow reflects light (high albedo)
• Water absorbs light, increases warming
• More CO2 dissolving in water lowers pH
• Currently this is buffered and remains stable
• Eventually pH will drop sea life will die CO2
© 2007 Paul Billiet ODWS as organisms decompose
produced
What can be done?
Reduce carbon emissions
• Improve mass transport systems (public
transport)
• Design more efficient motors
• Design alternative power sources
• Hydrogen powered motors
BUT problems of fuel reservoir, delivery,
fabrication
• Renewable energy (wind, tidal, hydro,
geothermal, biomass)
BUT growing crops for biofuel reduces farmland
available for food
Hydroelectric dams disrupt river ecosystems
•© 2007 Paul Billiet ODWS
Nuclear power
What can be done?
Increase natural CO2 sequestering
• Reduce deforestation
• Increase reforestation

© 2007 Paul Billiet ODWS
What can be done?
Artificial CO2 sequestering
• Filter CO2 sources using hydroxide
scrubbers
• Injection of CO2 into deep ocean layers
Forms CO2 reservoirs
Impact on sea life unknown
• Injecting CO2 into disused oil wells
• Mineral deposition as carbonates
© 2007 Paul Billiet ODWS
The bottom line
Two factors will ultimately govern what happens:
1. Human population growth
More people means greater demand for nonrenewable resources
2. The ecological footprint of each individual
human
Higher standards of living usually means higher
consumption of fossil fuels
The planet will look after itself in the end
There are plenty of examples where human
communities have disappeared because they
outstripped the environmental resources
© 2007 Paul Billiet ODWS
The planet will look after itself in
the end
• Easter Island (Rapanui) in
the Pacific
• Settled between AD900 and
1200
• Community in severe
decline AD 1700
• Cause: excessive
deforestation
The Moai statues, Easter Island © Martin Gray, World Mysteries
© Text 2007 Paul Billiet ODWS
The planet will look after itself in
the end
• Chaco Canyon, New
Mexico
• Anasazi culture
• AD 850 – 1250
• Cause: Deforestation
combined with a
decline in rainfall
© New Mexico Tourism Department

© Text 2007 Paul Billiet ODWS
The planet will look after itself in
the end
•
•
•
•

Mesopotamia
Sumerian civilization
3100 – 1200 BC
Increased salt levels
in soil due to irrigation
systems & arid
environment
• Reduced food yield

© Text 2007 Paul Billiet ODWS

© Asociación Cultural Nueva Acrópolis en Barcelona
The planet will look after itself in
the end
•
•
•
•

Greenland
Viking colony
AD982 – 1350
Cause: Deforestation,
soil degradation &
cooling of the climate
© Emporia State University

© Text 2007 Paul Billiet ODWS
Who’s next?

forumpolitics.com/pics/earth-photo.jpg

© NASA
5.3

Populations

5.3.1
Outline how population size is affected by
natality, immigration, mortality and
emigration.
5.3 Populations
• Natality – offspring are produced and
added to the population
• Mortality – individuals die and are lost
from the population
• Immigration – individuals move into the
area from somewhere else and add to the
population
• Emigration – individuals move out of the
area and are lost from the population
5.3

Populations

5.3.2
Draw a graph showing
the sigmoid (Sshaped) population
growth curve.
5.3 Populations
5.3.3
Explain reasons for the exponential growth
phase, the plateau phase and the
transitional phase between these two
phases.
5.3 Populations
Exponential Phase
Population increases exponentially because
the natality rate is higher than the mortality
rate. This is because there is an
abundance of food, and disease and
predators are rare.
5.3 Populations
Transitional Phase
Difference between natality and mortality
rates are not as great, but natality is still
higher so population continues to grow,
but at a slower rate.
Food is no longer as abundant due to the
increase in the population size. May also
be increase predation and disease.
5.3 Populations
Plateau Phase
Natality and mortality are equal so the population
size stays constant.
Limiting Factors:
• shortage of food or other resources
• increase in predators
• more diseases or parasites
If a population is limited, then it has reached its
carrying capacity
5.3 Populations
Carrying capacity
The maximum population size that can be
supported by the environment
5.3 Populations
5.3.4
List three factors which set limits to
population increase.
Limiting Factors:
1. shortage of food or other resources
2. Increase in predators
3. More diseases or parasites
5.4 Evolution
5.4.1
Define Evolution—the process of cumulative
change in the heritable characteristics of a
population.
Macroevolution – the change from one species to
another. i.e. – reptiles to birds
Microevolution – the change from one variation
within a species to another. i.e. – a Chihuahua
and a Great Dane
5.4 Evolution
Evidence for evolution….
• Fossil record
• Selective breeding of domesticated
animals
• Homologous structures
The Fossil Record
• Darwin first collected convincing evidence for biological
evolution
• Earlier scholars had recognised that organisms on Earth had
changed systematically over long periods of time.
• Because bottom layers of rock logically were laid down earlier
and thus are older than top layers, the sequence of fossils also
could be given a chronology from oldest to youngest.
• Today, many thousands of ancient rock deposits have been
identified that show corresponding successions of fossil
organisms.
• Hundreds of thousands of fossil organisms, found in well-dated
rock sequences, represent successions of forms through time
and manifest many evolutionary transitions.
Life Form

•
•
•
•
•
•
•
•
•
•
•
•

Microbial (procaryotic cells)
Complex (eucaryotic cells)
First multicellular animals
Shell-bearing animals
Vertebrates (simple fishes)
Amphibians
Reptiles
Mammals
Nonhuman primates
Earliest apes
Ancestors of humans
Modern humans

Millions of Years
Since First Known
Appearance
3,500
2,000
670
540
490
350
310
200
60
25
4
150,000 years
Archaeopteryx
Selective breeding
Homologous structures
•

Inferences about common descent are reinforced by
comparative anatomy. For example, the skeletons of
humans, mice, and bats are strikingly similar, despite the
different ways of life of these animals and the diversity of
environments in which they flourish.

• The correspondence of these animals, bone by bone, can
be observed in every part of the body, including the limbs;
yet a person writes, a mouse runs, and a bat flies with
structures built of bones that are different in detail but
similar in general structure and relation to each other.
•

Scientists call such structures homologous structures
and have concluded that they are best explained by
common descent.
The pentadactyl limb
5.4 Evolution
5.4.3
Populations tend to produce more offspring
than the environment can support.
5.4 Evolution
5.4.4
• The consequence of the potential
overproduction of offspring is a struggle
for survival.

• More offspring are produced than can be
supported, therefore there is a struggle to
survive, where some live and some die.
5.4 Evolution
5.4.5

Members of a
species show
variation.
5.4 Evolution
5.4
Explain how sexual reproduction promotes
variation in a species.
• Independent assortment
• Crossing over
• Random fertilisation
• Mate selection
Natural selection – the mechanism
of evolution
• Since organism’s traits vary, some
organisms are more adapted to survival
than others.
• When there is a struggle to survive those
with favorable traits tend to survive long
enough to pass them on.
• Those that have less favorable traits die
before being able to pass the traits on.
5.4 Evolution
5.4.7
Explain how natural
selection leads to
evolution
• The Darwin–Wallace
theory is accepted by
most as the origin of
ideas about evolution
by means of natural
selection
•

1854 - Wallace left Britain on a collecting expedition to the Malay
Archipelago (now Malaysia and Indonesia). He spent nearly eight years
in the region collecting almost 110,000 insects, 7500 shells, 8050 bird
skins, and 410 mammal and reptile specimens, including over a
thousand species new to science; some of his specimens can be seen
in the Sarawak museum.

•

His best known discoveries are probably Wallace's Golden Birdwing
Butterfly Ornithoptera croesus

•

The book he wrote describing his work and experiences, The Malay
Archipelago, is the most celebrated of all travel writings on this region,
and ranks with a few other works as one of the best scientific travel
books of the nineteenth century.
• In February 1855, whilst staying in Sarawak,
Wallace wrote what was to become one of the
most important papers on evolution.
• Wallace's "Sarawak Law" paper made a big
impression on the famous geologist Charles
Lyell.
• Soon after Darwin had explained his theory of
natural selection to Lyell (during a visit he
made to Down House in April 1856) Lyell sent
a letter to Darwin urging him to publish the
theory lest someone beat him to it.
• Darwin began to write On the Origin of
Species.
•
•
•

•

•

•

1858 - the idea of natural selection as the
mechanism of evolutionary change
occurred to Wallace .
He wrote out his ideas in full and sent them
off to Charles Darwin, who he thought
might be interested.
Unknown to Wallace, Darwin had in fact
discovered natural selection about 20 years
earlier, and was part way through writing
his "big book" on the subject.
Darwin was therefore horrified when he
received Wallace's letter, and appealed to
his influential friends Charles Lyell and
Joseph Hooker for advice on what to do.
Lyell and Hooker presented Wallace's
essay, along with two excerpts from
Darwin's writings on the subject, to a
meeting of the Linnean Society of London
in July 1858.
These documents were published together
in the Society's journal on 20 August of the
same year as the paper
5.4 Evolution
5.4.8
Explain two examples of evolution in
response to environmental change; one
must be multiple antibiotic resistance in
bacteria…..
Evolution in bacteria
and the peppered moth (Biston betularia) is
another good example!.....
Example 1:’Peppered Moth’
Example 2:Resistance to
antibiotics in bacteria.
• If a culture of bacteria (eg.within a sick patient) is treated
with antibiotics, Most of the bacteria are killed. A small
number that naturally have genes resistant to antibiotics
will survive.
• It is important to note that these bacteria did not "learn" to
resist antibiotics. These bacteria have mutated genes that
somehow allowed them to resist antibiotics.
• These surviving bacteria will reproduce and pass on their
resistant genes. Natural Selection “chose” the antibiotic
resistant ones because the rest of bacterial population is
killed by the antibiotic.
• These surviving Mutant bacteria can become a problem
when trying to kill a bacterial infection in a patient, because
if the bacterium is resistant to the antibiotics given, then it
can't be killed.
• Someone has to come up with a new antibiotic that it is not
resistant to, which can be a difficult expensive process
5.5 Classification
5.5.1
Outline the binomial system of nomenclature
(also referred to as a scientific name)
Swedish botanist, Carolus Linnaeus (17071778)
Internationally recognised name for each
species
5.5 Classification
Rules for binomial nomenclature:
1. The first name is the Genus name
2. The Genus name is CAPITALISED
3. The second name is the species name
4. The species name is not capitalised
5. Italics are used if the name is printed
6. The name is underlined if handwritten
Homo sapiens, Panthera leo, etc.
5.5 Classification
5.5.2
List the seven levels in the hierarchy of taxa
- use an example from two different
kingdoms for each level.
Blue Whale

o

!
n
w
o
r

Animalia
Chordata
Mammalia
Cetacea
Balaenopteridae
Balaenoptera
musculus

m
r

k
a

u
o
y
e

Plantae
Coniferophyta
Pinopsida
Pinales
Taxodiaceae
Sequoia
sempervirens

Gross Sometimes

Kingdom
Phylum
Class
Order
Family
Genus
Species

Coast Redwood

Kings Play Chess On Folding Glass Stools

Kissing Pretty Cute Otter Feels

King Phillip Came Over For Good Soup
Bryophyta – mosses and liverworts
(0.5m)
• No roots, just rhizoids
• Small
• Spores produced in capsules
Mosses have simple
leaves and stems

Liverworts have
a flattened “thallus”
Filicinophyta – ferns (<15m)
•
•

Roots, leaves and short (non-woody)stems
Pinnate leaves

•

Curled up in buds

•

Spores in sporangia (underside of leaves)
shallow roots
Coniferophyta – conifers (100m)
• Shrubs or trees with roots, leaves and woody
stems

• Produce seeds in female cones
(Male cones  pollen)
Angiospermatophyta – flowering
plants (100m)
• Roots, stems and leaves
• If shrubs or trees, woody stems
• Produce seeds inside ovaries.
Fruits develop from
ovaries, to disperse
seeds
Porifera (sponges)
• Poriferans don't have mouths;
instead, they have tiny pores in
their outer walls through which
water is drawn.
Cnidaria (corals, anemones and jellyfish)
• Single opening to stomach, that functions as both
mouth and anus
• It has radial symmetry
• Armed with stinging cells called nematocysts.
Platyhelminths (flatworms)
• Bilaterally
symmetrical
• Triploblastic
(composed of three
fundamental cell
layers)
• no body cavity other
than the gut and lack
an anus
Annelida (segmented worms)
• Segmented, long body
• Mouth and anus
Mollusca
• The body has a head, a
foot and a visceral mass,
covered with a mantle
that typically secretes the
shell.
• The buccal cavity, at the
anterior of the mollusc,
contains a radula — a
ribbon of teeth
• The ventral foot is used in
locomotion.
• Molluscs are coelomate.
Arthropoda
• Exoskeleton made of chitin (may be
strengthened with calcium carbonate)
• Jointed limbs
Design a dichotomous key for 8
organisms

Topic 5 ecology & evolution

  • 1.
    Topic 5 –Ecology & Evolution
  • 2.
    5.1 Communities andEcosystems Define: Ecology—the study of relationships between living organisms and between organisms and their environment. Ecosystem—a community and its abiotic environment. Population—a group of organisms of the same species who live in the same area at the same time. Community—a group of populations living and interacting with each other in an area. Species—a group of organisms which can interbreed and produce fertile offspring. Habitat—the environment in which a species normally lives or the location of a living organism.
  • 3.
    5.1 Communities andEcosystems 5.1.2 autotroph (producer) – organisms that use an external energy source to produce organic matter from inorganic raw materials Examples: trees, plants, algae, blue-green bacteria
  • 4.
    5.1 Communities andEcosystems heterotroph (consumer) – organisms that use the energy in organic matter, obtained from other organisms Three Types: 1. consumers 2. detritivores 3. saprotrophs
  • 5.
    5.1 Communities andEcosystems 1. Consumers – feed on other living things 2. Detritivores – feed on dead organic matter by ingesting it 3. Saprotrophs (decomposers) – feed on dead organic material by secreting digestive enzymes into it and absorbing the products
  • 6.
    5.1 Communities andEcosystems 5.1.4 Describe what is meant by a food chain giving three examples, each with at least three linkages (four organisms). A food chain is a sequence of relationships between trophic levels where each member feeds on the previous one.
  • 7.
    5.1 Communities andEcosystems 5.1.5 Describe what is meant by a food web. A food web is a a diagram that shows the feeding relationships in a community. The arrows indicate the direction of energy flow.
  • 8.
    5.1 Communities andEcosystems 5.1.6 Define trophic level. A trophic level is where an organism is positioned on a food web. Producer Primary consumer Secondary consumer Tertiary consumer
  • 9.
    5.1 Communities andEcosystems 5.1.7 Deduce the trophic level of organisms in a food chain and a food web. (3) • The student should be able to place an organism at the level of producer, primary consumer, secondary consumer etc, as the terms herbivore and carnivore are not always applicable.
  • 10.
    5.1 Communities andEcosystems 5.1.8 Construct a food web containing up to 10 organisms, using appropriate information.
  • 11.
    5.1 Communities andEcosystems 5.1.9 State that light is the initial energy source for almost all communities. • xref- Photosynthesis
  • 12.
    5.1 Communities andEcosystems 5.1.10 Explain the energy flow in a food chain. • Energy losses between trophic levels include material not consumed or material not assimilated, and heat loss through cell respiration.
  • 13.
    5.1 Communities andEcosystems 5.1.11 State that when energy transformations take place, the process is never 100% efficient
  • 14.
    5.1 Communities andEcosystems 5.1.12 Explain reasons for the shape of pyramids of energy. • A pyramid of energy shows the flow of energy from one trophic level to the next in a community. The units of pyramids of energy are therefore energy per unit area per unit time, e.g. KJ m-2 yr-1
  • 15.
  • 16.
  • 17.
    5.1 Communities andEcosystems 5.1.13 Explain that energy enters and leaves ecosystems, but nutrients must be recycled. Energy enters as light and usually leaves as heat. Nutrients do not usually enter an ecosystem and must be used again and again (nutrient cycles). Nutrients can be substances such as Carbon dioxide, Nitrogen, and Phosphorus
  • 19.
    Key processes inthe Carbon cycle • • • • • Combustion Cell respiration Photosynthesis Fossilisation Interaction between living organisms
  • 20.
    The layers of the atmosphere Thetroposphere is the part of the atmosphere in the biosphere The stratosphere contains the ozone layer The stratosphere is also a zone of warm air that keeps a lid on the troposphere. It does not mix with the upper atmosphere © Text 2007 Paul Billiet ODWS © Windows to the Universe
  • 21.
    The Greenhouse Effect •Earth has a natural greenhouse effect • This is important to prevent large fluctuations in temperature • Without a greenhouse effect on Earth, we would not have life as we know it.
  • 23.
    Greenhouse Effect Light fromthe sun has short wavelengths and can pass through most of the atmosphere. This sunlight warms the Earth which in turn emits long wave radiation. This long wave radiation is bounced back by the greenhouse gases, such as carbon dioxide, methane, CFCs, water vapour, and sulphur dioxide
  • 24.
    The Greenhouse Effect •The molecules of some gases in the atmosphere absorb heat energy and retain it • This can be a good thing • Without an atmosphere the Earth would have same temperature as the moon • Moon mean surface temperature -46°C • Moon temperature range: -233 to +123°C © 2007 Paul Billiet ODWS
  • 25.
    The Greenhouse Gases •H2O vapour • CO2 • CH4 • NOx • CFC © Oceanworld 2005 Robert R Stewart © Text 2007 Paul Billiet ODWS
  • 26.
    The Greenhouse Gases •Water vapour in the atmosphere is stable • The atmosphere is saturated • CO2 levels are currently rising • They have varied in the past • Methane levels are increasing: as more cattle are farmed, as more paddy fields are planted, as permafrost melts • NOx levels increase due to increased circulation of motor vehicles © 2007 Paul Billiet ODWS
  • 27.
    Mauna Loa Observatory ©Mauna Loa Observatory Site © Earth System Research Laboratory © Earth System Research Laboratory
  • 28.
    Carbon dioxide agreenhouse gas © Mauna Loa Observatory Site
  • 29.
  • 30.
  • 31.
    © Australian AntarcticDivision © New Scientist : Environment
  • 32.
    Levels during thelast ice age © Dennis Hartmann: Universoty of Washington: Department of Atmospheric Sciences
  • 33.
    Out of theice age
  • 34.
    Since the Industrial Revolution Concentrationof Carbon Dioxide from trapped air measurements for the DE08 ice core near the summit of Law Dome, Antarctica. (Data measured by CSIRO Division of Atmospheric Research from ice cores supplied by Australian Antarctic Division)
  • 35.
    Is it reallygetting warmer 1979 © NASA 2003
  • 36.
    5.2 The ENHANCED greenhouse effect Phenomenon Themean global temperature has risen about 1 degree Celsius since 1856. We saw an increase between 1910 and 1940, and from 1970 onwards.
  • 37.
    5.2 Enhancing the greenhouse Effect HumanActivities • Increased burning of fossil fuels releasing greenhouse gases (CO2, oxides of Nitrogen) • Deforestation – less trees to convert CO2 back to O2 • Raising cattle and paddy fields release methane • CFCs were used as a propellant in aerosols and as a coolant in refrigerators, freezers and air conditioning units. Old cooling machinery can still leak CFCs and need to be disposed of carefully – CFCs are persistent • Other industrial activities that release other greenhouse gases
  • 38.
    The Precautionary Principle •The precautionary principle holds that, if the effects of a human-induced change would be very large, perhaps catastrophic, those responsible for the change must prove that it will not do harm before proceeding. • This is the reverse of the normal situation where those who are concerned about the change would have to prove that it will do harm in order to prevent such changes going ahead.
  • 39.
    Evaluate the precautionary principle… •…..as a justification for strong action in response to the threats posed by the enhanced greenhouse effect • Economic harm Vs harm to environment for future generations • Should the health and wealth of future generations be jeapardised? • Is it right to knowingly damage the habitat of species other than humans? Cause extinction? • Need for international cooperation • Inequality between those contributing most to the harm, and those who will be most harmed
  • 40.
    The consequences • Sealevel rise Changing sea ice... • Flooding coastal areas Reduced agricultural land Displacement of populations • Climate change and changing weather patterns • Displacement of ecosystems Change in range of insect vectors of pathogens Reduced biodiversity © 2007 Paul Billiet ODWS
  • 41.
    The consequences • Increasedrates of photosynthesis • Increased agricultural production at high latitudes • BUT faster growth means: less protein in cereals trees taller and more exposed to storm damage © 2007 Paul Billiet ODWS
  • 42.
    • • • • Knock-on effects Increased temperaturemelts the permafrost Frozen plant remains decompose More methane released Similarly soils will lose organic carbon (humus) more rapidly in a warmer climate • Ice caps melt more sea exposed • Snow reflects light (high albedo) • Water absorbs light, increases warming • More CO2 dissolving in water lowers pH • Currently this is buffered and remains stable • Eventually pH will drop sea life will die CO2 © 2007 Paul Billiet ODWS as organisms decompose produced
  • 43.
    What can bedone? Reduce carbon emissions • Improve mass transport systems (public transport) • Design more efficient motors • Design alternative power sources • Hydrogen powered motors BUT problems of fuel reservoir, delivery, fabrication • Renewable energy (wind, tidal, hydro, geothermal, biomass) BUT growing crops for biofuel reduces farmland available for food Hydroelectric dams disrupt river ecosystems •© 2007 Paul Billiet ODWS Nuclear power
  • 44.
    What can bedone? Increase natural CO2 sequestering • Reduce deforestation • Increase reforestation © 2007 Paul Billiet ODWS
  • 45.
    What can bedone? Artificial CO2 sequestering • Filter CO2 sources using hydroxide scrubbers • Injection of CO2 into deep ocean layers Forms CO2 reservoirs Impact on sea life unknown • Injecting CO2 into disused oil wells • Mineral deposition as carbonates © 2007 Paul Billiet ODWS
  • 46.
    The bottom line Twofactors will ultimately govern what happens: 1. Human population growth More people means greater demand for nonrenewable resources 2. The ecological footprint of each individual human Higher standards of living usually means higher consumption of fossil fuels The planet will look after itself in the end There are plenty of examples where human communities have disappeared because they outstripped the environmental resources © 2007 Paul Billiet ODWS
  • 47.
    The planet willlook after itself in the end • Easter Island (Rapanui) in the Pacific • Settled between AD900 and 1200 • Community in severe decline AD 1700 • Cause: excessive deforestation The Moai statues, Easter Island © Martin Gray, World Mysteries © Text 2007 Paul Billiet ODWS
  • 48.
    The planet willlook after itself in the end • Chaco Canyon, New Mexico • Anasazi culture • AD 850 – 1250 • Cause: Deforestation combined with a decline in rainfall © New Mexico Tourism Department © Text 2007 Paul Billiet ODWS
  • 49.
    The planet willlook after itself in the end • • • • Mesopotamia Sumerian civilization 3100 – 1200 BC Increased salt levels in soil due to irrigation systems & arid environment • Reduced food yield © Text 2007 Paul Billiet ODWS © Asociación Cultural Nueva Acrópolis en Barcelona
  • 50.
    The planet willlook after itself in the end • • • • Greenland Viking colony AD982 – 1350 Cause: Deforestation, soil degradation & cooling of the climate © Emporia State University © Text 2007 Paul Billiet ODWS
  • 51.
  • 52.
    5.3 Populations 5.3.1 Outline how populationsize is affected by natality, immigration, mortality and emigration.
  • 53.
    5.3 Populations • Natality– offspring are produced and added to the population • Mortality – individuals die and are lost from the population • Immigration – individuals move into the area from somewhere else and add to the population • Emigration – individuals move out of the area and are lost from the population
  • 54.
    5.3 Populations 5.3.2 Draw a graphshowing the sigmoid (Sshaped) population growth curve.
  • 56.
    5.3 Populations 5.3.3 Explain reasonsfor the exponential growth phase, the plateau phase and the transitional phase between these two phases.
  • 58.
    5.3 Populations Exponential Phase Populationincreases exponentially because the natality rate is higher than the mortality rate. This is because there is an abundance of food, and disease and predators are rare.
  • 59.
    5.3 Populations Transitional Phase Differencebetween natality and mortality rates are not as great, but natality is still higher so population continues to grow, but at a slower rate. Food is no longer as abundant due to the increase in the population size. May also be increase predation and disease.
  • 60.
    5.3 Populations Plateau Phase Natalityand mortality are equal so the population size stays constant. Limiting Factors: • shortage of food or other resources • increase in predators • more diseases or parasites If a population is limited, then it has reached its carrying capacity
  • 61.
    5.3 Populations Carrying capacity Themaximum population size that can be supported by the environment
  • 63.
    5.3 Populations 5.3.4 List threefactors which set limits to population increase. Limiting Factors: 1. shortage of food or other resources 2. Increase in predators 3. More diseases or parasites
  • 64.
    5.4 Evolution 5.4.1 Define Evolution—theprocess of cumulative change in the heritable characteristics of a population. Macroevolution – the change from one species to another. i.e. – reptiles to birds Microevolution – the change from one variation within a species to another. i.e. – a Chihuahua and a Great Dane
  • 65.
    5.4 Evolution Evidence forevolution…. • Fossil record • Selective breeding of domesticated animals • Homologous structures
  • 66.
    The Fossil Record •Darwin first collected convincing evidence for biological evolution • Earlier scholars had recognised that organisms on Earth had changed systematically over long periods of time. • Because bottom layers of rock logically were laid down earlier and thus are older than top layers, the sequence of fossils also could be given a chronology from oldest to youngest. • Today, many thousands of ancient rock deposits have been identified that show corresponding successions of fossil organisms. • Hundreds of thousands of fossil organisms, found in well-dated rock sequences, represent successions of forms through time and manifest many evolutionary transitions.
  • 67.
    Life Form • • • • • • • • • • • • Microbial (procaryoticcells) Complex (eucaryotic cells) First multicellular animals Shell-bearing animals Vertebrates (simple fishes) Amphibians Reptiles Mammals Nonhuman primates Earliest apes Ancestors of humans Modern humans Millions of Years Since First Known Appearance 3,500 2,000 670 540 490 350 310 200 60 25 4 150,000 years
  • 68.
  • 69.
  • 70.
    Homologous structures • Inferences aboutcommon descent are reinforced by comparative anatomy. For example, the skeletons of humans, mice, and bats are strikingly similar, despite the different ways of life of these animals and the diversity of environments in which they flourish. • The correspondence of these animals, bone by bone, can be observed in every part of the body, including the limbs; yet a person writes, a mouse runs, and a bat flies with structures built of bones that are different in detail but similar in general structure and relation to each other. • Scientists call such structures homologous structures and have concluded that they are best explained by common descent.
  • 71.
  • 72.
    5.4 Evolution 5.4.3 Populations tendto produce more offspring than the environment can support.
  • 73.
    5.4 Evolution 5.4.4 • Theconsequence of the potential overproduction of offspring is a struggle for survival. • More offspring are produced than can be supported, therefore there is a struggle to survive, where some live and some die.
  • 74.
    5.4 Evolution 5.4.5 Members ofa species show variation.
  • 75.
    5.4 Evolution 5.4 Explain howsexual reproduction promotes variation in a species. • Independent assortment • Crossing over • Random fertilisation • Mate selection
  • 76.
    Natural selection –the mechanism of evolution • Since organism’s traits vary, some organisms are more adapted to survival than others. • When there is a struggle to survive those with favorable traits tend to survive long enough to pass them on. • Those that have less favorable traits die before being able to pass the traits on.
  • 77.
    5.4 Evolution 5.4.7 Explain hownatural selection leads to evolution • The Darwin–Wallace theory is accepted by most as the origin of ideas about evolution by means of natural selection
  • 78.
    • 1854 - Wallaceleft Britain on a collecting expedition to the Malay Archipelago (now Malaysia and Indonesia). He spent nearly eight years in the region collecting almost 110,000 insects, 7500 shells, 8050 bird skins, and 410 mammal and reptile specimens, including over a thousand species new to science; some of his specimens can be seen in the Sarawak museum. • His best known discoveries are probably Wallace's Golden Birdwing Butterfly Ornithoptera croesus • The book he wrote describing his work and experiences, The Malay Archipelago, is the most celebrated of all travel writings on this region, and ranks with a few other works as one of the best scientific travel books of the nineteenth century.
  • 79.
    • In February1855, whilst staying in Sarawak, Wallace wrote what was to become one of the most important papers on evolution. • Wallace's "Sarawak Law" paper made a big impression on the famous geologist Charles Lyell. • Soon after Darwin had explained his theory of natural selection to Lyell (during a visit he made to Down House in April 1856) Lyell sent a letter to Darwin urging him to publish the theory lest someone beat him to it. • Darwin began to write On the Origin of Species.
  • 80.
    • • • • • • 1858 - theidea of natural selection as the mechanism of evolutionary change occurred to Wallace . He wrote out his ideas in full and sent them off to Charles Darwin, who he thought might be interested. Unknown to Wallace, Darwin had in fact discovered natural selection about 20 years earlier, and was part way through writing his "big book" on the subject. Darwin was therefore horrified when he received Wallace's letter, and appealed to his influential friends Charles Lyell and Joseph Hooker for advice on what to do. Lyell and Hooker presented Wallace's essay, along with two excerpts from Darwin's writings on the subject, to a meeting of the Linnean Society of London in July 1858. These documents were published together in the Society's journal on 20 August of the same year as the paper
  • 81.
    5.4 Evolution 5.4.8 Explain twoexamples of evolution in response to environmental change; one must be multiple antibiotic resistance in bacteria….. Evolution in bacteria and the peppered moth (Biston betularia) is another good example!.....
  • 82.
  • 87.
    Example 2:Resistance to antibioticsin bacteria. • If a culture of bacteria (eg.within a sick patient) is treated with antibiotics, Most of the bacteria are killed. A small number that naturally have genes resistant to antibiotics will survive. • It is important to note that these bacteria did not "learn" to resist antibiotics. These bacteria have mutated genes that somehow allowed them to resist antibiotics. • These surviving bacteria will reproduce and pass on their resistant genes. Natural Selection “chose” the antibiotic resistant ones because the rest of bacterial population is killed by the antibiotic. • These surviving Mutant bacteria can become a problem when trying to kill a bacterial infection in a patient, because if the bacterium is resistant to the antibiotics given, then it can't be killed. • Someone has to come up with a new antibiotic that it is not resistant to, which can be a difficult expensive process
  • 88.
    5.5 Classification 5.5.1 Outline thebinomial system of nomenclature (also referred to as a scientific name) Swedish botanist, Carolus Linnaeus (17071778) Internationally recognised name for each species
  • 89.
    5.5 Classification Rules forbinomial nomenclature: 1. The first name is the Genus name 2. The Genus name is CAPITALISED 3. The second name is the species name 4. The species name is not capitalised 5. Italics are used if the name is printed 6. The name is underlined if handwritten Homo sapiens, Panthera leo, etc.
  • 90.
    5.5 Classification 5.5.2 List theseven levels in the hierarchy of taxa - use an example from two different kingdoms for each level.
  • 91.
  • 92.
    Bryophyta – mossesand liverworts (0.5m) • No roots, just rhizoids • Small • Spores produced in capsules Mosses have simple leaves and stems Liverworts have a flattened “thallus”
  • 93.
    Filicinophyta – ferns(<15m) • • Roots, leaves and short (non-woody)stems Pinnate leaves • Curled up in buds • Spores in sporangia (underside of leaves) shallow roots
  • 94.
    Coniferophyta – conifers(100m) • Shrubs or trees with roots, leaves and woody stems • Produce seeds in female cones (Male cones  pollen)
  • 95.
    Angiospermatophyta – flowering plants(100m) • Roots, stems and leaves • If shrubs or trees, woody stems • Produce seeds inside ovaries. Fruits develop from ovaries, to disperse seeds
  • 96.
    Porifera (sponges) • Poriferansdon't have mouths; instead, they have tiny pores in their outer walls through which water is drawn.
  • 97.
    Cnidaria (corals, anemonesand jellyfish) • Single opening to stomach, that functions as both mouth and anus • It has radial symmetry • Armed with stinging cells called nematocysts.
  • 98.
    Platyhelminths (flatworms) • Bilaterally symmetrical •Triploblastic (composed of three fundamental cell layers) • no body cavity other than the gut and lack an anus
  • 99.
    Annelida (segmented worms) •Segmented, long body • Mouth and anus
  • 100.
    Mollusca • The bodyhas a head, a foot and a visceral mass, covered with a mantle that typically secretes the shell. • The buccal cavity, at the anterior of the mollusc, contains a radula — a ribbon of teeth • The ventral foot is used in locomotion. • Molluscs are coelomate.
  • 101.
    Arthropoda • Exoskeleton madeof chitin (may be strengthened with calcium carbonate) • Jointed limbs
  • 102.
    Design a dichotomouskey for 8 organisms