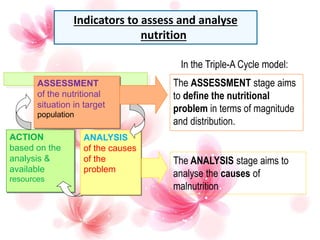
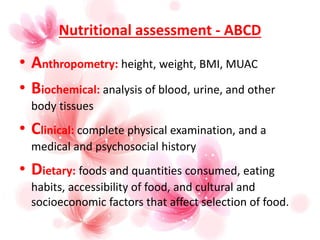
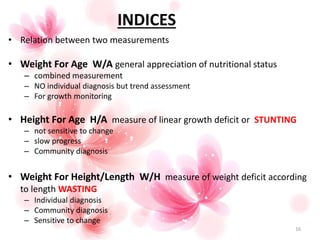
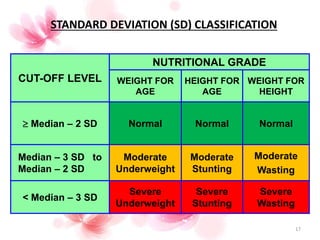
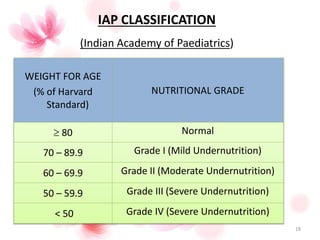
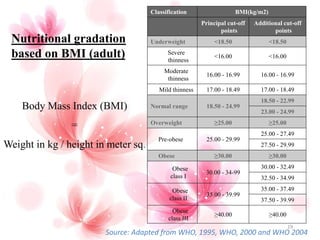
NUTRITIONAL ASSESSMENT
SURVEY
(Anthropometric assessment)
Presented by-
Dr Garima Gupta
MBBS, MD (Post Graduate Resident)
University College of Medical Sciences and GTB Hospital
Delhi
NFHS-3, India, 2005-06
Why the need of Nutritional Assessment?
In the Triple-A Cycle model:
Indicators to assess and analyse
nutrition
The ANALYSIS stage aims to
analyse the causes of
malnutrition
The ASSESSMENT stage aims
to define the nutritional
problem in terms of magnitude
and distribution.
ASSESSMENT
of the nutritional
situation in target
population
ACTION
based on the
analysis &
available
resources
ANALYSIS
of the causes
of the
problem
A Dream
– Yet to be achieved !!
• Source- World Health Organisation
Nutritional assessment - ABCD
• Anthropometry: height, weight, BMI, MUAC
• Biochemical: analysis of blood, urine, and other
body tissues
• Clinical: complete physical examination, and a
medical and psychosocial history
• Dietary: foods and quantities consumed, eating
habits, accessibility of food, and cultural and
socioeconomic factors that affect selection of food.
Anthropometric
measurement
HEIGHT OR LENGTH
• Height
Vertical distance measured from crown of head to bottom of
feet (heels) for children 2 yr of age or older.
• Recumbent length
Distance measured from crown of head to bottom of feet
(heels) while child (< 2 yr of age) is in supine position.
Stadiometer
Infantometer
7
WEIGHT
 Subject must be barefoot and wear
as little clothing as possible.
 Subject stands on the platform of
the scale with his/her weight
distributed evenly over both feet.
 The arms hang by the sides of the
trunk, with palms facing the thighs.
 The subject is instructed to
maintain a stable position while
the measurement is taken
• Gives a picture of past nutritional status
• Deficit in height indicates chronic &
prolonged under nutrition resulting often
in permanently stunted physical status.
Indications of
height/length
• Sensitive indicator of current nutritional
status.
• Deficit in weight indicates short term under
nutrition which can be easily reversed.
• PEM is best identified by weight deficiency
in all groups.
Indications of
weight
Mid-upper arm circumference (MUAC)
MUAC is simple, cheap, more sensitive and less prone to mistakes.
 Appropriate cut-off points of MUAC for children between 6 to 59 months are given below:
Latest recommendations - UNICEF
HEAD CIRCUMFERENCE
• Brain growth takes place 70% during
fetal life, 15% during infancy and
remaining 10% during pre-school years.
• Head circumference are routinely
recorded until 5 years of age.
•The head circumference is measured by
placing the tape over the occipital
protuberance at the back and just over
the supraorbital ridge and the glabella in
front.
12
CHEST CIRCUMFERENCE
• It is usually measured at the level of nipples,
preferably in mid inspiration.
• In children
≤ 5years - lying down position
> 5 years - standing position
13
RELATIONSHIP BETWEEN HEAD SIZE WITH
CHEST CIRCUMFERENCE
• At birth-
head circumference > chest circumference by up to 3 cm.
• At around 9 months to 1 year of age-
head circumference = chest circumference,
• but thereafter chest grows more rapidly compared to the
brain.
14
15
INDICES
16
• Relation between two measurements
• Weight For Age W/A general appreciation of nutritional status
– combined measurement
– NO individual diagnosis but trend assessment
– For growth monitoring
• Height For Age H/A measure of linear growth deficit or STUNTING
– not sensitive to change
– slow progress
– Community diagnosis
• Weight For Height/Length W/H measure of weight deficit according
to length WASTING
– Individual diagnosis
– Community diagnosis
– Sensitive to change
STANDARD DEVIATION (SD) CLASSIFICATION
CUT-OFF LEVEL
NUTRITIONAL GRADE
WEIGHT FOR
AGE
HEIGHT FOR
AGE
WEIGHT FOR
HEIGHT
 Median – 2 SD Normal Normal Normal
Median – 3 SD to
Median – 2 SD
Moderate
Underweight
Moderate
Stunting
Moderate
Wasting
< Median – 3 SD
Severe
Underweight
Severe
Stunting
Severe
Wasting
17
IAP CLASSIFICATION
(Indian Academy of Paediatrics)
WEIGHT FOR AGE
(% of Harvard
Standard)
NUTRITIONAL GRADE
 80 Normal
70 – 89.9 Grade I (Mild Undernutrition)
60 – 69.9 Grade II (Moderate Undernutrition)
50 – 59.9 Grade III (Severe Undernutrition)
< 50 Grade IV (Severe Undernutrition)
18
Classification BMI(kg/m2)
Principal cut-off
points
Additional cut-off
points
Underweight <18.50 <18.50
Severe
thinness
<16.00 <16.00
Moderate
thinness
16.00 - 16.99 16.00 - 16.99
Mild thinness 17.00 - 18.49 17.00 - 18.49
Normal range 18.50 - 24.99
18.50 - 22.99
23.00 - 24.99
Overweight ≥25.00 ≥25.00
Pre-obese 25.00 - 29.99
25.00 - 27.49
27.50 - 29.99
Obese ≥30.00 ≥30.00
Obese
class I
30.00 - 34-99
30.00 - 32.49
32.50 - 34.99
Obese
class II
35.00 - 39.99
35.00 - 37.49
37.50 - 39.99
Obese
class III
≥40.00 ≥40.00
Source: Adapted from WHO, 1995, WHO, 2000 and WHO 2004
19
Nutritional gradation
based on BMI (adult)
Body Mass Index (BMI)
=
Weight in kg / height in meter sq.
THANK YOU

Nutritional assessment- anthropometry

  • 1.
    NUTRITIONAL ASSESSMENT SURVEY (Anthropometric assessment) Presentedby- Dr Garima Gupta MBBS, MD (Post Graduate Resident) University College of Medical Sciences and GTB Hospital Delhi
  • 2.
    NFHS-3, India, 2005-06 Whythe need of Nutritional Assessment?
  • 3.
    In the Triple-ACycle model: Indicators to assess and analyse nutrition The ANALYSIS stage aims to analyse the causes of malnutrition The ASSESSMENT stage aims to define the nutritional problem in terms of magnitude and distribution. ASSESSMENT of the nutritional situation in target population ACTION based on the analysis & available resources ANALYSIS of the causes of the problem
  • 4.
    A Dream – Yetto be achieved !! • Source- World Health Organisation
  • 5.
    Nutritional assessment -ABCD • Anthropometry: height, weight, BMI, MUAC • Biochemical: analysis of blood, urine, and other body tissues • Clinical: complete physical examination, and a medical and psychosocial history • Dietary: foods and quantities consumed, eating habits, accessibility of food, and cultural and socioeconomic factors that affect selection of food.
  • 6.
  • 7.
    HEIGHT OR LENGTH •Height Vertical distance measured from crown of head to bottom of feet (heels) for children 2 yr of age or older. • Recumbent length Distance measured from crown of head to bottom of feet (heels) while child (< 2 yr of age) is in supine position. Stadiometer Infantometer 7
  • 8.
    WEIGHT  Subject mustbe barefoot and wear as little clothing as possible.  Subject stands on the platform of the scale with his/her weight distributed evenly over both feet.  The arms hang by the sides of the trunk, with palms facing the thighs.  The subject is instructed to maintain a stable position while the measurement is taken
  • 9.
    • Gives apicture of past nutritional status • Deficit in height indicates chronic & prolonged under nutrition resulting often in permanently stunted physical status. Indications of height/length • Sensitive indicator of current nutritional status. • Deficit in weight indicates short term under nutrition which can be easily reversed. • PEM is best identified by weight deficiency in all groups. Indications of weight
  • 10.
    Mid-upper arm circumference(MUAC) MUAC is simple, cheap, more sensitive and less prone to mistakes.  Appropriate cut-off points of MUAC for children between 6 to 59 months are given below:
  • 11.
  • 12.
    HEAD CIRCUMFERENCE • Braingrowth takes place 70% during fetal life, 15% during infancy and remaining 10% during pre-school years. • Head circumference are routinely recorded until 5 years of age. •The head circumference is measured by placing the tape over the occipital protuberance at the back and just over the supraorbital ridge and the glabella in front. 12
  • 13.
    CHEST CIRCUMFERENCE • Itis usually measured at the level of nipples, preferably in mid inspiration. • In children ≤ 5years - lying down position > 5 years - standing position 13
  • 14.
    RELATIONSHIP BETWEEN HEADSIZE WITH CHEST CIRCUMFERENCE • At birth- head circumference > chest circumference by up to 3 cm. • At around 9 months to 1 year of age- head circumference = chest circumference, • but thereafter chest grows more rapidly compared to the brain. 14
  • 15.
  • 16.
    INDICES 16 • Relation betweentwo measurements • Weight For Age W/A general appreciation of nutritional status – combined measurement – NO individual diagnosis but trend assessment – For growth monitoring • Height For Age H/A measure of linear growth deficit or STUNTING – not sensitive to change – slow progress – Community diagnosis • Weight For Height/Length W/H measure of weight deficit according to length WASTING – Individual diagnosis – Community diagnosis – Sensitive to change
  • 17.
    STANDARD DEVIATION (SD)CLASSIFICATION CUT-OFF LEVEL NUTRITIONAL GRADE WEIGHT FOR AGE HEIGHT FOR AGE WEIGHT FOR HEIGHT  Median – 2 SD Normal Normal Normal Median – 3 SD to Median – 2 SD Moderate Underweight Moderate Stunting Moderate Wasting < Median – 3 SD Severe Underweight Severe Stunting Severe Wasting 17
  • 18.
    IAP CLASSIFICATION (Indian Academyof Paediatrics) WEIGHT FOR AGE (% of Harvard Standard) NUTRITIONAL GRADE  80 Normal 70 – 89.9 Grade I (Mild Undernutrition) 60 – 69.9 Grade II (Moderate Undernutrition) 50 – 59.9 Grade III (Severe Undernutrition) < 50 Grade IV (Severe Undernutrition) 18
  • 19.
    Classification BMI(kg/m2) Principal cut-off points Additionalcut-off points Underweight <18.50 <18.50 Severe thinness <16.00 <16.00 Moderate thinness 16.00 - 16.99 16.00 - 16.99 Mild thinness 17.00 - 18.49 17.00 - 18.49 Normal range 18.50 - 24.99 18.50 - 22.99 23.00 - 24.99 Overweight ≥25.00 ≥25.00 Pre-obese 25.00 - 29.99 25.00 - 27.49 27.50 - 29.99 Obese ≥30.00 ≥30.00 Obese class I 30.00 - 34-99 30.00 - 32.49 32.50 - 34.99 Obese class II 35.00 - 39.99 35.00 - 37.49 37.50 - 39.99 Obese class III ≥40.00 ≥40.00 Source: Adapted from WHO, 1995, WHO, 2000 and WHO 2004 19 Nutritional gradation based on BMI (adult) Body Mass Index (BMI) = Weight in kg / height in meter sq.
  • 20.