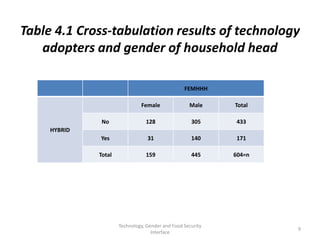
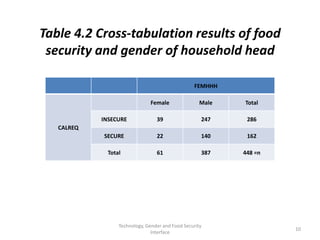
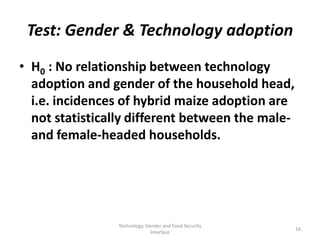
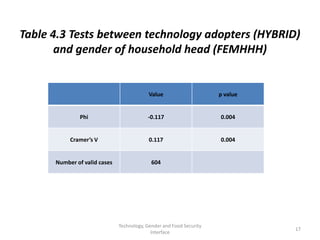
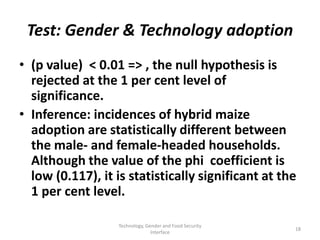
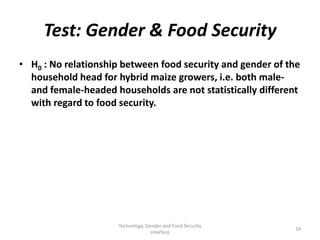
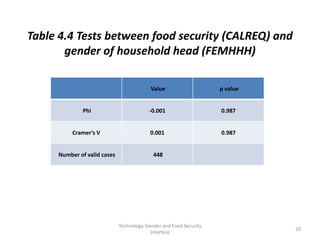
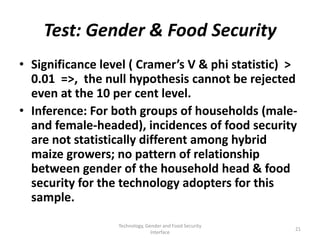
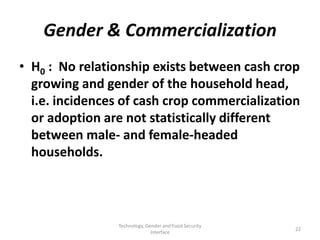
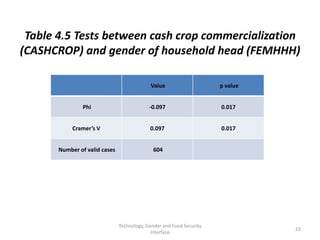
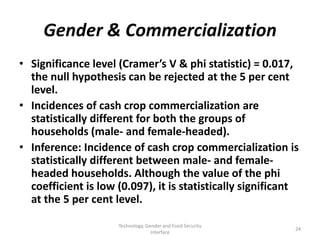
1. Technology, Gender and Food
Security Interface:
Cramer’s V & phi-test
Source: Babu and Sanyal (2009) 1
2. Technology, Gender and Food Security
Interface
• Gender empowerment: A major policy option considered for
reducing income deprivation and food insecurity.
• Reasons:
Women produce more than half the food grown in the
developing countries.
Women farmers in sub-Saharan Africa produce more
than three-quarters of the region’s basic food, manage
about two-thirds of the marketing and at least one-half
of the activities for storing food and raising animals.
In Asia, women account for more than two-thirds of food
production
Technology, Gender and Food Security
2
Interface
3. Gender & its Importance
• Reasons:
They contribute to about 45 per cent of production in
Latin America and the Caribbean.
• Disadvantage:
Women are risk-averse and hence, differential gender
profile with respect to technology adoption or
commercialization.
Differential commercialization profile also; women prefer
to grow food for home consumption; women have
limited access to land labor, credit & extension services.
Technology, Gender and Food Security
3
Interface
4. Differential gender profile of
technology
• Implications:
Differential distribution of gains of growth.
Adverse implications for family welfare and
nutrition.
Resource allocation depends on women’s share of
resources (crop ownership) and household head’s
gender, education and age.
Household characteristics, such as time spent in
household activities by men and women, access to
protected water and health and sanitation
conditions impact on children’s nutritional status.
Technology, Gender and Food Security
4
Interface
5. Issues
1.Gender profile of technology adoption
2. Gender profile of food security among
technology adopters
• Empirical evidence has policy implications on
food security
Malawi: Male-headed households have a higher
likelihood of adoption of hybrid maize than female-
headed households after controlling for other
important observable factors.
Nigeria, Kenya, Ghana.
Technology, Gender and Food Security
5
Interface
6. Empirical Verification
• Issues:
– (i)Gender profile of technology adoption;
– (ii) Gender profile of commercialization;
– (iii) Implications for food security.
Technology, Gender and Food Security
6
Interface
7. Empirical Verification
• Method:
– ‘cross-tabulation procedure’ ; pertains to relationship
between two or more categorical variables: if male- or
female-headed households are more likely to be
technology adopters, whether the different households
(male or female) are more food secure and finally we
want to determine if male- or female-headed households
are more likely to commercialize crops and thereby
receive greater income from the proceeds.
Technology, Gender and Food Security
7
Interface
8. Empirical Verification
Variables:
1. HYBRID: Dummy variable; whether a household grows hybrid maize
(HYBRID =1) or not (HYBRID = 0).
2. FEMHHH: Dummy variable; whether the household head is male
(FEMHHH=0) or female (FEMHHH = 1).
3. CASHCROP: tobacco, groundnuts, cotton and plantain are the major cash
crops in Malawi; Dummy variable for commercialization; CASHCROP = 1
if the household grows at least one of these four major cash crops and 0
otherwise.
4. CALREQ: Measure of food security ; if per adult equivalent calorie intake
for households meets at least 80 per cent of the calorie requirement
(2200 kcal); Dummy variable; CALREQ =1 if the household is food secure
and CALREQ = 0 otherwise.
Technology, Gender and Food Security
8
Interface
9. Table 4.1 Cross-tabulation results of technology
adopters and gender of household head
FEMHHH
Female Male Total
No 128 305 433
HYBRID
Yes 31 140 171
Total 159 445 604=n
Technology, Gender and Food Security
9
Interface
10. Table 4.2 Cross-tabulation results of food
security and gender of household head
FEMHHH
Female Male Total
INSECURE 39 247 286
CALREQ
SECURE 22 140 162
Total 61 387 448 =n
Technology, Gender and Food Security
10
Interface
12. Phi coefficient (Ф) & Cramer’s V
• Chi-square test:
test of association between categorical variables;
it does not tell us the strength of the relationship.
• Phi coefficient and Cramer’s V:
Quantify this relationship
Based on the chi-square statistic that controls for the sample
size.
Designed for use with nominal data and with chi-square they
jointly indicate the strength and the significance of a
relationship.
• Limitation: Provide some sense of the strength of the
association, they do not, in general, have an intuitive
interpretation.
Technology, Gender and Food Security
12
Interface
13. Phi coefficient (Ф)
• Ф coefficient:
A measure of the degree of association between two
binary variables.
Ratio of the chi-square statistic to the total number of
observations, i.e. Ф=√χ2/N.
Range: (-1, +1) for 2*2 tables.
Sampling distribution is known; possible to compute its
standard error and significance.
SPSS and other major packages report the significance
level of the computed phi value.
Technology, Gender and Food Security
13
Interface
14. Phi coefficient (Ф)
General rule of thumb for Ф coefficient of correlation
is:
-1.0 to 0.7 strong negative association
-0.7 to -0.3 weak negative association
-0.3 to +0.3 little or no association
+0.3 to +0.7 weak positive association
+0.7 to +1.0 strong positive association.
• It does not have a theoretical upper bound when
either of the variables has more than two
categories.
Technology, Gender and Food Security
14
Interface
15. Cramer’s V
• Cramer’s V:
Appropriate for tables that are larger than 2 *2
It is Ф rescaled so that it varies between 0 and 1.
Cramer’s V is V= √χ2/(N-1), where N is the total
number of observations and k is the smaller of
the number of rows and columns.
For 2*2 tables, Cramer’s V is equal to the
absolute value of the phi coefficient. This is
because since k =2, the (k -1) term becomes 1.
Technology, Gender and Food Security
15
Interface
16. Test: Gender & Technology adoption
• H0 : No relationship between technology
adoption and gender of the household head,
i.e. incidences of hybrid maize adoption are
not statistically different between the male-
and female-headed households.
Technology, Gender and Food Security
16
Interface
17. Table 4.3 Tests between technology adopters (HYBRID)
and gender of household head (FEMHHH)
Value p value
Phi -0.117 0.004
Cramer’s V 0.117 0.004
Number of valid cases 604
Technology, Gender and Food Security
17
Interface
18. Test: Gender & Technology adoption
• (p value) < 0.01 => , the null hypothesis is
rejected at the 1 per cent level of
significance.
• Inference: incidences of hybrid maize
adoption are statistically different between
the male- and female-headed households.
Although the value of the phi coefficient is
low (0.117), it is statistically significant at the
1 per cent level.
Technology, Gender and Food Security
18
Interface
19. Test: Gender & Food Security
• H0 : No relationship between food security and gender of the
household head for hybrid maize growers, i.e. both male-
and female-headed households are not statistically different
with regard to food security.
Technology, Gender and Food Security
19
Interface
20. Table 4.4 Tests between food security (CALREQ) and
gender of household head (FEMHHH)
Value p value
Phi -0.001 0.987
Cramer’s V 0.001 0.987
Number of valid cases 448
Technology, Gender and Food Security
20
Interface
21. Test: Gender & Food Security
• Significance level ( Cramer’s V & phi statistic) >
0.01 =>, the null hypothesis cannot be rejected
even at the 10 per cent level.
• Inference: For both groups of households (male-
and female-headed), incidences of food security
are not statistically different among hybrid
maize growers; no pattern of relationship
between gender of the household head & food
security for the technology adopters for this
sample.
Technology, Gender and Food Security
21
Interface
22. Gender & Commercialization
• H0 : No relationship exists between cash crop
growing and gender of the household head,
i.e. incidences of cash crop commercialization
or adoption are not statistically different
between male- and female-headed
households.
Technology, Gender and Food Security
22
Interface
23. Table 4.5 Tests between cash crop commercialization
(CASHCROP) and gender of household head (FEMHHH)
Value p value
Phi -0.097 0.017
Cramer’s V 0.097 0.017
Number of valid cases 604
Technology, Gender and Food Security
23
Interface
24. Gender & Commercialization
• Significance level (Cramer’s V & phi statistic) = 0.017,
the null hypothesis can be rejected at the 5 per cent
level.
• Incidences of cash crop commercialization are
statistically different for both the groups of
households (male- and female-headed).
• Inference: Incidence of cash crop commercialization is
statistically different between male- and female-
headed households. Although the value of the phi
coefficient is low (0.097), it is statistically significant
at the 5 per cent level.
Technology, Gender and Food Security
24
Interface