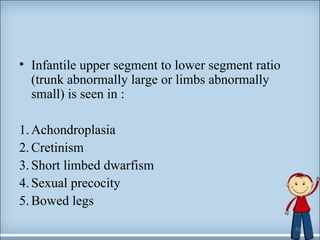
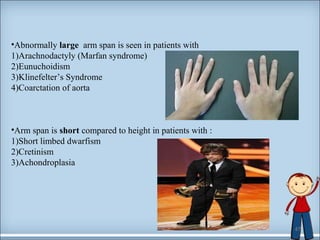
Downloaded 145 times

![B] Expected height upto 12 yrs
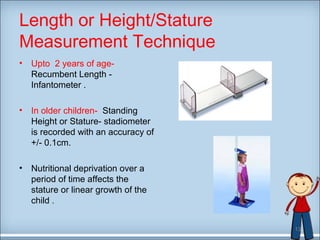
length or height (in cms) = age in years x 6 +77 ( wheech’s formula )
C] ] Prediction of adult height
• Parental height , Tanner’s formula and Weech’s formula are used.
19](https://image.slidesharecdn.com/anthrapometry-140918015129-phpapp02/85/Anthrapometry-19-320.jpg)


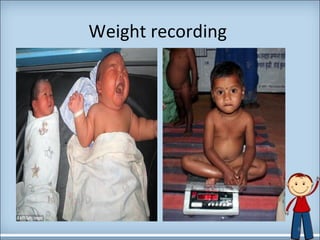
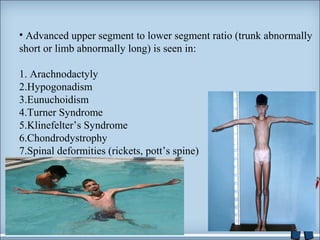
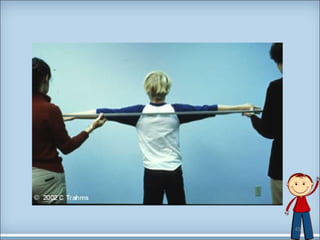
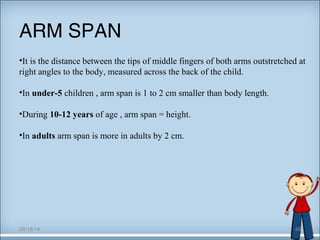
![Body ratios
• Rao & Singh’s weight-height index:
= [weight (kg) / (height)2 cms ] * 100
normal index is more than 0.15
• Kanawati index: (during 3m to 4 years)
= Mid-arm circumference / Head circumference
Normal 0.331
Mild 0.310 – 0.280
Modreate 0.279 – 0.250
Severe < 0.250
37](https://image.slidesharecdn.com/anthrapometry-140918015129-phpapp02/85/Anthrapometry-37-320.jpg)


This document discusses anthropometry, which involves the quantitative measurement of the human body. It is used to assess nutritional status by measuring factors like weight, height, head circumference, chest circumference, mid-upper arm circumference, and skinfold thickness. Various growth charts and formulas are provided to determine normal values for infants and children at different ages. Anthropometry allows for the inexpensive and non-invasive evaluation of undernutrition and overnutrition, though it has limitations like inter-observer errors and arbitrary statistical cut-offs.


![ONFH[AVN HIP] -TRIPLE REGIME -A NOVAL SURGICAL CONCEPT .pptx](https://cdn.slidesharecdn.com/ss_thumbnails/onfhavnhip2026koaconcalicutdrgokuldevdrmashraf-260210064517-213ec005-thumbnail.jpg?width=640&height=640&fit=bounds)


