SlideShare a Scribd company logo
1 of 13
HYDROLOGICAL MODELING STUDIES FOR                                            PROPOSED             FLOOD-
CONTROL DAMS IN THE MARIKINA RIVER BASIN

Leonardo Q. Liongson
Team Energy Professorial Chair
& Professor, Institute of Civil Engineering and National Hydraulic Research Center, University of the
Philippines, Diliman, Quezon City, Philippines

Abstract
Tropical Storm Ondoy (Ketsana) crossed Metro Manila and the adjacent river basins in a late wet-season
episode of 2009, starting in the evening of September 25, 2009 and continuing into the next day of
September 26, 2009. TS Ondoy brought very intense and heavy rainfall to the region - record amounts of
rains fell over a very short time period of 12 hours to 24 hours, which are estimated to occur at an average
annual frequency of 1 in 100 years or even higher, depending on the measuring location in the region. The
rains generated record-magnitude flood flows and inundation in the Pasig-Marikina River Basin in Metro
Manila, and the Laguna de Bay region. This paper describes the application of the distributed watershed
rainfall-runoff model SWATCH in order to simulate the TS Ondoy floods and other floods of lower return
periods (2 years to 100 years) in the upper Marikina River Basin, using as input the spatially-interpolated
rainfall network data and available topographic, soil/geology and river-geometry data. The SWATCH
model consists of a tree-network of several variable rectangular surface/soil/aquifer storage nodes and
overland/channel flow links, with accounting of soil moisture, evapotranspiration, infiltration, and recharge
to groundwater, and routing of overland and channel flows, interflow and baseflow into aggregated total
streamflows. Using the model-computed inflow flood hydrographs, the options of single or cascade of
flood-control storage dams (with selected reservoir-storage and spillway capacities) for attenuation of
floods peaks and volumes, and downstream flood hazard reduction are initially evaluated by flood-routing
studies.


Introduction

Tropical Storm Ondoy (Ketsana) crossed Metro Manila and the adjacent river basins in a late wet-season
episode of 2009, starting in the evening of September 25, 2009 and continuing into the next day of
September 26, 2009. TS Ondoy brought very intense and heavy rainfall to the region - record amounts of
rains fell over a very short time period of 12 hours to 24 hours, which are estimated to occur at an average
annual frequency of 1 in 100 years or even higher, depending on the measuring location in the region. The
rains generated record-magnitude flood flows and inundation in the Pasig-Marikina River Basin in Metro
Manila, and the Laguna de Bay region. The hydrological and hydraulic aspects of the Ts Ondoy (Ketsana)
extreme event (storm rainfall, floods) were described previously by the author (Liongson, 2010) and the
flood management alternatives were also discussed in the same article.

With the purpose of evaluating the performance of the proposed flood mitigation measure which is a high
Marikina Dam or else a cascase of two or three flood-control dams, the two hydrological modeling
applications for the upper Marikina River Basin were undertaken, as reported in this paper:

(1) The application of the distributed watershed rainfall-runoff model SWATCH in order to simulate the TS
Ondoy floods and other floods of lower return periods (2 years to 100 years) in the upper Marikina River
Basin, using as input the spatially-interpolated rainfall network data and available topographic, soil/geology
and river-geometry data. The SWATCH model consists of a tree-network of several variable rectangular
surface/soil/aquifer storage nodes and overland/channel flow links, with accounting of soil moisture,
evapotranspiration, infiltration, and recharge to groundwater, and routing of overland and channel flows,
interflow and aquifer return flow (baseflow) into aggregated total streamflows;

(2) The flood routing studies wherein, by using the model-computed inflow flood hydrographs, and
selecting the options of single or cascade of flood-control storage dams (with selected reservoir-storage and
spillway capacities), the attenuation of floods peaks and flood volumes and the downstream flood hazard
reduction are initially evaluated.


The SWATCH Model

SWATCH is a mathematical distributed watershed model developed by Morel-Seytoux et. al. (1987) to
physically simulate a stream-aquifer system for a storm event. SWATCH utilizes basin division in order to
model spatial variability. Rainfall in different rainfall stations is then distributed to these divisions by
means of weights and runoff is computed through the use of its various modules for runoff computation
such as rainfall, storage, infiltration, excess rainfall, soil moisture storage, evapotranspiration, overland
flow, interflow storage and discharge, groundwater recharge flow, stream-aquifer return flow and channel
flow modules. The sum of overland flow, interflow and aquifer return flow is computed as total lateral
inflow to the river channels (Figure 1).


   Figure 1 – Cross-sectional diagram of the watershed hydrologic simulation model SWATCH (1988).

Without going into the mathematical details of the other components of the hydrologic cycle
(evapotranspiration, infiltration, soil moisture storage), a brief summary of the equations for overland flow,
river-channel flow, interflow and aquifer return flow (baseflow) is provided below:


                                                      2
Kinematic model of overland flow:
∂h ∂  1 5 / 3 1/ 2 
  +    h SV  = i − f
∂t ∂x  n V         
(x,t) = distance and time coordinates.
      1 5 / 3 1/ 2
q=      h SV = overland flow discharge/unit width.
     nV
h = water retention depth of overland flow.
i = rainfall intensity on overland surface plain.
f = infiltration rate on overland surface plain.
n V = Manning's roughness coefficient of overland surface plane .
SV = slope of overland surface plain


Kinematic model of river-channel flow:
    ∂H ∂  1               
B     +    BH SR  = q − Bf
                5 / 3 1/ 2
    ∂t ∂x  n R            
      1
Q=      BH5 / 3S1/ 2 = river-channel discharge.
                R
     nR
H = water depth of river-channel flow.
B = width of river channel.
q = specific overland flow discharge.
f = bed infiltration rate.
n R = Manning's roughness coefficient of river bed.
SR = slope of river channel bed.


Darcy-flow Kinematic model of interflow or upper saturated zone:
   ∂h       ∂
n I I + [ K I h ISI ] = fex − feff
    ∂t ∂x
qI = K I h ISI = interflow discharge at river intersection.
h I = saturated depth of interflow or upper saturated zone.
fex = excess infiltration rate from upper unsaturated zone (vadose zone).
feff = effective infiltration rate from interflow or upper saturated zone.
K I = horizontal hydraulic conductivity of interflow zone.
SI = slope of interflow plane.
n I = effective drainable porosity of interflow zone.


                                                        3
Darcy-flow Groundwater model of aquifer or lower saturated zone:
    ∂hG ∂  ∂h G 
SG      +       TG      = rG
     ∂t ∂x       ∂x 
                      
         ∂h
qG = TG G = groundwater return flow or baseflow at river intersection.
          ∂x
h G = saturated depth of aquifer or lower saturated zone.
rG = aquifer recharge rate.
SG = effective drainable aquifer porosity.
TG = aquifer transmissivity.


Rainfall Interpolation and Depth-Duration-Frequency Relations


             Figure 2 – The map of the Marikina River Basin, showing the sub-basin divisions
                          and river network of 84 reaches within the watershed.


The rainfall data network used in the study consists of four (4) short-record EFCOS climatic stations (Boso
Boso, Mt. Oro, Aries and Nangka) and one PAGASA Science Garden long-record synoptic stations. The
hourly rainfall data observed at the rainfall stations are used to interpolate point rainfall at the centroids
(x,y) of the 84 sub-basins of the watershed, using the unbiased multiquadric method (Balascio, 2001) as
described below. The T-year annual maximum rainfall depth for Science Garden is represented by the
Extreme Value Type or Gumbel distribution, derived after frequency analysis of the 38 years of annual
maximum records for storm durations ranging from 10 minutes to 48 hours. The result is the so-called
Rainfall-Duration-Frequency or RDF relations. The RDF relation for each short-term EFCOS station is
extended or derived (by transposition) by multiplying the Science Garden RDF value of given duration by
the ratio of maximum storm depths for the same duration, measured during the same TS Ketsana storm
event, at the short-term EFCOS station and the Science Garden synoptic station. The rainfall estimation
equations are presented below.


                                                      4
Unbiased Multiquadric Method of Rainfall Interpolation:
zo = Do c + b
zo = interpolated rainfall at variable point (x,y).
Do = station (xi ,yi )-to-point (x,y) distance (Nx1) vector =      (   (x-xi )2 +(y-yi )2   )
z = Dc + b1
z = (1xN) vector of observed rainfall at station (xi ,yi ) for i=1,2, 3...N.
D = station (xi ,yi )-to-station (x j ,y j ) distance (NxN) matrix =  (xi -x j )2 +(yi -yi )2 
                                                                                              
                     1 t D-1 z
b = bias correction =          , to satisfy the condition that 1 t c=0 (zero sum of coefficients).
                     1 t D-1 1
c = (1xN) coefficient vector = D-1 (z-b 1)
1= (1xN) unity vector


Extreme Value Type I or Gumbel Distribution
(Rainfall-Duration-Frequency (RDF) relations):
XT (d) = X(d) + S(d) K T = T-year annual maximum rainfall depth of duration, d.
x k (d)= k-th observed annual maximum rainfall of duration,d.
X(d) = sample mean annual maximum rainfall depth of duration, d.
  1 N
=   ∑ xk (d)
  N k =1
S(d) = sample standard deviation of annual rainfall depth of duration, d.
                                1/ 2
  1 N                     2
=     ∑  xk (d) − X(d)  
  N-1 k = N
                        
                            
          6                    T 
KT = -       0.5770 + ln ln           = Gumbel frequency factor.
         π 
                               T-1  

Station-to-Station RDF Transposition:
             x(i,d,TS Ketsana) 
XT (i, d) =                     XT (j, d)
             x(j,d,TS Ketsana) 
XT (i, d) = T-year estimated/extended annual maximum rainfall at short-record station-i
(EFCOS stations) for duration, d.
XT (j, d) = T-year annual maximum rainfall at long-record station-j (Science Garden) for duration, d.
x(i,d,TS Ketsana) = observed TS Ketsana maximum rainfall at short-record station-i for duration, d
x(j,d,TS Ketsana) = observed TS Ketsana maximum rainfall at long-record station-j for duration, d.

The RDF values aree incremented and converted into 48-hour critical storm profiles for all stations and T-
year or TS Ketsana event, using the alternating-block method wherein the maximum rainfall intensity
occurs in the middle of the 48-hours storm and lower intensities occur before and the after the time of peak
intensity. Using the SWATCH model and the spatially interpolated hourly sub-basin rainfall over the 84
sub-basins, the streamflow flood hydrographs are computed for the TS Ketana event and also for return
periods of 2, 5, 10, 25, 50 and 100 years. The simulated flood hydrographs (in terms of water level) are
compared with the observed water level at the river stations of Montalban, Nangka, Sto. Niño (Figure 3, for
example) and Rosario Junction. As examples, the simulated flood hydrographs at Montalban and Sto. Niño
river station during the TS Ketsana storm event are shown in Figure 4.


                                                              5
Figure 3 – Comparison between SWATCH-computed flood hydrograph (converted from discharge to water
level using the DPWH-JICA discharge rating equations as shown) and the observed water level of Marikina
 River at Sto. Niño station, which both reached levels between 12 noon and 4 p.m. on 26 September 2009.
 The difference in results can be attributed to the limitation that the kinematic channel flow model used is a
 one-dimensional channel flow model which does not include an extensive flood plain (considered in two-
   dimensional inundation models) affected by river overflows, floodplain storage and local patterns of
                                                 tributary flows.


Figure 4 – Examples of output SWATCH-computed flood hydrographs during the TS Ketsana storm event,
at the locations of the EFCOS Montalban and Sto. Niño station water-level stations.


                                                      6
Flood Routing for Alternative Flood-control Dam Alternatives.

The alternatives for flood-control dams as flood mitigation measures in the upper Marikina River Basin
have been proposed in three prospective dam locations (as single dams or cascade of two or three dams)
(Figure 5). Using geologic and contour maps, potential locations for a flood mitigation reservoir are located
at the proposed project site of the Marikina Dam, along Wawa River, near the Montalban Bridge and Wawa
dam. The other two are found along Boso-Boso River, near Mt. Tayabasan and Mt. Baytangan,
respectively, in the mountainous regions of the river basin.


          Figure 5. Proposed locations of flood-control dams at Marikina Dam A (at Wawa River),
                                Boso Boso Dam A and Boso Boso Dam B.

The flood routing studies are conducted using the hydrological storage routing method. Given the
SWATCH-computed inflow flood hydrographs into a dam-reservoir, the storage volume capacity of the
reservoir (planimetered from a digital-elevation model or DEM of the river valley and watershed), and the
assumed overflow spillway discharge capacity (parameterized by spillway crest elevation and crest length),
the outflow (release) flood hydrographs are computed. The spillway parameters are selected in order to
maximize the attenuation (reduction) of peak outflow flood discharge and the retained flood volume by
reservoir storage and spillway regulation. The equations are given indicated below:

Reservoir Storage Routing Equations:
dS
    = ∑ Qin (t) − Qout (t)
dt      in

Qin (t) = inflow discharge to reservoir from each source-in.
Qout (t) = CL ( H(t) − Hc )
                          3/ 2
                                 = overflow spillway discharge (spillway rating equation).
S = S(H) = reservoir storage volume as a function of H (reservoir capacity equation).
H = H(t) = reservoir water surface elevation above riverbed.
Hc = elevation of spillway crest above riverbed.
L = width of spillway crest.
C = spillway discharge coefficient.


                                                          7
Flood Routing Results

The diagrams and table of results of the flood routing computations are shown below and in the succeeding
pages.

                 Table 1 – Results of Flood Routing Studies for Single Dam Alternatives


                                    (a) Single Dam – Marikina Dam A..


                                    (b) Single Dam – Boso Boso Dam B.


                                    (c) Single Dam – Boso Boso Dam A


                                                   8
Figure 6 – Examples of network diagram and flood-routing inflow, outflow,
        stage (water surface elevation) and storage hydrographs for Single Marikina Dam A.


Figure 7 – Example of network diagram and flood-routing stage (water surface elevation) hydrographs
          for Triple Cascade of Boso Boso Dam B, Boso Boso Dam A and Marikina Dam A.


                                              9
Table 2 – Results of Flood Routing Studies for Double Cascade Dam Alternatives


           (a) 2-Dam Cascade: Boso Boso Dam A and Marikina Dam A.


           (b) 2-Dam Cascade: Boso Boso Dam B and Marikina Dam A.


          (c) 2-Dam Cascade: Boso Boso Dam B and Boso Boso Dam A.


                                     10
Table 3 – Results of Flood Routing Studies for Triple Cascade Dam Alternative


Discussion of Results

The Upper Marikina River Basin experienced large flows during TS Ketsana in Septemebr 2009 resulting
from the large amounts and high intensity of rainfall over a period of 12 to 24 hours. The updated
SWATCH model applied in this study computed a TS Ketsana peak flood flow of about 5000 m3/s at Sto.
Niño water-level station (slightly lower than the initial NHRC estimate of 5700 m3/s (which was based on
an areally adjusted Science Garden rainfall data and not on EFCOS rainfall network data, as reported
earlier by this author (Liongson, 2010)). This maximum flood discharge greatly exceeded the river bankful
capacity of the river of about 900 m3/s.. There is a need to mitigate, if not prevent, the damage that future
typhoons may bring to the river basin since the Upper Marikina River Basin is contributory to the flooding
of Metro Manila.

Calculations for the best dam design parameters show that the triple cascade dam (Table 3) is the most
viable solution for the river basin, achieving a 6% attenuation to TS Ketsana flood peak inflow (from peak
inflow of 2722 m3/s to peak outflow of 2566 m3/s). Based on the RDF relations derived from historical
rainfall record (as inputs to SWATCH), the succeeding flood routing procedure has shown that the triple
cascade dam can give a 13% attenuation to flood peak for a 100-year return period design flood (from peak
inflow of 3023 m3/s to peak outflow of 2632 m3/s). It is also seen from the Tables 3 that that the selected
best dam/spillway parameters can afford to store only about 3-7% of inflow flood volume. The same
dam/spillway parameters afford a 30.67 m. and 31.13 m maximum water level rise (above the riverbed) for
the TS Ketsana flood and 100-year flood, respectively, for a spillway crest elevation of 5 m. above the
riverbed.

The proposed single dam design (Table 1), Marikina Dam A, is clearly not viable, as it can only give a 1%
attenuation to flood peak (with a peak outflow of 2,855 m3/s), storing only 8% of the inflow flood volume,
and producing a 36.70 m. maximum water level rise (above the riverbed) for TS Ketsana flood, for a
spillway crest elevation of 23 m. above the riverbed.


                                                    11
Recommendations

The created IDF curves for the EFCOS rainfall stations were done only through TS Ketsana-event-
based storm transposition of the rainfall from the long-record Science Garden station. The refinement
of the IDF curves could be better facilitated through the acquisition and processing of more future and
historical rainfall data gathered in both EFCOS climatic and PAGASA synoptic rainfall stations.

From discussions with hydraulic engineers in various fora, the proposed Marikina Dam A can not be
used since it has a limestone foundation. Added to that is the proximity of the location to the Valley
Fault System. A study of the geological properties and possible geotechnical solutions to the
permeability and earthquake risk should be undertaken.

The conclusion in this study regarding the higher values of both inflow and outflow flood discharges of
Marikina Dam A differ with the proposed dam design values indicated in the DPWH report (Gatan,
2009), wherein the dam design may be able to reduce the peak flood discharge of a 100-year storm into
that of a 30-year storm (from 2100 m3/s to 1500 m3/s). The data used by both studies should be
checked to establish a better grasp of the viability of a dam as a solution for the river basin flooding.
Although surveys of the proposed dam locations and other potential dam locations could be undertaken
to refine the dam design parameters (reservoir volume capacity, spillway crest elevation and length) it
is anticipated that the said refinement will only be a small increment over the previously computed
volume capacity based on the DEM. It is strongly recommended that other flood mitigation measures
should be studied in the river basin, since the proposed dam designs are ineffective in reducing peak
flows and store only a small portion of flood volumes for return periods of 25, 50 and 100 years, and
for TS Ketsana event, with the added risk of a huge rise of water levels in areas upstream of the said
dam locations.

Due to the limitation in the ability of the proposed flood-control dams to reduce flood peaks and
volumes, resulting from the low viable reservoir volume capacities in the upper Marikina River Basin,
it is wise to recommend that other feasible mitigation measures be seriously planned and implemented
for the Pasig-Marikina River Basin as a whole: both structural and non-structural, especially
downstream, measures in the populated areas of the basin. These measures include the following:
1. Concerted push to undertake regional-wide and basin-wide typhoon, rainfall and flood monitoring,
      modeling, forecasting, warning and community-based action programs. This should include the
      well-informed detailed interfacing and connectivity of local drainage works and major river
      channel and lakeshore projects, affecting the operations of floodways, control structures such as
      flood gates and weirs, and pumping stations.
2. Review, revision, updating and upgrading (if necessary) of the design and plans of ongoing
      channel improvement and other river engineering projects (riverbank protection, diking,
      floodways, widening and dredging, if ever) in view of the updated hydrological estimates of
      extreme rainfall and flood magnitudes.
3. City-level feasibility studies on the adoption and construction of temporary flood detention basins
      in open, flat and low areas near river channels (such as parks and wetlands), which will accept
      river overflows and, through provision of shaft spillways, divert and store excess flood waters in
      underground water cisterns, with added benefit as storage for raw water supply sources.

References

Balascio, C., 2001. Multiquadric Equations and Optimal Areal Rainfall Estimation. Journal of
    Hydrologic Engineering, pp.498-505.
Liongson, L., 2010, Flood Mitigation in Metro Manila, Philippine Engineering Journal, June 2010
    issue, National Engineering Center, UP Diliman.
Morel-Seytoux et al., 1987. SWATCH: A Multi Process Watershed Model for Simulation of Surface
    and Subsurface Flows in a Soil-Aquifer-Stream Hydrologic Syste, Colorado State University.
Gatan, Patrick., 2009. Learning from the Ondoy Flood – A Dialogue with Experts. DPWH. 14 October
    2009, Manila, Philippines. Asian Development Bank website:
    http://www.adb.org/water/topics/pdfs/OKF-SSantiago.pdf.


                                                12
13

More Related Content

What's hot

Understanding Who is AT RISK - Flood extent modelling
Understanding Who is AT RISK - Flood extent modellingUnderstanding Who is AT RISK - Flood extent modelling
Understanding Who is AT RISK - Flood extent modellingAlex Nwoko
 
San Elijo Hills Drainage Diversion Hydrogeologist Report
San Elijo Hills Drainage Diversion Hydrogeologist ReportSan Elijo Hills Drainage Diversion Hydrogeologist Report
San Elijo Hills Drainage Diversion Hydrogeologist Reporttalerco
 
Maintain-for-less Mississippi 2011
Maintain-for-less Mississippi 2011Maintain-for-less Mississippi 2011
Maintain-for-less Mississippi 2011Matthijs Bos
 
Modelling of a Coastal Aquifer using FEFLOW
Modelling of a Coastal Aquifer using FEFLOWModelling of a Coastal Aquifer using FEFLOW
Modelling of a Coastal Aquifer using FEFLOWC. P. Kumar
 
Integrated hydro-geological risk for Mallero basin (Alpine Italy) – part 2: h...
Integrated hydro-geological risk for Mallero basin (Alpine Italy) – part 2: h...Integrated hydro-geological risk for Mallero basin (Alpine Italy) – part 2: h...
Integrated hydro-geological risk for Mallero basin (Alpine Italy) – part 2: h...Alireza Babaee
 
0509 presentation to_rwqcb
0509 presentation to_rwqcb0509 presentation to_rwqcb
0509 presentation to_rwqcbguest68898e
 
Climate Change and Water Supply in the Mekong Delta. Workshop Results
Climate Change and Water Supply in the Mekong Delta. Workshop ResultsClimate Change and Water Supply in the Mekong Delta. Workshop Results
Climate Change and Water Supply in the Mekong Delta. Workshop ResultsHanna Stahlberg
 
Integrated hydro-geological risk for Mallero basin (Alpine Italy) – part 1: g...
Integrated hydro-geological risk for Mallero basin (Alpine Italy) – part 1: g...Integrated hydro-geological risk for Mallero basin (Alpine Italy) – part 1: g...
Integrated hydro-geological risk for Mallero basin (Alpine Italy) – part 1: g...Alireza Babaee
 
Lecture 7 ce1005 Irrigation and Flood control by Rabindra Ranjan Saha,PENG, WUB
Lecture 7 ce1005 Irrigation and Flood control by Rabindra Ranjan Saha,PENG, WUBLecture 7 ce1005 Irrigation and Flood control by Rabindra Ranjan Saha,PENG, WUB
Lecture 7 ce1005 Irrigation and Flood control by Rabindra Ranjan Saha,PENG, WUBWorld University of Bangladesh
 
Saltwater Intrusion on the Main Rivers under the Impact of Climate Change, Ng...
Saltwater Intrusion on the Main Rivers under the Impact of Climate Change, Ng...Saltwater Intrusion on the Main Rivers under the Impact of Climate Change, Ng...
Saltwater Intrusion on the Main Rivers under the Impact of Climate Change, Ng...Hanna Stahlberg
 
Groundwater supply in metro manila
Groundwater supply in metro manilaGroundwater supply in metro manila
Groundwater supply in metro manilaharoldtaylor1113
 
DSD-INT 2016 Assessment of hydrologic alterations using floodplain connectivi...
DSD-INT 2016 Assessment of hydrologic alterations using floodplain connectivi...DSD-INT 2016 Assessment of hydrologic alterations using floodplain connectivi...
DSD-INT 2016 Assessment of hydrologic alterations using floodplain connectivi...Deltares
 
Estimation of Groundwater Recharge Using WetSpass and MODFLOW
Estimation of Groundwater Recharge  Using WetSpass and MODFLOWEstimation of Groundwater Recharge  Using WetSpass and MODFLOW
Estimation of Groundwater Recharge Using WetSpass and MODFLOWPutika Ashfar Khoiri
 
Modelling of Seawater Intrusion
Modelling of Seawater IntrusionModelling of Seawater Intrusion
Modelling of Seawater IntrusionC. P. Kumar
 
Civil v-hydrology and irrigation engineering [10 cv55]-notes
Civil v-hydrology and irrigation engineering [10 cv55]-notesCivil v-hydrology and irrigation engineering [10 cv55]-notes
Civil v-hydrology and irrigation engineering [10 cv55]-notesSuryenn Edwie Mon
 
LAND DRAINAGE- CLASSIFICATIONS, STEADY AND UNSTEADY STATE EQUATIONS
LAND DRAINAGE- CLASSIFICATIONS, STEADY AND UNSTEADY STATE EQUATIONSLAND DRAINAGE- CLASSIFICATIONS, STEADY AND UNSTEADY STATE EQUATIONS
LAND DRAINAGE- CLASSIFICATIONS, STEADY AND UNSTEADY STATE EQUATIONSNamitha M R
 
Water Balance to Recharge Calculation: Implications for Watershed Management ...
Water Balance to Recharge Calculation: Implications for Watershed Management ...Water Balance to Recharge Calculation: Implications for Watershed Management ...
Water Balance to Recharge Calculation: Implications for Watershed Management ...Ramesh Dhungel
 
Weekly and Monthly Groundwater Recharge Estimation in A Rural Piedmont Enviro...
Weekly and Monthly Groundwater Recharge Estimation in A Rural Piedmont Enviro...Weekly and Monthly Groundwater Recharge Estimation in A Rural Piedmont Enviro...
Weekly and Monthly Groundwater Recharge Estimation in A Rural Piedmont Enviro...Agriculture Journal IJOEAR
 

What's hot (20)

Understanding Who is AT RISK - Flood extent modelling
Understanding Who is AT RISK - Flood extent modellingUnderstanding Who is AT RISK - Flood extent modelling
Understanding Who is AT RISK - Flood extent modelling
 
San Elijo Hills Drainage Diversion Hydrogeologist Report
San Elijo Hills Drainage Diversion Hydrogeologist ReportSan Elijo Hills Drainage Diversion Hydrogeologist Report
San Elijo Hills Drainage Diversion Hydrogeologist Report
 
Maintain-for-less Mississippi 2011
Maintain-for-less Mississippi 2011Maintain-for-less Mississippi 2011
Maintain-for-less Mississippi 2011
 
Modelling of a Coastal Aquifer using FEFLOW
Modelling of a Coastal Aquifer using FEFLOWModelling of a Coastal Aquifer using FEFLOW
Modelling of a Coastal Aquifer using FEFLOW
 
Current surface water resources of the Ganges coastal zone of Bangladesh
Current surface water resources of the Ganges coastal zone of BangladeshCurrent surface water resources of the Ganges coastal zone of Bangladesh
Current surface water resources of the Ganges coastal zone of Bangladesh
 
Integrated hydro-geological risk for Mallero basin (Alpine Italy) – part 2: h...
Integrated hydro-geological risk for Mallero basin (Alpine Italy) – part 2: h...Integrated hydro-geological risk for Mallero basin (Alpine Italy) – part 2: h...
Integrated hydro-geological risk for Mallero basin (Alpine Italy) – part 2: h...
 
0509 presentation to_rwqcb
0509 presentation to_rwqcb0509 presentation to_rwqcb
0509 presentation to_rwqcb
 
Climate Change and Water Supply in the Mekong Delta. Workshop Results
Climate Change and Water Supply in the Mekong Delta. Workshop ResultsClimate Change and Water Supply in the Mekong Delta. Workshop Results
Climate Change and Water Supply in the Mekong Delta. Workshop Results
 
G04633950
G04633950G04633950
G04633950
 
Integrated hydro-geological risk for Mallero basin (Alpine Italy) – part 1: g...
Integrated hydro-geological risk for Mallero basin (Alpine Italy) – part 1: g...Integrated hydro-geological risk for Mallero basin (Alpine Italy) – part 1: g...
Integrated hydro-geological risk for Mallero basin (Alpine Italy) – part 1: g...
 
Lecture 7 ce1005 Irrigation and Flood control by Rabindra Ranjan Saha,PENG, WUB
Lecture 7 ce1005 Irrigation and Flood control by Rabindra Ranjan Saha,PENG, WUBLecture 7 ce1005 Irrigation and Flood control by Rabindra Ranjan Saha,PENG, WUB
Lecture 7 ce1005 Irrigation and Flood control by Rabindra Ranjan Saha,PENG, WUB
 
Saltwater Intrusion on the Main Rivers under the Impact of Climate Change, Ng...
Saltwater Intrusion on the Main Rivers under the Impact of Climate Change, Ng...Saltwater Intrusion on the Main Rivers under the Impact of Climate Change, Ng...
Saltwater Intrusion on the Main Rivers under the Impact of Climate Change, Ng...
 
Groundwater supply in metro manila
Groundwater supply in metro manilaGroundwater supply in metro manila
Groundwater supply in metro manila
 
DSD-INT 2016 Assessment of hydrologic alterations using floodplain connectivi...
DSD-INT 2016 Assessment of hydrologic alterations using floodplain connectivi...DSD-INT 2016 Assessment of hydrologic alterations using floodplain connectivi...
DSD-INT 2016 Assessment of hydrologic alterations using floodplain connectivi...
 
Estimation of Groundwater Recharge Using WetSpass and MODFLOW
Estimation of Groundwater Recharge  Using WetSpass and MODFLOWEstimation of Groundwater Recharge  Using WetSpass and MODFLOW
Estimation of Groundwater Recharge Using WetSpass and MODFLOW
 
Modelling of Seawater Intrusion
Modelling of Seawater IntrusionModelling of Seawater Intrusion
Modelling of Seawater Intrusion
 
Civil v-hydrology and irrigation engineering [10 cv55]-notes
Civil v-hydrology and irrigation engineering [10 cv55]-notesCivil v-hydrology and irrigation engineering [10 cv55]-notes
Civil v-hydrology and irrigation engineering [10 cv55]-notes
 
LAND DRAINAGE- CLASSIFICATIONS, STEADY AND UNSTEADY STATE EQUATIONS
LAND DRAINAGE- CLASSIFICATIONS, STEADY AND UNSTEADY STATE EQUATIONSLAND DRAINAGE- CLASSIFICATIONS, STEADY AND UNSTEADY STATE EQUATIONS
LAND DRAINAGE- CLASSIFICATIONS, STEADY AND UNSTEADY STATE EQUATIONS
 
Water Balance to Recharge Calculation: Implications for Watershed Management ...
Water Balance to Recharge Calculation: Implications for Watershed Management ...Water Balance to Recharge Calculation: Implications for Watershed Management ...
Water Balance to Recharge Calculation: Implications for Watershed Management ...
 
Weekly and Monthly Groundwater Recharge Estimation in A Rural Piedmont Enviro...
Weekly and Monthly Groundwater Recharge Estimation in A Rural Piedmont Enviro...Weekly and Monthly Groundwater Recharge Estimation in A Rural Piedmont Enviro...
Weekly and Monthly Groundwater Recharge Estimation in A Rural Piedmont Enviro...
 

Similar to 2011 liongson-modeling studies flood control dams-professorial chair lecture

Rainfall Runoff Modelling on the Lower Tapi Basin using HEC-HMS
Rainfall Runoff Modelling on the Lower Tapi Basin using HEC-HMSRainfall Runoff Modelling on the Lower Tapi Basin using HEC-HMS
Rainfall Runoff Modelling on the Lower Tapi Basin using HEC-HMSAnkit Balyan MBA, B.Tech.
 
Hydrological Application of Remote – Sensing and GIS for Handling of Excess R...
Hydrological Application of Remote – Sensing and GIS for Handling of Excess R...Hydrological Application of Remote – Sensing and GIS for Handling of Excess R...
Hydrological Application of Remote – Sensing and GIS for Handling of Excess R...IDES Editor
 
Research plan- The Impact of Land-Use in Lowland and Coastal Area on The Grou...
Research plan- The Impact of Land-Use in Lowland and Coastal Area on The Grou...Research plan- The Impact of Land-Use in Lowland and Coastal Area on The Grou...
Research plan- The Impact of Land-Use in Lowland and Coastal Area on The Grou...Putika Ashfar Khoiri
 
The stream power variation in a GIS environment as an index to evaluate the m...
The stream power variation in a GIS environment as an index to evaluate the m...The stream power variation in a GIS environment as an index to evaluate the m...
The stream power variation in a GIS environment as an index to evaluate the m...pierluigi de rosa
 
Hyetograph and hydrograph analysis
Hyetograph and hydrograph analysisHyetograph and hydrograph analysis
Hyetograph and hydrograph analysisvivek gami
 
Streamflow simulation using radar-based precipitation applied to the Illinois...
Streamflow simulation using radar-based precipitation applied to the Illinois...Streamflow simulation using radar-based precipitation applied to the Illinois...
Streamflow simulation using radar-based precipitation applied to the Illinois...Alireza Safari
 
Module 2 ch-1 heytograph and hydrology analysis
Module 2 ch-1 heytograph and hydrology analysisModule 2 ch-1 heytograph and hydrology analysis
Module 2 ch-1 heytograph and hydrology analysisAnkit Patel
 
Lec.01.introduction to hydrology
Lec.01.introduction to hydrologyLec.01.introduction to hydrology
Lec.01.introduction to hydrologyEngr Yasir shah
 
River flood modelling with mike 11 case of nzoia river (budalangi) in kenya
River flood modelling with mike 11 case of nzoia river (budalangi) in kenyaRiver flood modelling with mike 11 case of nzoia river (budalangi) in kenya
River flood modelling with mike 11 case of nzoia river (budalangi) in kenyaAlexander Decker
 
The Effect of Geometry Parameters and Flow Characteristics on Erosion and Sed...
The Effect of Geometry Parameters and Flow Characteristics on Erosion and Sed...The Effect of Geometry Parameters and Flow Characteristics on Erosion and Sed...
The Effect of Geometry Parameters and Flow Characteristics on Erosion and Sed...Dr. Amarjeet Singh
 
Flood frequency analyses
Flood frequency analysesFlood frequency analyses
Flood frequency analysesvivek gami
 
Water resources engineering
Water resources engineeringWater resources engineering
Water resources engineeringhusna004
 

Similar to 2011 liongson-modeling studies flood control dams-professorial chair lecture (20)

C-039.pdf
C-039.pdfC-039.pdf
C-039.pdf
 
Rainfall Runoff Modelling on the Lower Tapi Basin using HEC-HMS
Rainfall Runoff Modelling on the Lower Tapi Basin using HEC-HMSRainfall Runoff Modelling on the Lower Tapi Basin using HEC-HMS
Rainfall Runoff Modelling on the Lower Tapi Basin using HEC-HMS
 
WATERSHED CATCHMENT.pptx
WATERSHED CATCHMENT.pptxWATERSHED CATCHMENT.pptx
WATERSHED CATCHMENT.pptx
 
Hydrological Application of Remote – Sensing and GIS for Handling of Excess R...
Hydrological Application of Remote – Sensing and GIS for Handling of Excess R...Hydrological Application of Remote – Sensing and GIS for Handling of Excess R...
Hydrological Application of Remote – Sensing and GIS for Handling of Excess R...
 
Research plan- The Impact of Land-Use in Lowland and Coastal Area on The Grou...
Research plan- The Impact of Land-Use in Lowland and Coastal Area on The Grou...Research plan- The Impact of Land-Use in Lowland and Coastal Area on The Grou...
Research plan- The Impact of Land-Use in Lowland and Coastal Area on The Grou...
 
The stream power variation in a GIS environment as an index to evaluate the m...
The stream power variation in a GIS environment as an index to evaluate the m...The stream power variation in a GIS environment as an index to evaluate the m...
The stream power variation in a GIS environment as an index to evaluate the m...
 
Hyetograph and hydrograph analysis
Hyetograph and hydrograph analysisHyetograph and hydrograph analysis
Hyetograph and hydrograph analysis
 
Streamflow simulation using radar-based precipitation applied to the Illinois...
Streamflow simulation using radar-based precipitation applied to the Illinois...Streamflow simulation using radar-based precipitation applied to the Illinois...
Streamflow simulation using radar-based precipitation applied to the Illinois...
 
Module 2 ch-1 heytograph and hydrology analysis
Module 2 ch-1 heytograph and hydrology analysisModule 2 ch-1 heytograph and hydrology analysis
Module 2 ch-1 heytograph and hydrology analysis
 
Lec.01.introduction to hydrology
Lec.01.introduction to hydrologyLec.01.introduction to hydrology
Lec.01.introduction to hydrology
 
Ijmet 10 01_182
Ijmet 10 01_182Ijmet 10 01_182
Ijmet 10 01_182
 
River flood modelling with mike 11 case of nzoia river (budalangi) in kenya
River flood modelling with mike 11 case of nzoia river (budalangi) in kenyaRiver flood modelling with mike 11 case of nzoia river (budalangi) in kenya
River flood modelling with mike 11 case of nzoia river (budalangi) in kenya
 
L7 hydrograph
L7 hydrographL7 hydrograph
L7 hydrograph
 
Hydrology.pdf
Hydrology.pdfHydrology.pdf
Hydrology.pdf
 
WATERSHED CATCHMENT.pdf
WATERSHED CATCHMENT.pdfWATERSHED CATCHMENT.pdf
WATERSHED CATCHMENT.pdf
 
Hwre en nu 35,44
Hwre en nu 35,44Hwre en nu 35,44
Hwre en nu 35,44
 
Floods
FloodsFloods
Floods
 
The Effect of Geometry Parameters and Flow Characteristics on Erosion and Sed...
The Effect of Geometry Parameters and Flow Characteristics on Erosion and Sed...The Effect of Geometry Parameters and Flow Characteristics on Erosion and Sed...
The Effect of Geometry Parameters and Flow Characteristics on Erosion and Sed...
 
Flood frequency analyses
Flood frequency analysesFlood frequency analyses
Flood frequency analyses
 
Water resources engineering
Water resources engineeringWater resources engineering
Water resources engineering
 

More from leony1948

Liongson Chair2000
Liongson Chair2000Liongson Chair2000
Liongson Chair2000leony1948
 
Daang Bakal Tren Vargas M 2003
Daang Bakal Tren Vargas M 2003Daang Bakal Tren Vargas M 2003
Daang Bakal Tren Vargas M 2003leony1948
 
Daang Bakal Tranvia Vargas M 2003
Daang Bakal Tranvia Vargas M 2003Daang Bakal Tranvia Vargas M 2003
Daang Bakal Tranvia Vargas M 2003leony1948
 
Daang Bakal Trains Vargas M 2003
Daang Bakal Trains Vargas M 2003Daang Bakal Trains Vargas M 2003
Daang Bakal Trains Vargas M 2003leony1948
 
Liongson Vargasm 2006
Liongson Vargasm 2006Liongson Vargasm 2006
Liongson Vargasm 2006leony1948
 
Tranvia Train 2006
Tranvia Train 2006Tranvia Train 2006
Tranvia Train 2006leony1948
 
Wwf3 Liongson
Wwf3 LiongsonWwf3 Liongson
Wwf3 Liongsonleony1948
 
Train Vs Car
Train Vs CarTrain Vs Car
Train Vs Carleony1948
 
Tale Of Genji
Tale Of GenjiTale Of Genji
Tale Of Genjileony1948
 
UPLB SEARCA 2009 Sept07
UPLB SEARCA 2009 Sept07UPLB SEARCA 2009 Sept07
UPLB SEARCA 2009 Sept07leony1948
 
Paase Koh Lecture Liongson
Paase Koh Lecture LiongsonPaase Koh Lecture Liongson
Paase Koh Lecture Liongsonleony1948
 
Chair 2009 Liongson
Chair 2009 LiongsonChair 2009 Liongson
Chair 2009 Liongsonleony1948
 
Dals Up 09 Cruz
Dals Up 09 CruzDals Up 09 Cruz
Dals Up 09 Cruzleony1948
 

More from leony1948 (15)

Liongson Chair2000
Liongson Chair2000Liongson Chair2000
Liongson Chair2000
 
Pampanga Rb
Pampanga RbPampanga Rb
Pampanga Rb
 
Daang Bakal Tren Vargas M 2003
Daang Bakal Tren Vargas M 2003Daang Bakal Tren Vargas M 2003
Daang Bakal Tren Vargas M 2003
 
Daang Bakal Tranvia Vargas M 2003
Daang Bakal Tranvia Vargas M 2003Daang Bakal Tranvia Vargas M 2003
Daang Bakal Tranvia Vargas M 2003
 
Daang Bakal Trains Vargas M 2003
Daang Bakal Trains Vargas M 2003Daang Bakal Trains Vargas M 2003
Daang Bakal Trains Vargas M 2003
 
Liongson Vargasm 2006
Liongson Vargasm 2006Liongson Vargasm 2006
Liongson Vargasm 2006
 
Tranvia Train 2006
Tranvia Train 2006Tranvia Train 2006
Tranvia Train 2006
 
Wwf3 Liongson
Wwf3 LiongsonWwf3 Liongson
Wwf3 Liongson
 
Train Vs Car
Train Vs CarTrain Vs Car
Train Vs Car
 
Phil Ads
Phil AdsPhil Ads
Phil Ads
 
Tale Of Genji
Tale Of GenjiTale Of Genji
Tale Of Genji
 
UPLB SEARCA 2009 Sept07
UPLB SEARCA 2009 Sept07UPLB SEARCA 2009 Sept07
UPLB SEARCA 2009 Sept07
 
Paase Koh Lecture Liongson
Paase Koh Lecture LiongsonPaase Koh Lecture Liongson
Paase Koh Lecture Liongson
 
Chair 2009 Liongson
Chair 2009 LiongsonChair 2009 Liongson
Chair 2009 Liongson
 
Dals Up 09 Cruz
Dals Up 09 CruzDals Up 09 Cruz
Dals Up 09 Cruz
 

Recently uploaded

Bluetooth Controlled Car with Arduino.pdf
Bluetooth Controlled Car with Arduino.pdfBluetooth Controlled Car with Arduino.pdf
Bluetooth Controlled Car with Arduino.pdfngoud9212
 
Benefits Of Flutter Compared To Other Frameworks
Benefits Of Flutter Compared To Other FrameworksBenefits Of Flutter Compared To Other Frameworks
Benefits Of Flutter Compared To Other FrameworksSoftradix Technologies
 
Kotlin Multiplatform & Compose Multiplatform - Starter kit for pragmatics
Kotlin Multiplatform & Compose Multiplatform - Starter kit for pragmaticsKotlin Multiplatform & Compose Multiplatform - Starter kit for pragmatics
Kotlin Multiplatform & Compose Multiplatform - Starter kit for pragmaticscarlostorres15106
 
Key Features Of Token Development (1).pptx
Key  Features Of Token  Development (1).pptxKey  Features Of Token  Development (1).pptx
Key Features Of Token Development (1).pptxLBM Solutions
 
Vertex AI Gemini Prompt Engineering Tips
Vertex AI Gemini Prompt Engineering TipsVertex AI Gemini Prompt Engineering Tips
Vertex AI Gemini Prompt Engineering TipsMiki Katsuragi
 
Install Stable Diffusion in windows machine
Install Stable Diffusion in windows machineInstall Stable Diffusion in windows machine
Install Stable Diffusion in windows machinePadma Pradeep
 
Unblocking The Main Thread Solving ANRs and Frozen Frames
Unblocking The Main Thread Solving ANRs and Frozen FramesUnblocking The Main Thread Solving ANRs and Frozen Frames
Unblocking The Main Thread Solving ANRs and Frozen FramesSinan KOZAK
 
Tech-Forward - Achieving Business Readiness For Copilot in Microsoft 365
Tech-Forward - Achieving Business Readiness For Copilot in Microsoft 365Tech-Forward - Achieving Business Readiness For Copilot in Microsoft 365
Tech-Forward - Achieving Business Readiness For Copilot in Microsoft 3652toLead Limited
 
Pigging Solutions in Pet Food Manufacturing
Pigging Solutions in Pet Food ManufacturingPigging Solutions in Pet Food Manufacturing
Pigging Solutions in Pet Food ManufacturingPigging Solutions
 
Unraveling Multimodality with Large Language Models.pdf
Unraveling Multimodality with Large Language Models.pdfUnraveling Multimodality with Large Language Models.pdf
Unraveling Multimodality with Large Language Models.pdfAlex Barbosa Coqueiro
 
Build your next Gen AI Breakthrough - April 2024
Build your next Gen AI Breakthrough - April 2024Build your next Gen AI Breakthrough - April 2024
Build your next Gen AI Breakthrough - April 2024Neo4j
 
Transcript: New from BookNet Canada for 2024: BNC BiblioShare - Tech Forum 2024
Transcript: New from BookNet Canada for 2024: BNC BiblioShare - Tech Forum 2024Transcript: New from BookNet Canada for 2024: BNC BiblioShare - Tech Forum 2024
Transcript: New from BookNet Canada for 2024: BNC BiblioShare - Tech Forum 2024BookNet Canada
 
Designing IA for AI - Information Architecture Conference 2024
Designing IA for AI - Information Architecture Conference 2024Designing IA for AI - Information Architecture Conference 2024
Designing IA for AI - Information Architecture Conference 2024Enterprise Knowledge
 
APIForce Zurich 5 April Automation LPDG
APIForce Zurich 5 April  Automation LPDGAPIForce Zurich 5 April  Automation LPDG
APIForce Zurich 5 April Automation LPDGMarianaLemus7
 
WordPress Websites for Engineers: Elevate Your Brand
WordPress Websites for Engineers: Elevate Your BrandWordPress Websites for Engineers: Elevate Your Brand
WordPress Websites for Engineers: Elevate Your Brandgvaughan
 
Science&tech:THE INFORMATION AGE STS.pdf
Science&tech:THE INFORMATION AGE STS.pdfScience&tech:THE INFORMATION AGE STS.pdf
Science&tech:THE INFORMATION AGE STS.pdfjimielynbastida
 
Connect Wave/ connectwave Pitch Deck Presentation
Connect Wave/ connectwave Pitch Deck PresentationConnect Wave/ connectwave Pitch Deck Presentation
Connect Wave/ connectwave Pitch Deck PresentationSlibray Presentation
 
Gen AI in Business - Global Trends Report 2024.pdf
Gen AI in Business - Global Trends Report 2024.pdfGen AI in Business - Global Trends Report 2024.pdf
Gen AI in Business - Global Trends Report 2024.pdfAddepto
 

Recently uploaded (20)

Bluetooth Controlled Car with Arduino.pdf
Bluetooth Controlled Car with Arduino.pdfBluetooth Controlled Car with Arduino.pdf
Bluetooth Controlled Car with Arduino.pdf
 
Benefits Of Flutter Compared To Other Frameworks
Benefits Of Flutter Compared To Other FrameworksBenefits Of Flutter Compared To Other Frameworks
Benefits Of Flutter Compared To Other Frameworks
 
Kotlin Multiplatform & Compose Multiplatform - Starter kit for pragmatics
Kotlin Multiplatform & Compose Multiplatform - Starter kit for pragmaticsKotlin Multiplatform & Compose Multiplatform - Starter kit for pragmatics
Kotlin Multiplatform & Compose Multiplatform - Starter kit for pragmatics
 
Key Features Of Token Development (1).pptx
Key  Features Of Token  Development (1).pptxKey  Features Of Token  Development (1).pptx
Key Features Of Token Development (1).pptx
 
Vertex AI Gemini Prompt Engineering Tips
Vertex AI Gemini Prompt Engineering TipsVertex AI Gemini Prompt Engineering Tips
Vertex AI Gemini Prompt Engineering Tips
 
Install Stable Diffusion in windows machine
Install Stable Diffusion in windows machineInstall Stable Diffusion in windows machine
Install Stable Diffusion in windows machine
 
Unblocking The Main Thread Solving ANRs and Frozen Frames
Unblocking The Main Thread Solving ANRs and Frozen FramesUnblocking The Main Thread Solving ANRs and Frozen Frames
Unblocking The Main Thread Solving ANRs and Frozen Frames
 
Tech-Forward - Achieving Business Readiness For Copilot in Microsoft 365
Tech-Forward - Achieving Business Readiness For Copilot in Microsoft 365Tech-Forward - Achieving Business Readiness For Copilot in Microsoft 365
Tech-Forward - Achieving Business Readiness For Copilot in Microsoft 365
 
Pigging Solutions in Pet Food Manufacturing
Pigging Solutions in Pet Food ManufacturingPigging Solutions in Pet Food Manufacturing
Pigging Solutions in Pet Food Manufacturing
 
Unraveling Multimodality with Large Language Models.pdf
Unraveling Multimodality with Large Language Models.pdfUnraveling Multimodality with Large Language Models.pdf
Unraveling Multimodality with Large Language Models.pdf
 
Build your next Gen AI Breakthrough - April 2024
Build your next Gen AI Breakthrough - April 2024Build your next Gen AI Breakthrough - April 2024
Build your next Gen AI Breakthrough - April 2024
 
Transcript: New from BookNet Canada for 2024: BNC BiblioShare - Tech Forum 2024
Transcript: New from BookNet Canada for 2024: BNC BiblioShare - Tech Forum 2024Transcript: New from BookNet Canada for 2024: BNC BiblioShare - Tech Forum 2024
Transcript: New from BookNet Canada for 2024: BNC BiblioShare - Tech Forum 2024
 
Vulnerability_Management_GRC_by Sohang Sengupta.pptx
Vulnerability_Management_GRC_by Sohang Sengupta.pptxVulnerability_Management_GRC_by Sohang Sengupta.pptx
Vulnerability_Management_GRC_by Sohang Sengupta.pptx
 
DMCC Future of Trade Web3 - Special Edition
DMCC Future of Trade Web3 - Special EditionDMCC Future of Trade Web3 - Special Edition
DMCC Future of Trade Web3 - Special Edition
 
Designing IA for AI - Information Architecture Conference 2024
Designing IA for AI - Information Architecture Conference 2024Designing IA for AI - Information Architecture Conference 2024
Designing IA for AI - Information Architecture Conference 2024
 
APIForce Zurich 5 April Automation LPDG
APIForce Zurich 5 April  Automation LPDGAPIForce Zurich 5 April  Automation LPDG
APIForce Zurich 5 April Automation LPDG
 
WordPress Websites for Engineers: Elevate Your Brand
WordPress Websites for Engineers: Elevate Your BrandWordPress Websites for Engineers: Elevate Your Brand
WordPress Websites for Engineers: Elevate Your Brand
 
Science&tech:THE INFORMATION AGE STS.pdf
Science&tech:THE INFORMATION AGE STS.pdfScience&tech:THE INFORMATION AGE STS.pdf
Science&tech:THE INFORMATION AGE STS.pdf
 
Connect Wave/ connectwave Pitch Deck Presentation
Connect Wave/ connectwave Pitch Deck PresentationConnect Wave/ connectwave Pitch Deck Presentation
Connect Wave/ connectwave Pitch Deck Presentation
 
Gen AI in Business - Global Trends Report 2024.pdf
Gen AI in Business - Global Trends Report 2024.pdfGen AI in Business - Global Trends Report 2024.pdf
Gen AI in Business - Global Trends Report 2024.pdf
 

2011 liongson-modeling studies flood control dams-professorial chair lecture

  • 1. HYDROLOGICAL MODELING STUDIES FOR PROPOSED FLOOD- CONTROL DAMS IN THE MARIKINA RIVER BASIN Leonardo Q. Liongson Team Energy Professorial Chair & Professor, Institute of Civil Engineering and National Hydraulic Research Center, University of the Philippines, Diliman, Quezon City, Philippines Abstract Tropical Storm Ondoy (Ketsana) crossed Metro Manila and the adjacent river basins in a late wet-season episode of 2009, starting in the evening of September 25, 2009 and continuing into the next day of September 26, 2009. TS Ondoy brought very intense and heavy rainfall to the region - record amounts of rains fell over a very short time period of 12 hours to 24 hours, which are estimated to occur at an average annual frequency of 1 in 100 years or even higher, depending on the measuring location in the region. The rains generated record-magnitude flood flows and inundation in the Pasig-Marikina River Basin in Metro Manila, and the Laguna de Bay region. This paper describes the application of the distributed watershed rainfall-runoff model SWATCH in order to simulate the TS Ondoy floods and other floods of lower return periods (2 years to 100 years) in the upper Marikina River Basin, using as input the spatially-interpolated rainfall network data and available topographic, soil/geology and river-geometry data. The SWATCH model consists of a tree-network of several variable rectangular surface/soil/aquifer storage nodes and overland/channel flow links, with accounting of soil moisture, evapotranspiration, infiltration, and recharge to groundwater, and routing of overland and channel flows, interflow and baseflow into aggregated total streamflows. Using the model-computed inflow flood hydrographs, the options of single or cascade of flood-control storage dams (with selected reservoir-storage and spillway capacities) for attenuation of floods peaks and volumes, and downstream flood hazard reduction are initially evaluated by flood-routing studies. Introduction Tropical Storm Ondoy (Ketsana) crossed Metro Manila and the adjacent river basins in a late wet-season episode of 2009, starting in the evening of September 25, 2009 and continuing into the next day of September 26, 2009. TS Ondoy brought very intense and heavy rainfall to the region - record amounts of rains fell over a very short time period of 12 hours to 24 hours, which are estimated to occur at an average annual frequency of 1 in 100 years or even higher, depending on the measuring location in the region. The rains generated record-magnitude flood flows and inundation in the Pasig-Marikina River Basin in Metro Manila, and the Laguna de Bay region. The hydrological and hydraulic aspects of the Ts Ondoy (Ketsana) extreme event (storm rainfall, floods) were described previously by the author (Liongson, 2010) and the flood management alternatives were also discussed in the same article. With the purpose of evaluating the performance of the proposed flood mitigation measure which is a high Marikina Dam or else a cascase of two or three flood-control dams, the two hydrological modeling applications for the upper Marikina River Basin were undertaken, as reported in this paper: (1) The application of the distributed watershed rainfall-runoff model SWATCH in order to simulate the TS Ondoy floods and other floods of lower return periods (2 years to 100 years) in the upper Marikina River Basin, using as input the spatially-interpolated rainfall network data and available topographic, soil/geology and river-geometry data. The SWATCH model consists of a tree-network of several variable rectangular surface/soil/aquifer storage nodes and overland/channel flow links, with accounting of soil moisture, evapotranspiration, infiltration, and recharge to groundwater, and routing of overland and channel flows, interflow and aquifer return flow (baseflow) into aggregated total streamflows; (2) The flood routing studies wherein, by using the model-computed inflow flood hydrographs, and selecting the options of single or cascade of flood-control storage dams (with selected reservoir-storage and
  • 2. spillway capacities), the attenuation of floods peaks and flood volumes and the downstream flood hazard reduction are initially evaluated. The SWATCH Model SWATCH is a mathematical distributed watershed model developed by Morel-Seytoux et. al. (1987) to physically simulate a stream-aquifer system for a storm event. SWATCH utilizes basin division in order to model spatial variability. Rainfall in different rainfall stations is then distributed to these divisions by means of weights and runoff is computed through the use of its various modules for runoff computation such as rainfall, storage, infiltration, excess rainfall, soil moisture storage, evapotranspiration, overland flow, interflow storage and discharge, groundwater recharge flow, stream-aquifer return flow and channel flow modules. The sum of overland flow, interflow and aquifer return flow is computed as total lateral inflow to the river channels (Figure 1). Figure 1 – Cross-sectional diagram of the watershed hydrologic simulation model SWATCH (1988). Without going into the mathematical details of the other components of the hydrologic cycle (evapotranspiration, infiltration, soil moisture storage), a brief summary of the equations for overland flow, river-channel flow, interflow and aquifer return flow (baseflow) is provided below: 2
  • 3. Kinematic model of overland flow: ∂h ∂  1 5 / 3 1/ 2  +  h SV  = i − f ∂t ∂x  n V  (x,t) = distance and time coordinates. 1 5 / 3 1/ 2 q= h SV = overland flow discharge/unit width. nV h = water retention depth of overland flow. i = rainfall intensity on overland surface plain. f = infiltration rate on overland surface plain. n V = Manning's roughness coefficient of overland surface plane . SV = slope of overland surface plain Kinematic model of river-channel flow: ∂H ∂  1  B +  BH SR  = q − Bf 5 / 3 1/ 2 ∂t ∂x  n R  1 Q= BH5 / 3S1/ 2 = river-channel discharge. R nR H = water depth of river-channel flow. B = width of river channel. q = specific overland flow discharge. f = bed infiltration rate. n R = Manning's roughness coefficient of river bed. SR = slope of river channel bed. Darcy-flow Kinematic model of interflow or upper saturated zone: ∂h ∂ n I I + [ K I h ISI ] = fex − feff ∂t ∂x qI = K I h ISI = interflow discharge at river intersection. h I = saturated depth of interflow or upper saturated zone. fex = excess infiltration rate from upper unsaturated zone (vadose zone). feff = effective infiltration rate from interflow or upper saturated zone. K I = horizontal hydraulic conductivity of interflow zone. SI = slope of interflow plane. n I = effective drainable porosity of interflow zone. 3
  • 4. Darcy-flow Groundwater model of aquifer or lower saturated zone: ∂hG ∂  ∂h G  SG + TG = rG ∂t ∂x   ∂x   ∂h qG = TG G = groundwater return flow or baseflow at river intersection. ∂x h G = saturated depth of aquifer or lower saturated zone. rG = aquifer recharge rate. SG = effective drainable aquifer porosity. TG = aquifer transmissivity. Rainfall Interpolation and Depth-Duration-Frequency Relations Figure 2 – The map of the Marikina River Basin, showing the sub-basin divisions and river network of 84 reaches within the watershed. The rainfall data network used in the study consists of four (4) short-record EFCOS climatic stations (Boso Boso, Mt. Oro, Aries and Nangka) and one PAGASA Science Garden long-record synoptic stations. The hourly rainfall data observed at the rainfall stations are used to interpolate point rainfall at the centroids (x,y) of the 84 sub-basins of the watershed, using the unbiased multiquadric method (Balascio, 2001) as described below. The T-year annual maximum rainfall depth for Science Garden is represented by the Extreme Value Type or Gumbel distribution, derived after frequency analysis of the 38 years of annual maximum records for storm durations ranging from 10 minutes to 48 hours. The result is the so-called Rainfall-Duration-Frequency or RDF relations. The RDF relation for each short-term EFCOS station is extended or derived (by transposition) by multiplying the Science Garden RDF value of given duration by the ratio of maximum storm depths for the same duration, measured during the same TS Ketsana storm event, at the short-term EFCOS station and the Science Garden synoptic station. The rainfall estimation equations are presented below. 4
  • 5. Unbiased Multiquadric Method of Rainfall Interpolation: zo = Do c + b zo = interpolated rainfall at variable point (x,y). Do = station (xi ,yi )-to-point (x,y) distance (Nx1) vector = ( (x-xi )2 +(y-yi )2 ) z = Dc + b1 z = (1xN) vector of observed rainfall at station (xi ,yi ) for i=1,2, 3...N. D = station (xi ,yi )-to-station (x j ,y j ) distance (NxN) matrix =  (xi -x j )2 +(yi -yi )2    1 t D-1 z b = bias correction = , to satisfy the condition that 1 t c=0 (zero sum of coefficients). 1 t D-1 1 c = (1xN) coefficient vector = D-1 (z-b 1) 1= (1xN) unity vector Extreme Value Type I or Gumbel Distribution (Rainfall-Duration-Frequency (RDF) relations): XT (d) = X(d) + S(d) K T = T-year annual maximum rainfall depth of duration, d. x k (d)= k-th observed annual maximum rainfall of duration,d. X(d) = sample mean annual maximum rainfall depth of duration, d. 1 N = ∑ xk (d) N k =1 S(d) = sample standard deviation of annual rainfall depth of duration, d. 1/ 2  1 N 2 = ∑  xk (d) − X(d)    N-1 k = N    6  T  KT = - 0.5770 + ln ln    = Gumbel frequency factor. π    T-1   Station-to-Station RDF Transposition:  x(i,d,TS Ketsana)  XT (i, d) =   XT (j, d)  x(j,d,TS Ketsana)  XT (i, d) = T-year estimated/extended annual maximum rainfall at short-record station-i (EFCOS stations) for duration, d. XT (j, d) = T-year annual maximum rainfall at long-record station-j (Science Garden) for duration, d. x(i,d,TS Ketsana) = observed TS Ketsana maximum rainfall at short-record station-i for duration, d x(j,d,TS Ketsana) = observed TS Ketsana maximum rainfall at long-record station-j for duration, d. The RDF values aree incremented and converted into 48-hour critical storm profiles for all stations and T- year or TS Ketsana event, using the alternating-block method wherein the maximum rainfall intensity occurs in the middle of the 48-hours storm and lower intensities occur before and the after the time of peak intensity. Using the SWATCH model and the spatially interpolated hourly sub-basin rainfall over the 84 sub-basins, the streamflow flood hydrographs are computed for the TS Ketana event and also for return periods of 2, 5, 10, 25, 50 and 100 years. The simulated flood hydrographs (in terms of water level) are compared with the observed water level at the river stations of Montalban, Nangka, Sto. Niño (Figure 3, for example) and Rosario Junction. As examples, the simulated flood hydrographs at Montalban and Sto. Niño river station during the TS Ketsana storm event are shown in Figure 4. 5
  • 6. Figure 3 – Comparison between SWATCH-computed flood hydrograph (converted from discharge to water level using the DPWH-JICA discharge rating equations as shown) and the observed water level of Marikina River at Sto. Niño station, which both reached levels between 12 noon and 4 p.m. on 26 September 2009. The difference in results can be attributed to the limitation that the kinematic channel flow model used is a one-dimensional channel flow model which does not include an extensive flood plain (considered in two- dimensional inundation models) affected by river overflows, floodplain storage and local patterns of tributary flows. Figure 4 – Examples of output SWATCH-computed flood hydrographs during the TS Ketsana storm event, at the locations of the EFCOS Montalban and Sto. Niño station water-level stations. 6
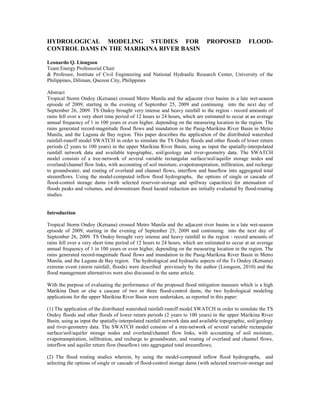
  • 7. Flood Routing for Alternative Flood-control Dam Alternatives. The alternatives for flood-control dams as flood mitigation measures in the upper Marikina River Basin have been proposed in three prospective dam locations (as single dams or cascade of two or three dams) (Figure 5). Using geologic and contour maps, potential locations for a flood mitigation reservoir are located at the proposed project site of the Marikina Dam, along Wawa River, near the Montalban Bridge and Wawa dam. The other two are found along Boso-Boso River, near Mt. Tayabasan and Mt. Baytangan, respectively, in the mountainous regions of the river basin. Figure 5. Proposed locations of flood-control dams at Marikina Dam A (at Wawa River), Boso Boso Dam A and Boso Boso Dam B. The flood routing studies are conducted using the hydrological storage routing method. Given the SWATCH-computed inflow flood hydrographs into a dam-reservoir, the storage volume capacity of the reservoir (planimetered from a digital-elevation model or DEM of the river valley and watershed), and the assumed overflow spillway discharge capacity (parameterized by spillway crest elevation and crest length), the outflow (release) flood hydrographs are computed. The spillway parameters are selected in order to maximize the attenuation (reduction) of peak outflow flood discharge and the retained flood volume by reservoir storage and spillway regulation. The equations are given indicated below: Reservoir Storage Routing Equations: dS = ∑ Qin (t) − Qout (t) dt in Qin (t) = inflow discharge to reservoir from each source-in. Qout (t) = CL ( H(t) − Hc ) 3/ 2 = overflow spillway discharge (spillway rating equation). S = S(H) = reservoir storage volume as a function of H (reservoir capacity equation). H = H(t) = reservoir water surface elevation above riverbed. Hc = elevation of spillway crest above riverbed. L = width of spillway crest. C = spillway discharge coefficient. 7
  • 8. Flood Routing Results The diagrams and table of results of the flood routing computations are shown below and in the succeeding pages. Table 1 – Results of Flood Routing Studies for Single Dam Alternatives (a) Single Dam – Marikina Dam A.. (b) Single Dam – Boso Boso Dam B. (c) Single Dam – Boso Boso Dam A 8
  • 9. Figure 6 – Examples of network diagram and flood-routing inflow, outflow, stage (water surface elevation) and storage hydrographs for Single Marikina Dam A. Figure 7 – Example of network diagram and flood-routing stage (water surface elevation) hydrographs for Triple Cascade of Boso Boso Dam B, Boso Boso Dam A and Marikina Dam A. 9
  • 10. Table 2 – Results of Flood Routing Studies for Double Cascade Dam Alternatives (a) 2-Dam Cascade: Boso Boso Dam A and Marikina Dam A. (b) 2-Dam Cascade: Boso Boso Dam B and Marikina Dam A. (c) 2-Dam Cascade: Boso Boso Dam B and Boso Boso Dam A. 10
  • 11. Table 3 – Results of Flood Routing Studies for Triple Cascade Dam Alternative Discussion of Results The Upper Marikina River Basin experienced large flows during TS Ketsana in Septemebr 2009 resulting from the large amounts and high intensity of rainfall over a period of 12 to 24 hours. The updated SWATCH model applied in this study computed a TS Ketsana peak flood flow of about 5000 m3/s at Sto. Niño water-level station (slightly lower than the initial NHRC estimate of 5700 m3/s (which was based on an areally adjusted Science Garden rainfall data and not on EFCOS rainfall network data, as reported earlier by this author (Liongson, 2010)). This maximum flood discharge greatly exceeded the river bankful capacity of the river of about 900 m3/s.. There is a need to mitigate, if not prevent, the damage that future typhoons may bring to the river basin since the Upper Marikina River Basin is contributory to the flooding of Metro Manila. Calculations for the best dam design parameters show that the triple cascade dam (Table 3) is the most viable solution for the river basin, achieving a 6% attenuation to TS Ketsana flood peak inflow (from peak inflow of 2722 m3/s to peak outflow of 2566 m3/s). Based on the RDF relations derived from historical rainfall record (as inputs to SWATCH), the succeeding flood routing procedure has shown that the triple cascade dam can give a 13% attenuation to flood peak for a 100-year return period design flood (from peak inflow of 3023 m3/s to peak outflow of 2632 m3/s). It is also seen from the Tables 3 that that the selected best dam/spillway parameters can afford to store only about 3-7% of inflow flood volume. The same dam/spillway parameters afford a 30.67 m. and 31.13 m maximum water level rise (above the riverbed) for the TS Ketsana flood and 100-year flood, respectively, for a spillway crest elevation of 5 m. above the riverbed. The proposed single dam design (Table 1), Marikina Dam A, is clearly not viable, as it can only give a 1% attenuation to flood peak (with a peak outflow of 2,855 m3/s), storing only 8% of the inflow flood volume, and producing a 36.70 m. maximum water level rise (above the riverbed) for TS Ketsana flood, for a spillway crest elevation of 23 m. above the riverbed. 11
  • 12. Recommendations The created IDF curves for the EFCOS rainfall stations were done only through TS Ketsana-event- based storm transposition of the rainfall from the long-record Science Garden station. The refinement of the IDF curves could be better facilitated through the acquisition and processing of more future and historical rainfall data gathered in both EFCOS climatic and PAGASA synoptic rainfall stations. From discussions with hydraulic engineers in various fora, the proposed Marikina Dam A can not be used since it has a limestone foundation. Added to that is the proximity of the location to the Valley Fault System. A study of the geological properties and possible geotechnical solutions to the permeability and earthquake risk should be undertaken. The conclusion in this study regarding the higher values of both inflow and outflow flood discharges of Marikina Dam A differ with the proposed dam design values indicated in the DPWH report (Gatan, 2009), wherein the dam design may be able to reduce the peak flood discharge of a 100-year storm into that of a 30-year storm (from 2100 m3/s to 1500 m3/s). The data used by both studies should be checked to establish a better grasp of the viability of a dam as a solution for the river basin flooding. Although surveys of the proposed dam locations and other potential dam locations could be undertaken to refine the dam design parameters (reservoir volume capacity, spillway crest elevation and length) it is anticipated that the said refinement will only be a small increment over the previously computed volume capacity based on the DEM. It is strongly recommended that other flood mitigation measures should be studied in the river basin, since the proposed dam designs are ineffective in reducing peak flows and store only a small portion of flood volumes for return periods of 25, 50 and 100 years, and for TS Ketsana event, with the added risk of a huge rise of water levels in areas upstream of the said dam locations. Due to the limitation in the ability of the proposed flood-control dams to reduce flood peaks and volumes, resulting from the low viable reservoir volume capacities in the upper Marikina River Basin, it is wise to recommend that other feasible mitigation measures be seriously planned and implemented for the Pasig-Marikina River Basin as a whole: both structural and non-structural, especially downstream, measures in the populated areas of the basin. These measures include the following: 1. Concerted push to undertake regional-wide and basin-wide typhoon, rainfall and flood monitoring, modeling, forecasting, warning and community-based action programs. This should include the well-informed detailed interfacing and connectivity of local drainage works and major river channel and lakeshore projects, affecting the operations of floodways, control structures such as flood gates and weirs, and pumping stations. 2. Review, revision, updating and upgrading (if necessary) of the design and plans of ongoing channel improvement and other river engineering projects (riverbank protection, diking, floodways, widening and dredging, if ever) in view of the updated hydrological estimates of extreme rainfall and flood magnitudes. 3. City-level feasibility studies on the adoption and construction of temporary flood detention basins in open, flat and low areas near river channels (such as parks and wetlands), which will accept river overflows and, through provision of shaft spillways, divert and store excess flood waters in underground water cisterns, with added benefit as storage for raw water supply sources. References Balascio, C., 2001. Multiquadric Equations and Optimal Areal Rainfall Estimation. Journal of Hydrologic Engineering, pp.498-505. Liongson, L., 2010, Flood Mitigation in Metro Manila, Philippine Engineering Journal, June 2010 issue, National Engineering Center, UP Diliman. Morel-Seytoux et al., 1987. SWATCH: A Multi Process Watershed Model for Simulation of Surface and Subsurface Flows in a Soil-Aquifer-Stream Hydrologic Syste, Colorado State University. Gatan, Patrick., 2009. Learning from the Ondoy Flood – A Dialogue with Experts. DPWH. 14 October 2009, Manila, Philippines. Asian Development Bank website: http://www.adb.org/water/topics/pdfs/OKF-SSantiago.pdf. 12
  • 13. 13