SlideShare a Scribd company logo
12-1

    GEOG415                   Lecture 12: Flood Analysis
Flood probability analysis
It aims at estimating the magnitude of floods that will occur at
a given probability, for example once in 100 year.
Usefulness?


Methods of analysis
1. Obtain the record of flood. What kind?
   HYDAT data base (Extreme Flow).
2. Rank the record and assign the exceedence probability.
    → see page 2-7 and 2-8.
3. Plot them on a probability chart (e.g. Gumbel)
4. Draw a straight line that represents the data set.


  Dunne and Leopold (1978, Fig. 10-14)
12-2


A map of the areas flooded by the 70-year flood of Bow River. (Montreal Engineering Co., 1973.
City of Calgary flood study)
12-3

In Fig. 10-14 why does the straight line ignore the highest
point?


Is it possible that a 100-year flood occurs in a 30-year
observation period? How will it show up on the Gumbel plot?
Is it OK to estimate 100-year flood from 30-year data by
extrapolation?
Error estimation
Suppose a 30-year annual maximum series having a standard
deviation (SD) of 16,000 cfs. The upper bound of the 90 %
confidence limit of the 10-year flood is given by (see Table
10-12, next page):
   SD × 0.50 = 8,000 cfs


                                         8,000 cfs


 Dunne and Leopold (1978, Fig. 10-17)
12-4

                          Dunne and Leopold (1978, Table 10-12)


Every year, there is a 5 % chance of having a 20-year flood .
What is the probability of having a 20-year flood in the next
five years?
  → Equation (2-5) in Dunne and Leopold (1978).


We have not had a 70-year flood for 71 years. What is the
probability of having a 70-year flood next year?
12-5

Mean annual flood
Gumbel extreme probability distribution is designed so that
the average flood (arithmetic mean of all floods in the record)
has a theoretical return period of 2.33 years.
Using this property, mean annual flood can be determined
graphically from a Gumbel chart.


Homogeneity of flood records
The probability theory commonly used in hydrological
analysis assumes that the data are homogeneous.
What does it mean?


Partial-duration flood series
How is it different from annual        Dunne and Leopold (1978, Table 10-13)
maximum series?


What is the actual return period
of bankfull discharge?
12-6

Regional flood-frequency analysis
Planners often require the flood frequency for ungauged
basins. →            Need for regional frequency curves.
Assumption:
For large regions of homogeneous climate, vegetation, and
topography, individual basins covering a wide range of
drainage areas have similar flood-frequency characteristics


 Dunne and Leopold (1978, Fig. 10-19)
                   Ratio of flood to the mean annual flood


                                                             1   1.5         2.33                5   10   25
Dunne and Leopold (1978, Fig. 10-20a)                                  Recurrence interval (years)


Floods having specified recurrence interval can be estimated
from the mean annual flood.
12-7

How is mean annual flood estimated?


Is this method applicable
in mountainous regions?


                                     Dunne and Leopold (1978, Fig. 10-21)


Effects of urbanization
What are expected effects?


                                                      tp: lag to peak
                             tp
                                                      lc: centroid lag

                              lc


                                   Dunne and Leopold (1978, Fig. 10-25)
12-8

Urban sewer systems reduce centroid lag time. Consequences?


                                                             S: slope


                              Dunne and Leopold (1978, Fig. 10-26)


                              Dunne and Leopold (1978, Fig. 10-28)
12-9

The Unit Hydrograph
When the total amount of runoff is given, how do we estimate
the temporal distribution of runoff?
  e.g time lag to peak, duration, etc.
The unit hydrograph is the hydrograph of one inch of storm
runoff generated by a rainstorm of fairly uniform intensity
occurring within a specific period of time (e.g. one hour).
The UH theory assumes that temporal distribution depends on
basin size, shape, slope, etc., but is fixed from storm to storm.
Is this reasonable?


Once the UH is established for a basin, hydrographs resulting
from any amounts of runoff may be computed from the UH.

                                               Hydrograph that would
                                               result from 50.8 mm of
                                               runoff.

                                                25.4 mm of runoff
                                                generated over the basin.


                                 Dunne and Leopold (1978, Fig. 10-30)
12-10


Construction of the UH from discharge data
1. Select a few storm hydrographs resulting from fairly
uniform rain having similar duration, and separate baseflow.
2. Compute the total volume of stormflow (m3) for each
hydrograph and divide it by the basin area to obtain total
stormflow in depth unit R (mm).
3. Multiply each discharge measurement by 25.4/R so that the
total stormflow of the reduced hydrograph is equal to 25.4
mm.
4. Plot the reduced hydrographs and superimpose them, each
hydrograph beginning at the same time.
5. By trial and error, draw the unit hydrograph representing
the shape of all reduced hydrographs and having a total
stormflow of 25.4 mm.
12-11

UH’s for storms of various durations
Principles of superposition:
Four-hour UH consists of the superposition of two two-hour
UH. It needs to be divided by a factor of two to adjust for the
total stormflow (25.4 mm).
Is this reasonable? Under what condition?


                                  Dunne and Leopold (1978, Fig. 10-32)
12-12

S-curve method
Commonly used to derive hydrographs resulting from
arbitrary-duration storms.
In this example, the
original UH was derived
for 2.5-hr storm.
It is superimposed
successively at 2.5-hr
interval, resulting in a S-
shaped curve.
                                 Dunne and Leopold (1978, Fig. 10-33)
What does it represent?

Two S-curves are now plotted with an offset of 1 hour (a).
The difference between the two S-curves represents another
hydrograph (b), which is adjusted for the total stormflow to
yield the UH of 1-hour storm (c).


                                Dunne and Leopold (1978, Fig. 10-34)
12-13

Synthetic UH’s
How can we obtain the UH for an ungauged basin?


Assumptions?


                              Dunne and Leopold (1978, Fig. 10-35)


Snyder method
Correlation between the lag to peak (tp, hours) and basin
length.
  tp = Ct (LLc)0.3
  L: Length of main stream from outlet to divide (miles)
  Lc: Distance from the outlet to a point on the stream
      nearest the centroid of the basin.
  Ct: Empirical constant (0.3-10)
Duration of rainstorm (Dr) and tp were correlated by:
  Dr = 0.18tp
in Snyder’s study. → may not be true in other regions.
12-14


The peak discharge (Qpk, ft3 s-1) is given by:
  Qpk = CpA/tp
  A: Basin area (mile2)
  Cp: Empirical constant (370-405)
The duration (tb) of the UH could be given by:
  tb = 72 + 3tp         or     tb = 5(tp + 0.5Dr)
The width of the UH at 75 % (W75, hour) of the peak flow is
given by:
  W75 = 440A/Qpk1.08
Similarly, W50 is given by:
  W50 = 770A/Qpk1.08
From tp, Dr, tb, Qpk, W75, and W50, the UH can now be
synthesized.


                              Dunne and Leopold (1978, Fig. 10-38)
12-15

Triangular UH by Soil Conservation Service

An alternative method
assumes a triangular shape of
the UH. The detailed method
of construction is given in
Dunne and Leopold (1978,
p.342-343).
In this case, the time of rise
to peak (Tr) is given by:
                                  Dunne and Leopold (1978, Fig. 10-39)
  Tr = Dr/2 + tp


Dimensionless UH by Soil Conservation Service
This method uses dimensionless time (T/Tp) and discharge
(Q/Qpk) to plot the UH.

Q and T for each basin can
be calculated from Fig.10-40
once Tp and Qpk are given.
Tp is dependent on the
geometry and dimension of
the basin. Qpk is dependent
on the amount of runoff,
which is estimated from the
                                  Dunne and Leopold (1978, Fig. 10-40)
curve number method.
12-16


Both methods by SCS were developed for small agricultural
watersheds.


Example
A 5-km2, reasonably flat watershed has a curve number of 88.
Estimated time of concentration (tc, see page 11-14) is 30
minutes. Generate a synthetic hydrograph resulting from 51
mm of rain applied uniformly over a two-hour period.
  Runoff (R) = 25 mm       using the curve number method
  Tp = 0.5Dr + 0.6tc = 78 min = 1.3 hr from DL, Eq.(10-20)
The dimensionless UH is designed so that
  Qpk ≅ 0.5R/Tp = 0.5 × 25 / 1.3 = 9.6 mm hr-1
In terms of discharge,
  Qpk = 15.6 mm hr-1 × 5 km2 = 48000 m3 hr-1 = 13 m3 s-1
                                                13
                           Discharge (m3 s-1)


                                                0
                                                     1.3
                                                      Time (hour)

More Related Content

What's hot

DAD Analysis.pptx
DAD Analysis.pptxDAD Analysis.pptx
DAD Analysis.pptx
GayatriDarandale
 
Synthetic unit hydrograph
Synthetic unit hydrographSynthetic unit hydrograph
Synthetic unit hydrograph
uzma shaikh
 
Idf
IdfIdf
Module 2 ch-1 heytograph and hydrology analysis
Module 2 ch-1 heytograph and hydrology analysisModule 2 ch-1 heytograph and hydrology analysis
Module 2 ch-1 heytograph and hydrology analysis
Ankit Patel
 
Estimating Missing Rainfall Data.pptx
Estimating Missing Rainfall Data.pptxEstimating Missing Rainfall Data.pptx
Estimating Missing Rainfall Data.pptx
RajdipPaul5
 
Hydrology (Estimation of peak flood discharge)
Hydrology (Estimation of peak flood discharge)Hydrology (Estimation of peak flood discharge)
Hydrology (Estimation of peak flood discharge)
Latif Hyder Wadho
 
APPLICATIONS OF ARC SWAT MODEL FOR HYDROLOGICAL MODELLING
APPLICATIONS OF ARC SWAT MODEL FOR HYDROLOGICAL MODELLINGAPPLICATIONS OF ARC SWAT MODEL FOR HYDROLOGICAL MODELLING
APPLICATIONS OF ARC SWAT MODEL FOR HYDROLOGICAL MODELLINGAbhiram Kanigolla
 
Flood risk mapping using GIS and remote sensing
Flood risk mapping using GIS and remote sensingFlood risk mapping using GIS and remote sensing
Flood risk mapping using GIS and remote sensing
Rohan Tuteja
 
Sediment Transport
Sediment TransportSediment Transport
Sediment TransportBen Watson
 
Class lecture on Hydrology by Rabindra Ranjan saha Lecture 10
Class lecture on Hydrology by Rabindra Ranjan saha Lecture 10Class lecture on Hydrology by Rabindra Ranjan saha Lecture 10
Class lecture on Hydrology by Rabindra Ranjan saha Lecture 10
World University of Bangladesh
 
Hydrology and hydraulics for design design
Hydrology and hydraulics for design designHydrology and hydraulics for design design
Hydrology and hydraulics for design design
avirup naskar
 
sedimentation
sedimentationsedimentation
sedimentation
tp jayamohan
 
Unit hydrograph
Unit hydrographUnit hydrograph
Unit hydrograph
Satish Taji
 
L7 hydrograph
L7 hydrographL7 hydrograph
L7 hydrograph
MEHEDIMASUM2
 
River engineering flood design
River engineering flood designRiver engineering flood design
River engineering flood design
Sharifah Ain
 
Analysis of runoff for vishwamitri river watershed using scs cn method and ge...
Analysis of runoff for vishwamitri river watershed using scs cn method and ge...Analysis of runoff for vishwamitri river watershed using scs cn method and ge...
Analysis of runoff for vishwamitri river watershed using scs cn method and ge...
vishvam Pancholi
 
Drought management and water harvesting
Drought management and water harvesting Drought management and water harvesting
Drought management and water harvesting
Yash Patel
 
Measurement of precipitation (rainfall )
Measurement of precipitation (rainfall )Measurement of precipitation (rainfall )
Measurement of precipitation (rainfall )
SULAKSHYA GAUR
 
Practical Applications of Hydrology
Practical Applications of HydrologyPractical Applications of Hydrology
Practical Applications of Hydrology
yarrakula
 

What's hot (20)

DAD Analysis.pptx
DAD Analysis.pptxDAD Analysis.pptx
DAD Analysis.pptx
 
Synthetic unit hydrograph
Synthetic unit hydrographSynthetic unit hydrograph
Synthetic unit hydrograph
 
Idf
IdfIdf
Idf
 
Module 2 ch-1 heytograph and hydrology analysis
Module 2 ch-1 heytograph and hydrology analysisModule 2 ch-1 heytograph and hydrology analysis
Module 2 ch-1 heytograph and hydrology analysis
 
Estimating Missing Rainfall Data.pptx
Estimating Missing Rainfall Data.pptxEstimating Missing Rainfall Data.pptx
Estimating Missing Rainfall Data.pptx
 
Hydrology (Estimation of peak flood discharge)
Hydrology (Estimation of peak flood discharge)Hydrology (Estimation of peak flood discharge)
Hydrology (Estimation of peak flood discharge)
 
APPLICATIONS OF ARC SWAT MODEL FOR HYDROLOGICAL MODELLING
APPLICATIONS OF ARC SWAT MODEL FOR HYDROLOGICAL MODELLINGAPPLICATIONS OF ARC SWAT MODEL FOR HYDROLOGICAL MODELLING
APPLICATIONS OF ARC SWAT MODEL FOR HYDROLOGICAL MODELLING
 
Flood risk mapping using GIS and remote sensing
Flood risk mapping using GIS and remote sensingFlood risk mapping using GIS and remote sensing
Flood risk mapping using GIS and remote sensing
 
Sediment Transport
Sediment TransportSediment Transport
Sediment Transport
 
Class lecture on Hydrology by Rabindra Ranjan saha Lecture 10
Class lecture on Hydrology by Rabindra Ranjan saha Lecture 10Class lecture on Hydrology by Rabindra Ranjan saha Lecture 10
Class lecture on Hydrology by Rabindra Ranjan saha Lecture 10
 
Hydrology and hydraulics for design design
Hydrology and hydraulics for design designHydrology and hydraulics for design design
Hydrology and hydraulics for design design
 
sedimentation
sedimentationsedimentation
sedimentation
 
Unit hydrograph
Unit hydrographUnit hydrograph
Unit hydrograph
 
03 darcys law
03 darcys law03 darcys law
03 darcys law
 
L7 hydrograph
L7 hydrographL7 hydrograph
L7 hydrograph
 
River engineering flood design
River engineering flood designRiver engineering flood design
River engineering flood design
 
Analysis of runoff for vishwamitri river watershed using scs cn method and ge...
Analysis of runoff for vishwamitri river watershed using scs cn method and ge...Analysis of runoff for vishwamitri river watershed using scs cn method and ge...
Analysis of runoff for vishwamitri river watershed using scs cn method and ge...
 
Drought management and water harvesting
Drought management and water harvesting Drought management and water harvesting
Drought management and water harvesting
 
Measurement of precipitation (rainfall )
Measurement of precipitation (rainfall )Measurement of precipitation (rainfall )
Measurement of precipitation (rainfall )
 
Practical Applications of Hydrology
Practical Applications of HydrologyPractical Applications of Hydrology
Practical Applications of Hydrology
 

Viewers also liked

Flood estimation
Flood estimation Flood estimation
Flood estimation
RAJ BAIRWA
 
Flood frequency analysis of river kosi, uttarakhand, india using statistical ...
Flood frequency analysis of river kosi, uttarakhand, india using statistical ...Flood frequency analysis of river kosi, uttarakhand, india using statistical ...
Flood frequency analysis of river kosi, uttarakhand, india using statistical ...
eSAT Journals
 
Vcg Com Credentials 2010
Vcg Com Credentials 2010Vcg Com Credentials 2010
Vcg Com Credentials 2010
doanhuuduc
 
Shahid Lecture-7- MKAG1273
Shahid Lecture-7- MKAG1273Shahid Lecture-7- MKAG1273
Shahid Lecture-7- MKAG1273
nchakori
 
Routing
RoutingRouting
Collabera Presentation Feb 09
Collabera Presentation Feb 09Collabera Presentation Feb 09
Collabera Presentation Feb 09Lynn Forte
 
Channel routing
Channel routingChannel routing
Channel routing
sanjay bahuguna
 
2150602 hwre 150113106007-008 (HYDROLOGY & WATER RESOURCE ENGINEERING)
2150602 hwre 150113106007-008 (HYDROLOGY & WATER RESOURCE ENGINEERING)2150602 hwre 150113106007-008 (HYDROLOGY & WATER RESOURCE ENGINEERING)
2150602 hwre 150113106007-008 (HYDROLOGY & WATER RESOURCE ENGINEERING)
Jaydeep Dave
 
CE-235 EH Coursepack 2010
CE-235 EH Coursepack 2010CE-235 EH Coursepack 2010
CE-235 EH Coursepack 2010Sajjad Ahmad
 
Flood routing
Flood routingFlood routing
Flood routing
vivek gami
 

Viewers also liked (10)

Flood estimation
Flood estimation Flood estimation
Flood estimation
 
Flood frequency analysis of river kosi, uttarakhand, india using statistical ...
Flood frequency analysis of river kosi, uttarakhand, india using statistical ...Flood frequency analysis of river kosi, uttarakhand, india using statistical ...
Flood frequency analysis of river kosi, uttarakhand, india using statistical ...
 
Vcg Com Credentials 2010
Vcg Com Credentials 2010Vcg Com Credentials 2010
Vcg Com Credentials 2010
 
Shahid Lecture-7- MKAG1273
Shahid Lecture-7- MKAG1273Shahid Lecture-7- MKAG1273
Shahid Lecture-7- MKAG1273
 
Routing
RoutingRouting
Routing
 
Collabera Presentation Feb 09
Collabera Presentation Feb 09Collabera Presentation Feb 09
Collabera Presentation Feb 09
 
Channel routing
Channel routingChannel routing
Channel routing
 
2150602 hwre 150113106007-008 (HYDROLOGY & WATER RESOURCE ENGINEERING)
2150602 hwre 150113106007-008 (HYDROLOGY & WATER RESOURCE ENGINEERING)2150602 hwre 150113106007-008 (HYDROLOGY & WATER RESOURCE ENGINEERING)
2150602 hwre 150113106007-008 (HYDROLOGY & WATER RESOURCE ENGINEERING)
 
CE-235 EH Coursepack 2010
CE-235 EH Coursepack 2010CE-235 EH Coursepack 2010
CE-235 EH Coursepack 2010
 
Flood routing
Flood routingFlood routing
Flood routing
 

Similar to Flood analysis

IUKWC Workshop Nov16: Developing Hydro-climatic Services for Water Security –...
IUKWC Workshop Nov16: Developing Hydro-climatic Services for Water Security –...IUKWC Workshop Nov16: Developing Hydro-climatic Services for Water Security –...
IUKWC Workshop Nov16: Developing Hydro-climatic Services for Water Security –...
India UK Water Centre (IUKWC)
 
Narayan Shrestha [ACCURACY OF X-BAND LOCAL AREA WEATHER RADAR (LAWR) OF LEUVE...
Narayan Shrestha [ACCURACY OF X-BAND LOCAL AREA WEATHER RADAR (LAWR) OF LEUVE...Narayan Shrestha [ACCURACY OF X-BAND LOCAL AREA WEATHER RADAR (LAWR) OF LEUVE...
Narayan Shrestha [ACCURACY OF X-BAND LOCAL AREA WEATHER RADAR (LAWR) OF LEUVE...
Narayan Shrestha
 
Rainfall-Runoff Modelling
Rainfall-Runoff ModellingRainfall-Runoff Modelling
Rainfall-Runoff Modelling
Cobain Schofield
 
Vanderborght et al.pptx
Vanderborght et al.pptxVanderborght et al.pptx
Vanderborght et al.pptx
SBO TURQUOISE
 
Giuh2020
Giuh2020Giuh2020
Giuh2020
Riccardo Rigon
 
Presentation Siebesma - (Extreme Precipitation, Present and Future
Presentation Siebesma - (Extreme Precipitation, Present and FuturePresentation Siebesma - (Extreme Precipitation, Present and Future
Presentation Siebesma - (Extreme Precipitation, Present and Future
TU Delft Climate Institute
 
PDEs Coursework
PDEs CourseworkPDEs Coursework
PDEs CourseworkJawad Khan
 
Numerical simulation
Numerical simulationNumerical simulation
Numerical simulationceriuniroma
 
Streamflow simulation using radar-based precipitation applied to the Illinois...
Streamflow simulation using radar-based precipitation applied to the Illinois...Streamflow simulation using radar-based precipitation applied to the Illinois...
Streamflow simulation using radar-based precipitation applied to the Illinois...
Alireza Safari
 
CSpryFinal5
CSpryFinal5CSpryFinal5
CSpryFinal5
Wuzzy13
 
Class lectures on Hydrology by Rabindra Ranjan Saha Lecture 12
Class lectures on Hydrology by Rabindra Ranjan Saha Lecture 12Class lectures on Hydrology by Rabindra Ranjan Saha Lecture 12
Class lectures on Hydrology by Rabindra Ranjan Saha Lecture 12
World University of Bangladesh
 
Calibrating a CFD canopy model with the EC1 vertical profiles of mean wind sp...
Calibrating a CFD canopy model with the EC1 vertical profiles of mean wind sp...Calibrating a CFD canopy model with the EC1 vertical profiles of mean wind sp...
Calibrating a CFD canopy model with the EC1 vertical profiles of mean wind sp...
Stephane Meteodyn
 
runoff.pdf
runoff.pdfrunoff.pdf
runoff.pdf
MoizAhmedKhan6
 
Hydrographs task sheet vle
Hydrographs task sheet vleHydrographs task sheet vle
Hydrographs task sheet vleAlex C G Cooper
 
2011 liongson-modeling studies flood control dams-professorial chair lecture
2011 liongson-modeling studies flood control dams-professorial chair lecture2011 liongson-modeling studies flood control dams-professorial chair lecture
2011 liongson-modeling studies flood control dams-professorial chair lecture
leony1948
 
IRJET- A Review of Synthetic Hydrograph Methods for Design Storm
IRJET-  	  A Review of Synthetic Hydrograph Methods for Design StormIRJET-  	  A Review of Synthetic Hydrograph Methods for Design Storm
IRJET- A Review of Synthetic Hydrograph Methods for Design Storm
IRJET Journal
 
Surface Water Hidrology - Chapter 2
Surface Water Hidrology - Chapter 2Surface Water Hidrology - Chapter 2
Surface Water Hidrology - Chapter 2armada7000
 
Hydrological Modelling of Shallow Landslides
Hydrological Modelling of Shallow LandslidesHydrological Modelling of Shallow Landslides
Hydrological Modelling of Shallow Landslides
Grigoris Anagnostopoulos
 
Sachpazis: Geomorphological investigation of the drainage networks and calcul...
Sachpazis: Geomorphological investigation of the drainage networks and calcul...Sachpazis: Geomorphological investigation of the drainage networks and calcul...
Sachpazis: Geomorphological investigation of the drainage networks and calcul...
Dr.Costas Sachpazis
 

Similar to Flood analysis (20)

IUKWC Workshop Nov16: Developing Hydro-climatic Services for Water Security –...
IUKWC Workshop Nov16: Developing Hydro-climatic Services for Water Security –...IUKWC Workshop Nov16: Developing Hydro-climatic Services for Water Security –...
IUKWC Workshop Nov16: Developing Hydro-climatic Services for Water Security –...
 
Narayan Shrestha [ACCURACY OF X-BAND LOCAL AREA WEATHER RADAR (LAWR) OF LEUVE...
Narayan Shrestha [ACCURACY OF X-BAND LOCAL AREA WEATHER RADAR (LAWR) OF LEUVE...Narayan Shrestha [ACCURACY OF X-BAND LOCAL AREA WEATHER RADAR (LAWR) OF LEUVE...
Narayan Shrestha [ACCURACY OF X-BAND LOCAL AREA WEATHER RADAR (LAWR) OF LEUVE...
 
Rainfall-Runoff Modelling
Rainfall-Runoff ModellingRainfall-Runoff Modelling
Rainfall-Runoff Modelling
 
Vanderborght et al.pptx
Vanderborght et al.pptxVanderborght et al.pptx
Vanderborght et al.pptx
 
Giuh2020
Giuh2020Giuh2020
Giuh2020
 
Presentation Siebesma - (Extreme Precipitation, Present and Future
Presentation Siebesma - (Extreme Precipitation, Present and FuturePresentation Siebesma - (Extreme Precipitation, Present and Future
Presentation Siebesma - (Extreme Precipitation, Present and Future
 
PDEs Coursework
PDEs CourseworkPDEs Coursework
PDEs Coursework
 
#5
#5#5
#5
 
Numerical simulation
Numerical simulationNumerical simulation
Numerical simulation
 
Streamflow simulation using radar-based precipitation applied to the Illinois...
Streamflow simulation using radar-based precipitation applied to the Illinois...Streamflow simulation using radar-based precipitation applied to the Illinois...
Streamflow simulation using radar-based precipitation applied to the Illinois...
 
CSpryFinal5
CSpryFinal5CSpryFinal5
CSpryFinal5
 
Class lectures on Hydrology by Rabindra Ranjan Saha Lecture 12
Class lectures on Hydrology by Rabindra Ranjan Saha Lecture 12Class lectures on Hydrology by Rabindra Ranjan Saha Lecture 12
Class lectures on Hydrology by Rabindra Ranjan Saha Lecture 12
 
Calibrating a CFD canopy model with the EC1 vertical profiles of mean wind sp...
Calibrating a CFD canopy model with the EC1 vertical profiles of mean wind sp...Calibrating a CFD canopy model with the EC1 vertical profiles of mean wind sp...
Calibrating a CFD canopy model with the EC1 vertical profiles of mean wind sp...
 
runoff.pdf
runoff.pdfrunoff.pdf
runoff.pdf
 
Hydrographs task sheet vle
Hydrographs task sheet vleHydrographs task sheet vle
Hydrographs task sheet vle
 
2011 liongson-modeling studies flood control dams-professorial chair lecture
2011 liongson-modeling studies flood control dams-professorial chair lecture2011 liongson-modeling studies flood control dams-professorial chair lecture
2011 liongson-modeling studies flood control dams-professorial chair lecture
 
IRJET- A Review of Synthetic Hydrograph Methods for Design Storm
IRJET-  	  A Review of Synthetic Hydrograph Methods for Design StormIRJET-  	  A Review of Synthetic Hydrograph Methods for Design Storm
IRJET- A Review of Synthetic Hydrograph Methods for Design Storm
 
Surface Water Hidrology - Chapter 2
Surface Water Hidrology - Chapter 2Surface Water Hidrology - Chapter 2
Surface Water Hidrology - Chapter 2
 
Hydrological Modelling of Shallow Landslides
Hydrological Modelling of Shallow LandslidesHydrological Modelling of Shallow Landslides
Hydrological Modelling of Shallow Landslides
 
Sachpazis: Geomorphological investigation of the drainage networks and calcul...
Sachpazis: Geomorphological investigation of the drainage networks and calcul...Sachpazis: Geomorphological investigation of the drainage networks and calcul...
Sachpazis: Geomorphological investigation of the drainage networks and calcul...
 

Recently uploaded

FIDO Alliance Osaka Seminar: Overview.pdf
FIDO Alliance Osaka Seminar: Overview.pdfFIDO Alliance Osaka Seminar: Overview.pdf
FIDO Alliance Osaka Seminar: Overview.pdf
FIDO Alliance
 
Communications Mining Series - Zero to Hero - Session 1
Communications Mining Series - Zero to Hero - Session 1Communications Mining Series - Zero to Hero - Session 1
Communications Mining Series - Zero to Hero - Session 1
DianaGray10
 
Transcript: Selling digital books in 2024: Insights from industry leaders - T...
Transcript: Selling digital books in 2024: Insights from industry leaders - T...Transcript: Selling digital books in 2024: Insights from industry leaders - T...
Transcript: Selling digital books in 2024: Insights from industry leaders - T...
BookNet Canada
 
Free Complete Python - A step towards Data Science
Free Complete Python - A step towards Data ScienceFree Complete Python - A step towards Data Science
Free Complete Python - A step towards Data Science
RinaMondal9
 
Secstrike : Reverse Engineering & Pwnable tools for CTF.pptx
Secstrike : Reverse Engineering & Pwnable tools for CTF.pptxSecstrike : Reverse Engineering & Pwnable tools for CTF.pptx
Secstrike : Reverse Engineering & Pwnable tools for CTF.pptx
nkrafacyberclub
 
FIDO Alliance Osaka Seminar: The WebAuthn API and Discoverable Credentials.pdf
FIDO Alliance Osaka Seminar: The WebAuthn API and Discoverable Credentials.pdfFIDO Alliance Osaka Seminar: The WebAuthn API and Discoverable Credentials.pdf
FIDO Alliance Osaka Seminar: The WebAuthn API and Discoverable Credentials.pdf
FIDO Alliance
 
FIDO Alliance Osaka Seminar: Passkeys at Amazon.pdf
FIDO Alliance Osaka Seminar: Passkeys at Amazon.pdfFIDO Alliance Osaka Seminar: Passkeys at Amazon.pdf
FIDO Alliance Osaka Seminar: Passkeys at Amazon.pdf
FIDO Alliance
 
Essentials of Automations: The Art of Triggers and Actions in FME
Essentials of Automations: The Art of Triggers and Actions in FMEEssentials of Automations: The Art of Triggers and Actions in FME
Essentials of Automations: The Art of Triggers and Actions in FME
Safe Software
 
UiPath Test Automation using UiPath Test Suite series, part 5
UiPath Test Automation using UiPath Test Suite series, part 5UiPath Test Automation using UiPath Test Suite series, part 5
UiPath Test Automation using UiPath Test Suite series, part 5
DianaGray10
 
Why You Should Replace Windows 11 with Nitrux Linux 3.5.0 for enhanced perfor...
Why You Should Replace Windows 11 with Nitrux Linux 3.5.0 for enhanced perfor...Why You Should Replace Windows 11 with Nitrux Linux 3.5.0 for enhanced perfor...
Why You Should Replace Windows 11 with Nitrux Linux 3.5.0 for enhanced perfor...
SOFTTECHHUB
 
Smart TV Buyer Insights Survey 2024 by 91mobiles.pdf
Smart TV Buyer Insights Survey 2024 by 91mobiles.pdfSmart TV Buyer Insights Survey 2024 by 91mobiles.pdf
Smart TV Buyer Insights Survey 2024 by 91mobiles.pdf
91mobiles
 
Encryption in Microsoft 365 - ExpertsLive Netherlands 2024
Encryption in Microsoft 365 - ExpertsLive Netherlands 2024Encryption in Microsoft 365 - ExpertsLive Netherlands 2024
Encryption in Microsoft 365 - ExpertsLive Netherlands 2024
Albert Hoitingh
 
Generative AI Deep Dive: Advancing from Proof of Concept to Production
Generative AI Deep Dive: Advancing from Proof of Concept to ProductionGenerative AI Deep Dive: Advancing from Proof of Concept to Production
Generative AI Deep Dive: Advancing from Proof of Concept to Production
Aggregage
 
SAP Sapphire 2024 - ASUG301 building better apps with SAP Fiori.pdf
SAP Sapphire 2024 - ASUG301 building better apps with SAP Fiori.pdfSAP Sapphire 2024 - ASUG301 building better apps with SAP Fiori.pdf
SAP Sapphire 2024 - ASUG301 building better apps with SAP Fiori.pdf
Peter Spielvogel
 
GridMate - End to end testing is a critical piece to ensure quality and avoid...
GridMate - End to end testing is a critical piece to ensure quality and avoid...GridMate - End to end testing is a critical piece to ensure quality and avoid...
GridMate - End to end testing is a critical piece to ensure quality and avoid...
ThomasParaiso2
 
State of ICS and IoT Cyber Threat Landscape Report 2024 preview
State of ICS and IoT Cyber Threat Landscape Report 2024 previewState of ICS and IoT Cyber Threat Landscape Report 2024 preview
State of ICS and IoT Cyber Threat Landscape Report 2024 preview
Prayukth K V
 
GraphSummit Singapore | Enhancing Changi Airport Group's Passenger Experience...
GraphSummit Singapore | Enhancing Changi Airport Group's Passenger Experience...GraphSummit Singapore | Enhancing Changi Airport Group's Passenger Experience...
GraphSummit Singapore | Enhancing Changi Airport Group's Passenger Experience...
Neo4j
 
FIDO Alliance Osaka Seminar: Passkeys and the Road Ahead.pdf
FIDO Alliance Osaka Seminar: Passkeys and the Road Ahead.pdfFIDO Alliance Osaka Seminar: Passkeys and the Road Ahead.pdf
FIDO Alliance Osaka Seminar: Passkeys and the Road Ahead.pdf
FIDO Alliance
 
Microsoft - Power Platform_G.Aspiotis.pdf
Microsoft - Power Platform_G.Aspiotis.pdfMicrosoft - Power Platform_G.Aspiotis.pdf
Microsoft - Power Platform_G.Aspiotis.pdf
Uni Systems S.M.S.A.
 
Removing Uninteresting Bytes in Software Fuzzing
Removing Uninteresting Bytes in Software FuzzingRemoving Uninteresting Bytes in Software Fuzzing
Removing Uninteresting Bytes in Software Fuzzing
Aftab Hussain
 

Recently uploaded (20)

FIDO Alliance Osaka Seminar: Overview.pdf
FIDO Alliance Osaka Seminar: Overview.pdfFIDO Alliance Osaka Seminar: Overview.pdf
FIDO Alliance Osaka Seminar: Overview.pdf
 
Communications Mining Series - Zero to Hero - Session 1
Communications Mining Series - Zero to Hero - Session 1Communications Mining Series - Zero to Hero - Session 1
Communications Mining Series - Zero to Hero - Session 1
 
Transcript: Selling digital books in 2024: Insights from industry leaders - T...
Transcript: Selling digital books in 2024: Insights from industry leaders - T...Transcript: Selling digital books in 2024: Insights from industry leaders - T...
Transcript: Selling digital books in 2024: Insights from industry leaders - T...
 
Free Complete Python - A step towards Data Science
Free Complete Python - A step towards Data ScienceFree Complete Python - A step towards Data Science
Free Complete Python - A step towards Data Science
 
Secstrike : Reverse Engineering & Pwnable tools for CTF.pptx
Secstrike : Reverse Engineering & Pwnable tools for CTF.pptxSecstrike : Reverse Engineering & Pwnable tools for CTF.pptx
Secstrike : Reverse Engineering & Pwnable tools for CTF.pptx
 
FIDO Alliance Osaka Seminar: The WebAuthn API and Discoverable Credentials.pdf
FIDO Alliance Osaka Seminar: The WebAuthn API and Discoverable Credentials.pdfFIDO Alliance Osaka Seminar: The WebAuthn API and Discoverable Credentials.pdf
FIDO Alliance Osaka Seminar: The WebAuthn API and Discoverable Credentials.pdf
 
FIDO Alliance Osaka Seminar: Passkeys at Amazon.pdf
FIDO Alliance Osaka Seminar: Passkeys at Amazon.pdfFIDO Alliance Osaka Seminar: Passkeys at Amazon.pdf
FIDO Alliance Osaka Seminar: Passkeys at Amazon.pdf
 
Essentials of Automations: The Art of Triggers and Actions in FME
Essentials of Automations: The Art of Triggers and Actions in FMEEssentials of Automations: The Art of Triggers and Actions in FME
Essentials of Automations: The Art of Triggers and Actions in FME
 
UiPath Test Automation using UiPath Test Suite series, part 5
UiPath Test Automation using UiPath Test Suite series, part 5UiPath Test Automation using UiPath Test Suite series, part 5
UiPath Test Automation using UiPath Test Suite series, part 5
 
Why You Should Replace Windows 11 with Nitrux Linux 3.5.0 for enhanced perfor...
Why You Should Replace Windows 11 with Nitrux Linux 3.5.0 for enhanced perfor...Why You Should Replace Windows 11 with Nitrux Linux 3.5.0 for enhanced perfor...
Why You Should Replace Windows 11 with Nitrux Linux 3.5.0 for enhanced perfor...
 
Smart TV Buyer Insights Survey 2024 by 91mobiles.pdf
Smart TV Buyer Insights Survey 2024 by 91mobiles.pdfSmart TV Buyer Insights Survey 2024 by 91mobiles.pdf
Smart TV Buyer Insights Survey 2024 by 91mobiles.pdf
 
Encryption in Microsoft 365 - ExpertsLive Netherlands 2024
Encryption in Microsoft 365 - ExpertsLive Netherlands 2024Encryption in Microsoft 365 - ExpertsLive Netherlands 2024
Encryption in Microsoft 365 - ExpertsLive Netherlands 2024
 
Generative AI Deep Dive: Advancing from Proof of Concept to Production
Generative AI Deep Dive: Advancing from Proof of Concept to ProductionGenerative AI Deep Dive: Advancing from Proof of Concept to Production
Generative AI Deep Dive: Advancing from Proof of Concept to Production
 
SAP Sapphire 2024 - ASUG301 building better apps with SAP Fiori.pdf
SAP Sapphire 2024 - ASUG301 building better apps with SAP Fiori.pdfSAP Sapphire 2024 - ASUG301 building better apps with SAP Fiori.pdf
SAP Sapphire 2024 - ASUG301 building better apps with SAP Fiori.pdf
 
GridMate - End to end testing is a critical piece to ensure quality and avoid...
GridMate - End to end testing is a critical piece to ensure quality and avoid...GridMate - End to end testing is a critical piece to ensure quality and avoid...
GridMate - End to end testing is a critical piece to ensure quality and avoid...
 
State of ICS and IoT Cyber Threat Landscape Report 2024 preview
State of ICS and IoT Cyber Threat Landscape Report 2024 previewState of ICS and IoT Cyber Threat Landscape Report 2024 preview
State of ICS and IoT Cyber Threat Landscape Report 2024 preview
 
GraphSummit Singapore | Enhancing Changi Airport Group's Passenger Experience...
GraphSummit Singapore | Enhancing Changi Airport Group's Passenger Experience...GraphSummit Singapore | Enhancing Changi Airport Group's Passenger Experience...
GraphSummit Singapore | Enhancing Changi Airport Group's Passenger Experience...
 
FIDO Alliance Osaka Seminar: Passkeys and the Road Ahead.pdf
FIDO Alliance Osaka Seminar: Passkeys and the Road Ahead.pdfFIDO Alliance Osaka Seminar: Passkeys and the Road Ahead.pdf
FIDO Alliance Osaka Seminar: Passkeys and the Road Ahead.pdf
 
Microsoft - Power Platform_G.Aspiotis.pdf
Microsoft - Power Platform_G.Aspiotis.pdfMicrosoft - Power Platform_G.Aspiotis.pdf
Microsoft - Power Platform_G.Aspiotis.pdf
 
Removing Uninteresting Bytes in Software Fuzzing
Removing Uninteresting Bytes in Software FuzzingRemoving Uninteresting Bytes in Software Fuzzing
Removing Uninteresting Bytes in Software Fuzzing
 

Flood analysis

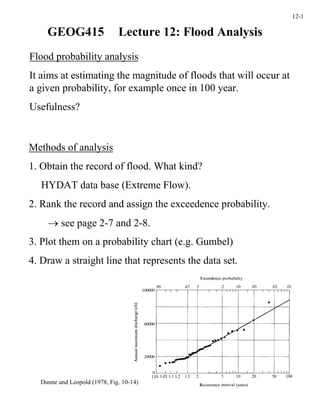
  • 1. 12-1 GEOG415 Lecture 12: Flood Analysis Flood probability analysis It aims at estimating the magnitude of floods that will occur at a given probability, for example once in 100 year. Usefulness? Methods of analysis 1. Obtain the record of flood. What kind? HYDAT data base (Extreme Flow). 2. Rank the record and assign the exceedence probability. → see page 2-7 and 2-8. 3. Plot them on a probability chart (e.g. Gumbel) 4. Draw a straight line that represents the data set. Dunne and Leopold (1978, Fig. 10-14)
  • 2. 12-2 A map of the areas flooded by the 70-year flood of Bow River. (Montreal Engineering Co., 1973. City of Calgary flood study)
  • 3. 12-3 In Fig. 10-14 why does the straight line ignore the highest point? Is it possible that a 100-year flood occurs in a 30-year observation period? How will it show up on the Gumbel plot? Is it OK to estimate 100-year flood from 30-year data by extrapolation? Error estimation Suppose a 30-year annual maximum series having a standard deviation (SD) of 16,000 cfs. The upper bound of the 90 % confidence limit of the 10-year flood is given by (see Table 10-12, next page): SD × 0.50 = 8,000 cfs 8,000 cfs Dunne and Leopold (1978, Fig. 10-17)
  • 4. 12-4 Dunne and Leopold (1978, Table 10-12) Every year, there is a 5 % chance of having a 20-year flood . What is the probability of having a 20-year flood in the next five years? → Equation (2-5) in Dunne and Leopold (1978). We have not had a 70-year flood for 71 years. What is the probability of having a 70-year flood next year?
  • 5. 12-5 Mean annual flood Gumbel extreme probability distribution is designed so that the average flood (arithmetic mean of all floods in the record) has a theoretical return period of 2.33 years. Using this property, mean annual flood can be determined graphically from a Gumbel chart. Homogeneity of flood records The probability theory commonly used in hydrological analysis assumes that the data are homogeneous. What does it mean? Partial-duration flood series How is it different from annual Dunne and Leopold (1978, Table 10-13) maximum series? What is the actual return period of bankfull discharge?
  • 6. 12-6 Regional flood-frequency analysis Planners often require the flood frequency for ungauged basins. → Need for regional frequency curves. Assumption: For large regions of homogeneous climate, vegetation, and topography, individual basins covering a wide range of drainage areas have similar flood-frequency characteristics Dunne and Leopold (1978, Fig. 10-19) Ratio of flood to the mean annual flood 1 1.5 2.33 5 10 25 Dunne and Leopold (1978, Fig. 10-20a) Recurrence interval (years) Floods having specified recurrence interval can be estimated from the mean annual flood.
  • 7. 12-7 How is mean annual flood estimated? Is this method applicable in mountainous regions? Dunne and Leopold (1978, Fig. 10-21) Effects of urbanization What are expected effects? tp: lag to peak tp lc: centroid lag lc Dunne and Leopold (1978, Fig. 10-25)
  • 8. 12-8 Urban sewer systems reduce centroid lag time. Consequences? S: slope Dunne and Leopold (1978, Fig. 10-26) Dunne and Leopold (1978, Fig. 10-28)
  • 9. 12-9 The Unit Hydrograph When the total amount of runoff is given, how do we estimate the temporal distribution of runoff? e.g time lag to peak, duration, etc. The unit hydrograph is the hydrograph of one inch of storm runoff generated by a rainstorm of fairly uniform intensity occurring within a specific period of time (e.g. one hour). The UH theory assumes that temporal distribution depends on basin size, shape, slope, etc., but is fixed from storm to storm. Is this reasonable? Once the UH is established for a basin, hydrographs resulting from any amounts of runoff may be computed from the UH. Hydrograph that would result from 50.8 mm of runoff. 25.4 mm of runoff generated over the basin. Dunne and Leopold (1978, Fig. 10-30)
  • 10. 12-10 Construction of the UH from discharge data 1. Select a few storm hydrographs resulting from fairly uniform rain having similar duration, and separate baseflow. 2. Compute the total volume of stormflow (m3) for each hydrograph and divide it by the basin area to obtain total stormflow in depth unit R (mm). 3. Multiply each discharge measurement by 25.4/R so that the total stormflow of the reduced hydrograph is equal to 25.4 mm. 4. Plot the reduced hydrographs and superimpose them, each hydrograph beginning at the same time. 5. By trial and error, draw the unit hydrograph representing the shape of all reduced hydrographs and having a total stormflow of 25.4 mm.
  • 11. 12-11 UH’s for storms of various durations Principles of superposition: Four-hour UH consists of the superposition of two two-hour UH. It needs to be divided by a factor of two to adjust for the total stormflow (25.4 mm). Is this reasonable? Under what condition? Dunne and Leopold (1978, Fig. 10-32)
  • 12. 12-12 S-curve method Commonly used to derive hydrographs resulting from arbitrary-duration storms. In this example, the original UH was derived for 2.5-hr storm. It is superimposed successively at 2.5-hr interval, resulting in a S- shaped curve. Dunne and Leopold (1978, Fig. 10-33) What does it represent? Two S-curves are now plotted with an offset of 1 hour (a). The difference between the two S-curves represents another hydrograph (b), which is adjusted for the total stormflow to yield the UH of 1-hour storm (c). Dunne and Leopold (1978, Fig. 10-34)
  • 13. 12-13 Synthetic UH’s How can we obtain the UH for an ungauged basin? Assumptions? Dunne and Leopold (1978, Fig. 10-35) Snyder method Correlation between the lag to peak (tp, hours) and basin length. tp = Ct (LLc)0.3 L: Length of main stream from outlet to divide (miles) Lc: Distance from the outlet to a point on the stream nearest the centroid of the basin. Ct: Empirical constant (0.3-10) Duration of rainstorm (Dr) and tp were correlated by: Dr = 0.18tp in Snyder’s study. → may not be true in other regions.
  • 14. 12-14 The peak discharge (Qpk, ft3 s-1) is given by: Qpk = CpA/tp A: Basin area (mile2) Cp: Empirical constant (370-405) The duration (tb) of the UH could be given by: tb = 72 + 3tp or tb = 5(tp + 0.5Dr) The width of the UH at 75 % (W75, hour) of the peak flow is given by: W75 = 440A/Qpk1.08 Similarly, W50 is given by: W50 = 770A/Qpk1.08 From tp, Dr, tb, Qpk, W75, and W50, the UH can now be synthesized. Dunne and Leopold (1978, Fig. 10-38)
  • 15. 12-15 Triangular UH by Soil Conservation Service An alternative method assumes a triangular shape of the UH. The detailed method of construction is given in Dunne and Leopold (1978, p.342-343). In this case, the time of rise to peak (Tr) is given by: Dunne and Leopold (1978, Fig. 10-39) Tr = Dr/2 + tp Dimensionless UH by Soil Conservation Service This method uses dimensionless time (T/Tp) and discharge (Q/Qpk) to plot the UH. Q and T for each basin can be calculated from Fig.10-40 once Tp and Qpk are given. Tp is dependent on the geometry and dimension of the basin. Qpk is dependent on the amount of runoff, which is estimated from the Dunne and Leopold (1978, Fig. 10-40) curve number method.
  • 16. 12-16 Both methods by SCS were developed for small agricultural watersheds. Example A 5-km2, reasonably flat watershed has a curve number of 88. Estimated time of concentration (tc, see page 11-14) is 30 minutes. Generate a synthetic hydrograph resulting from 51 mm of rain applied uniformly over a two-hour period. Runoff (R) = 25 mm using the curve number method Tp = 0.5Dr + 0.6tc = 78 min = 1.3 hr from DL, Eq.(10-20) The dimensionless UH is designed so that Qpk ≅ 0.5R/Tp = 0.5 × 25 / 1.3 = 9.6 mm hr-1 In terms of discharge, Qpk = 15.6 mm hr-1 × 5 km2 = 48000 m3 hr-1 = 13 m3 s-1 13 Discharge (m3 s-1) 0 1.3 Time (hour)