Download as PDF, PPTX

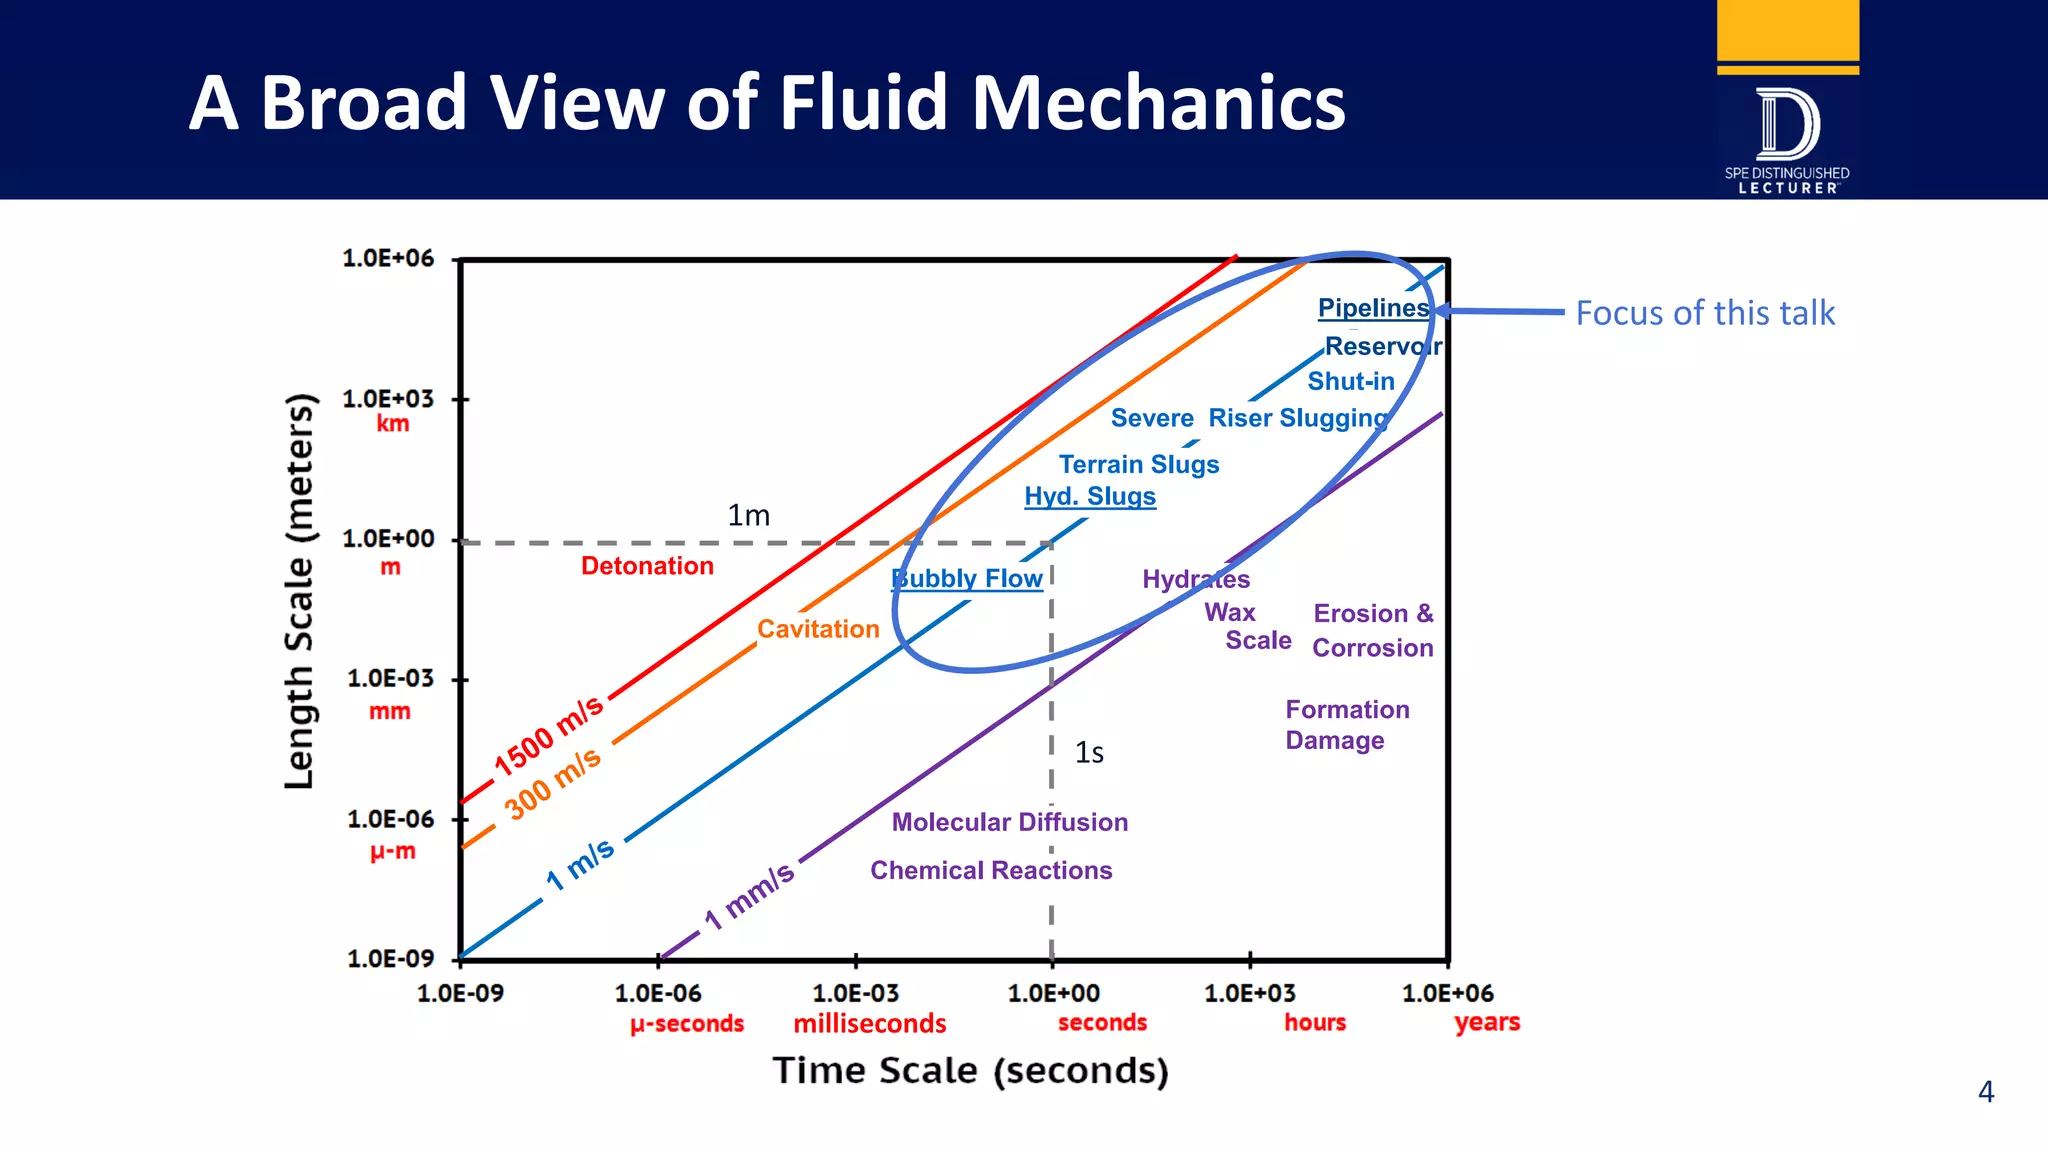
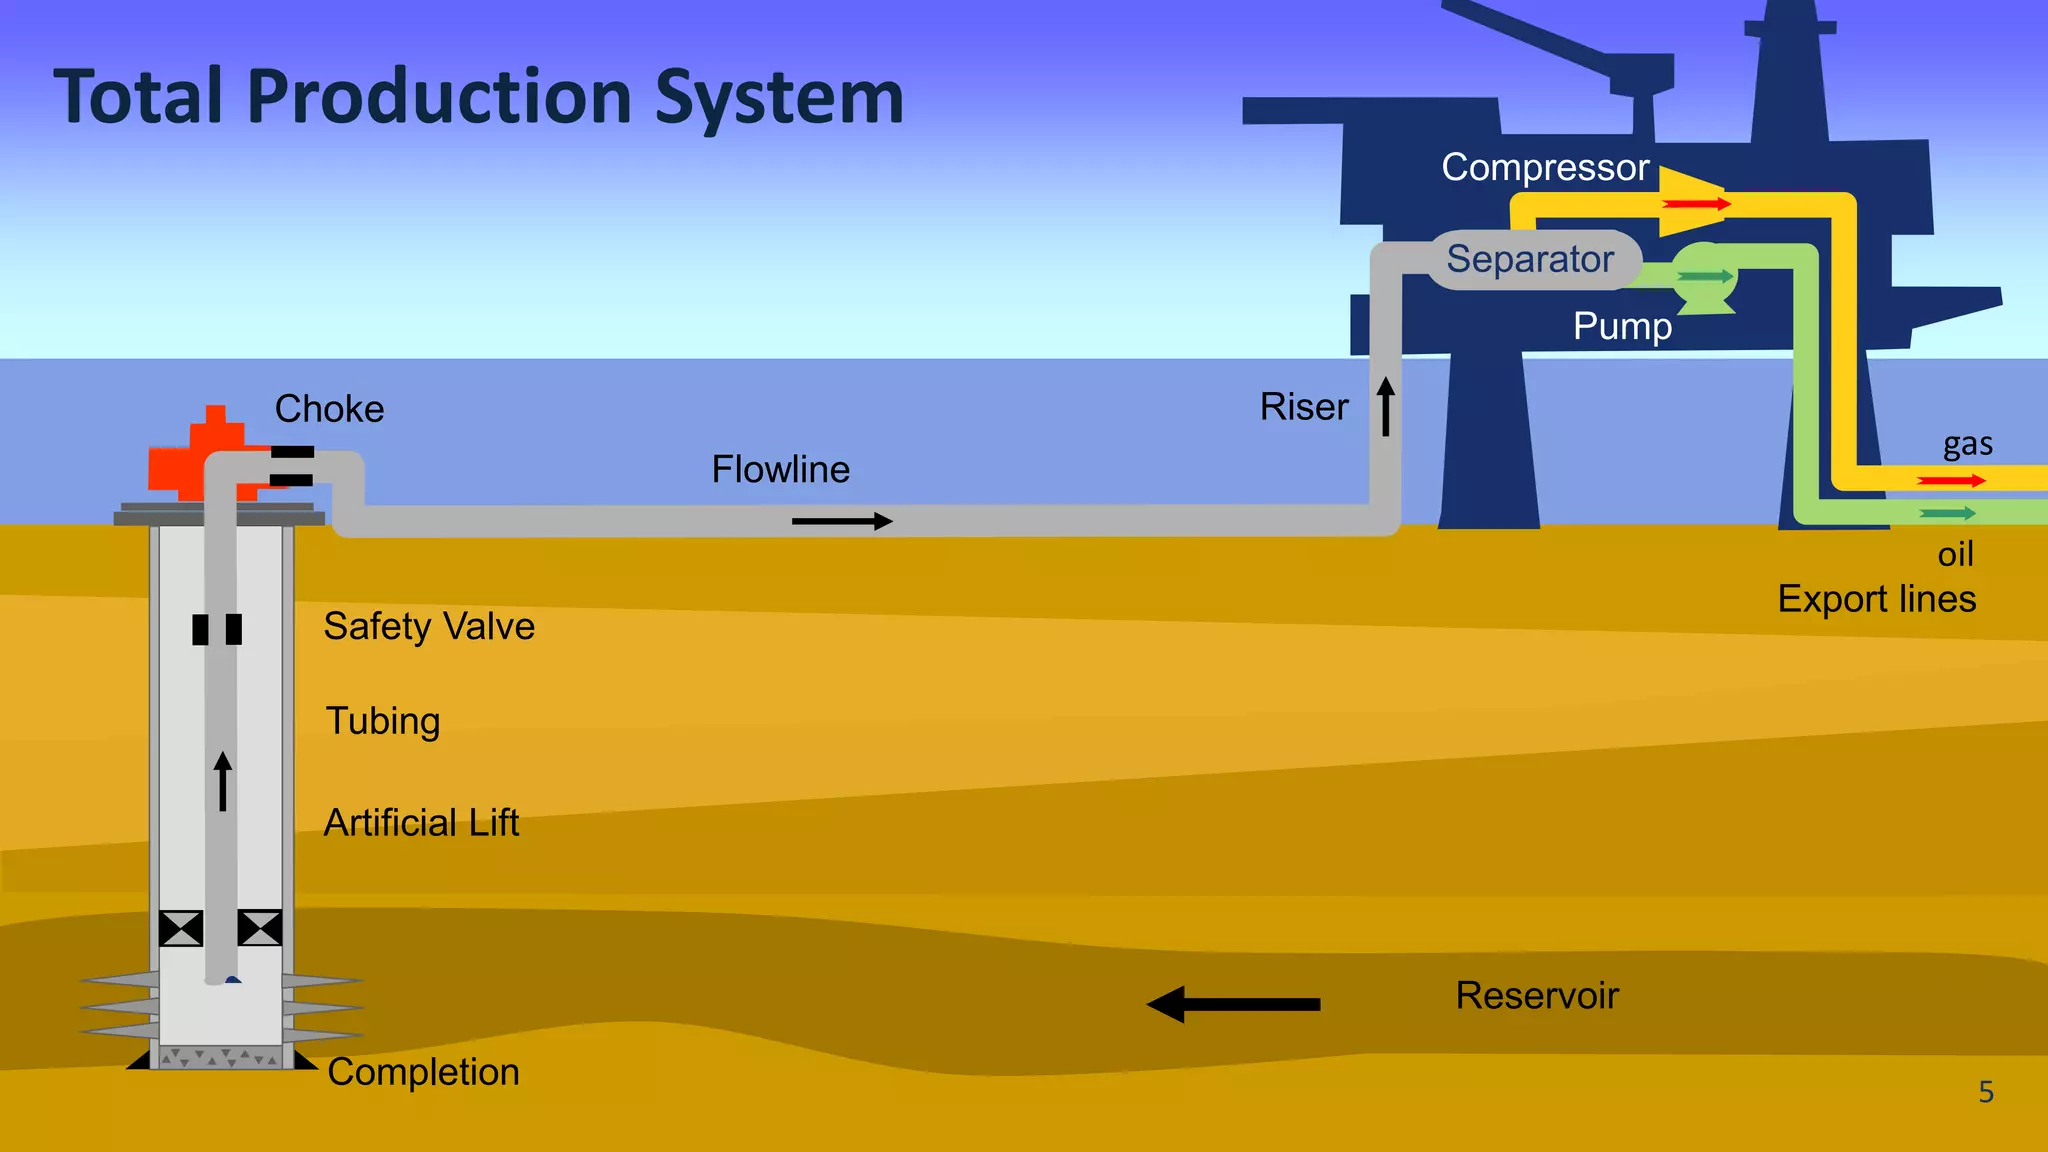


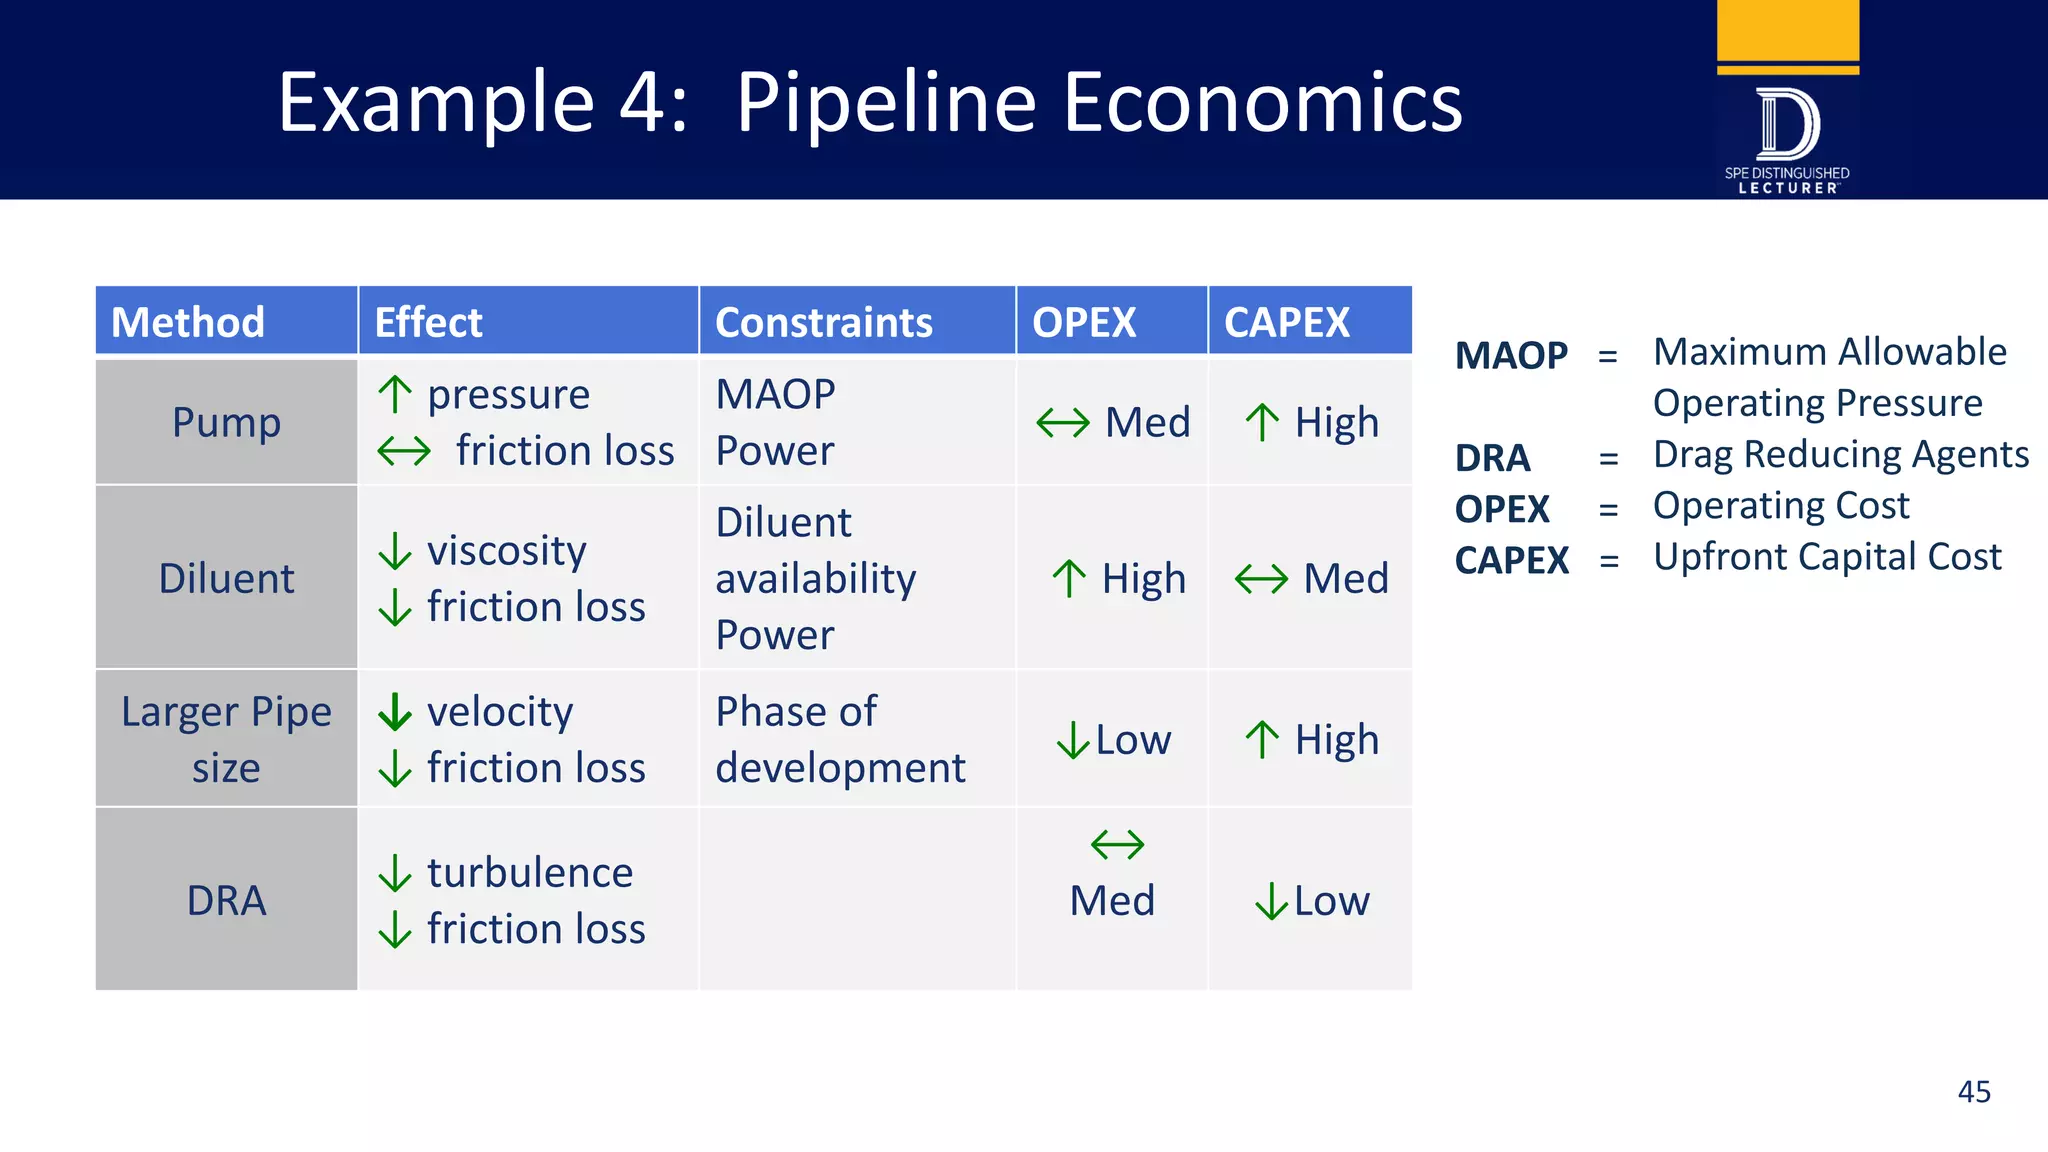

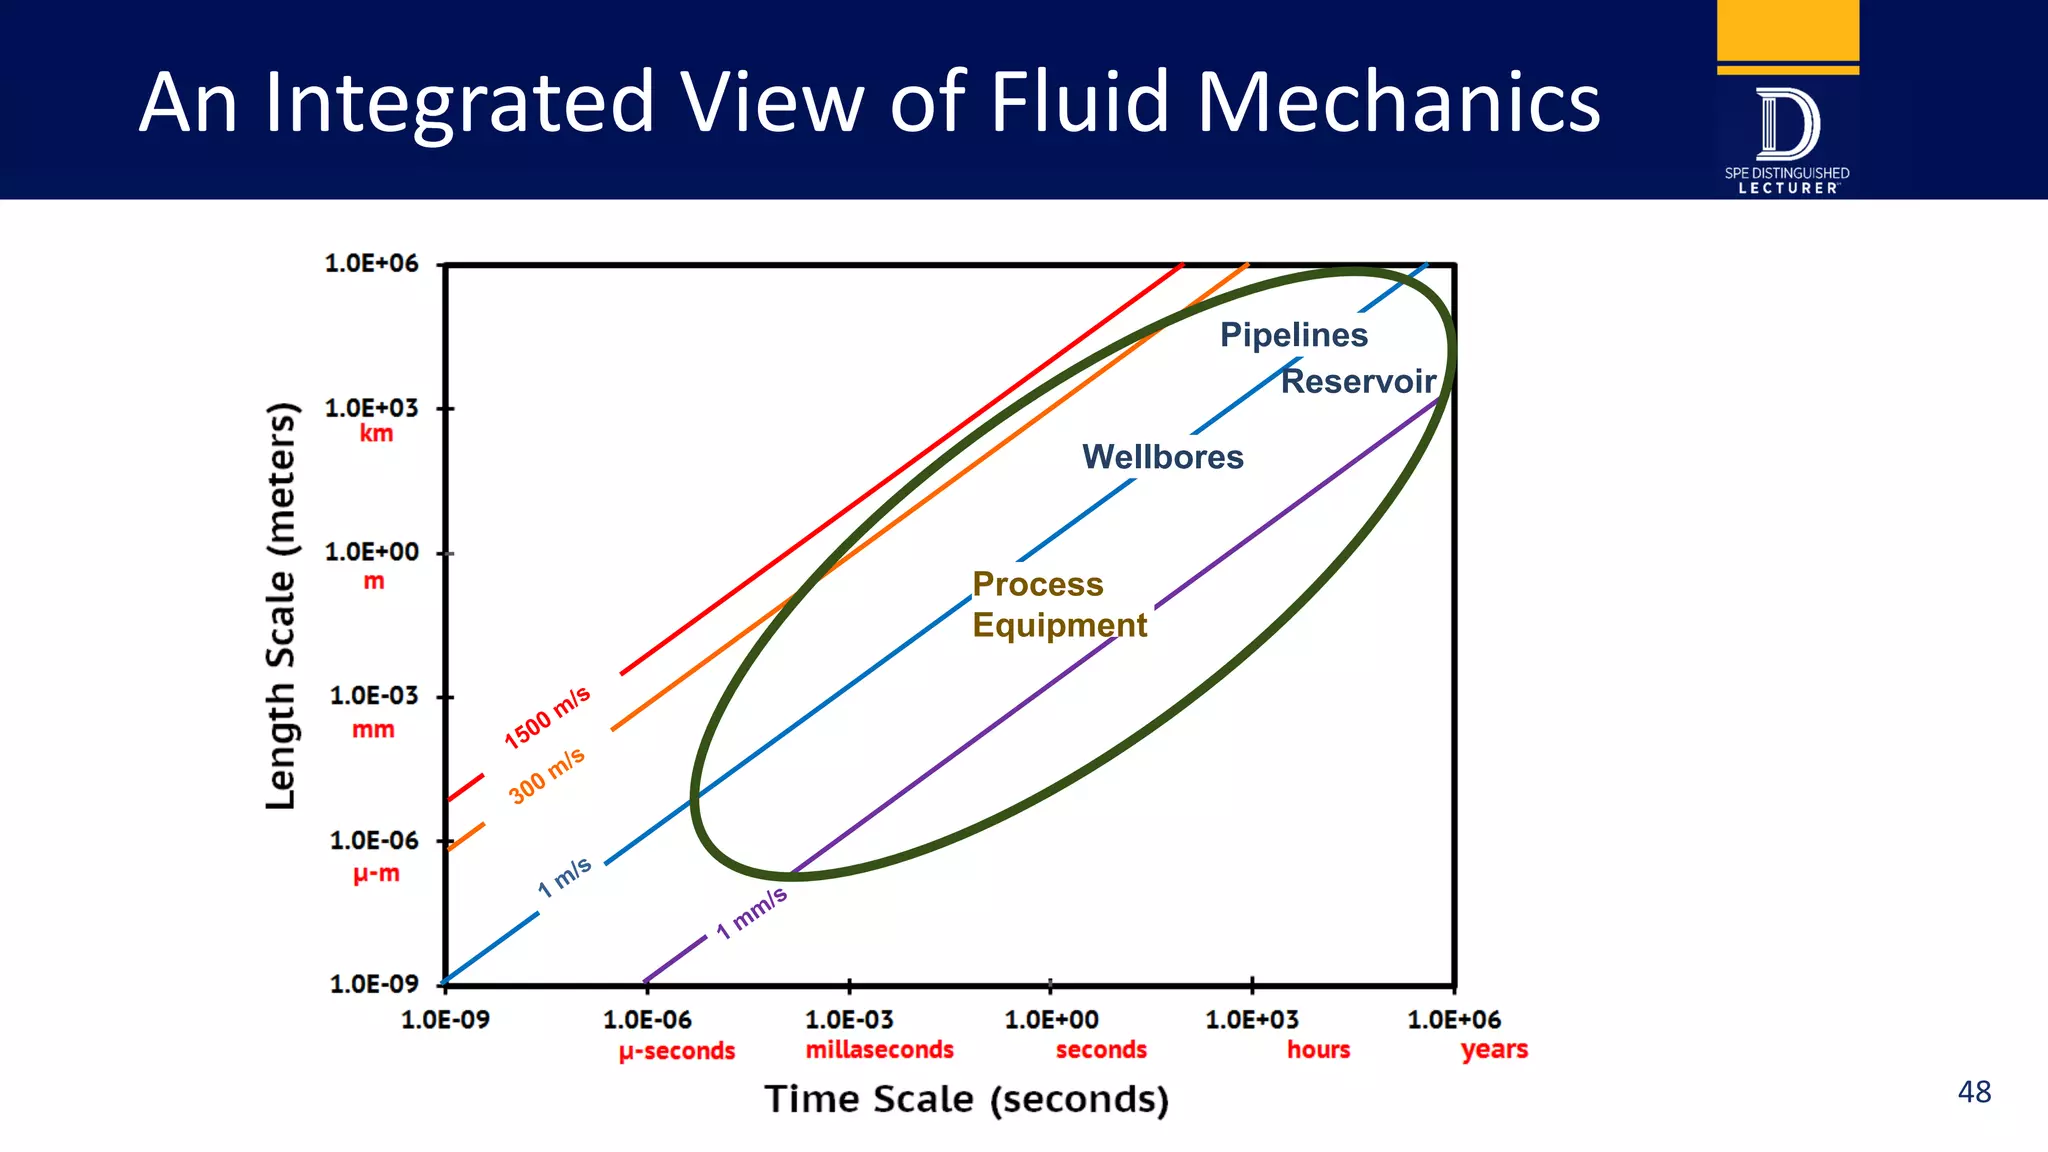


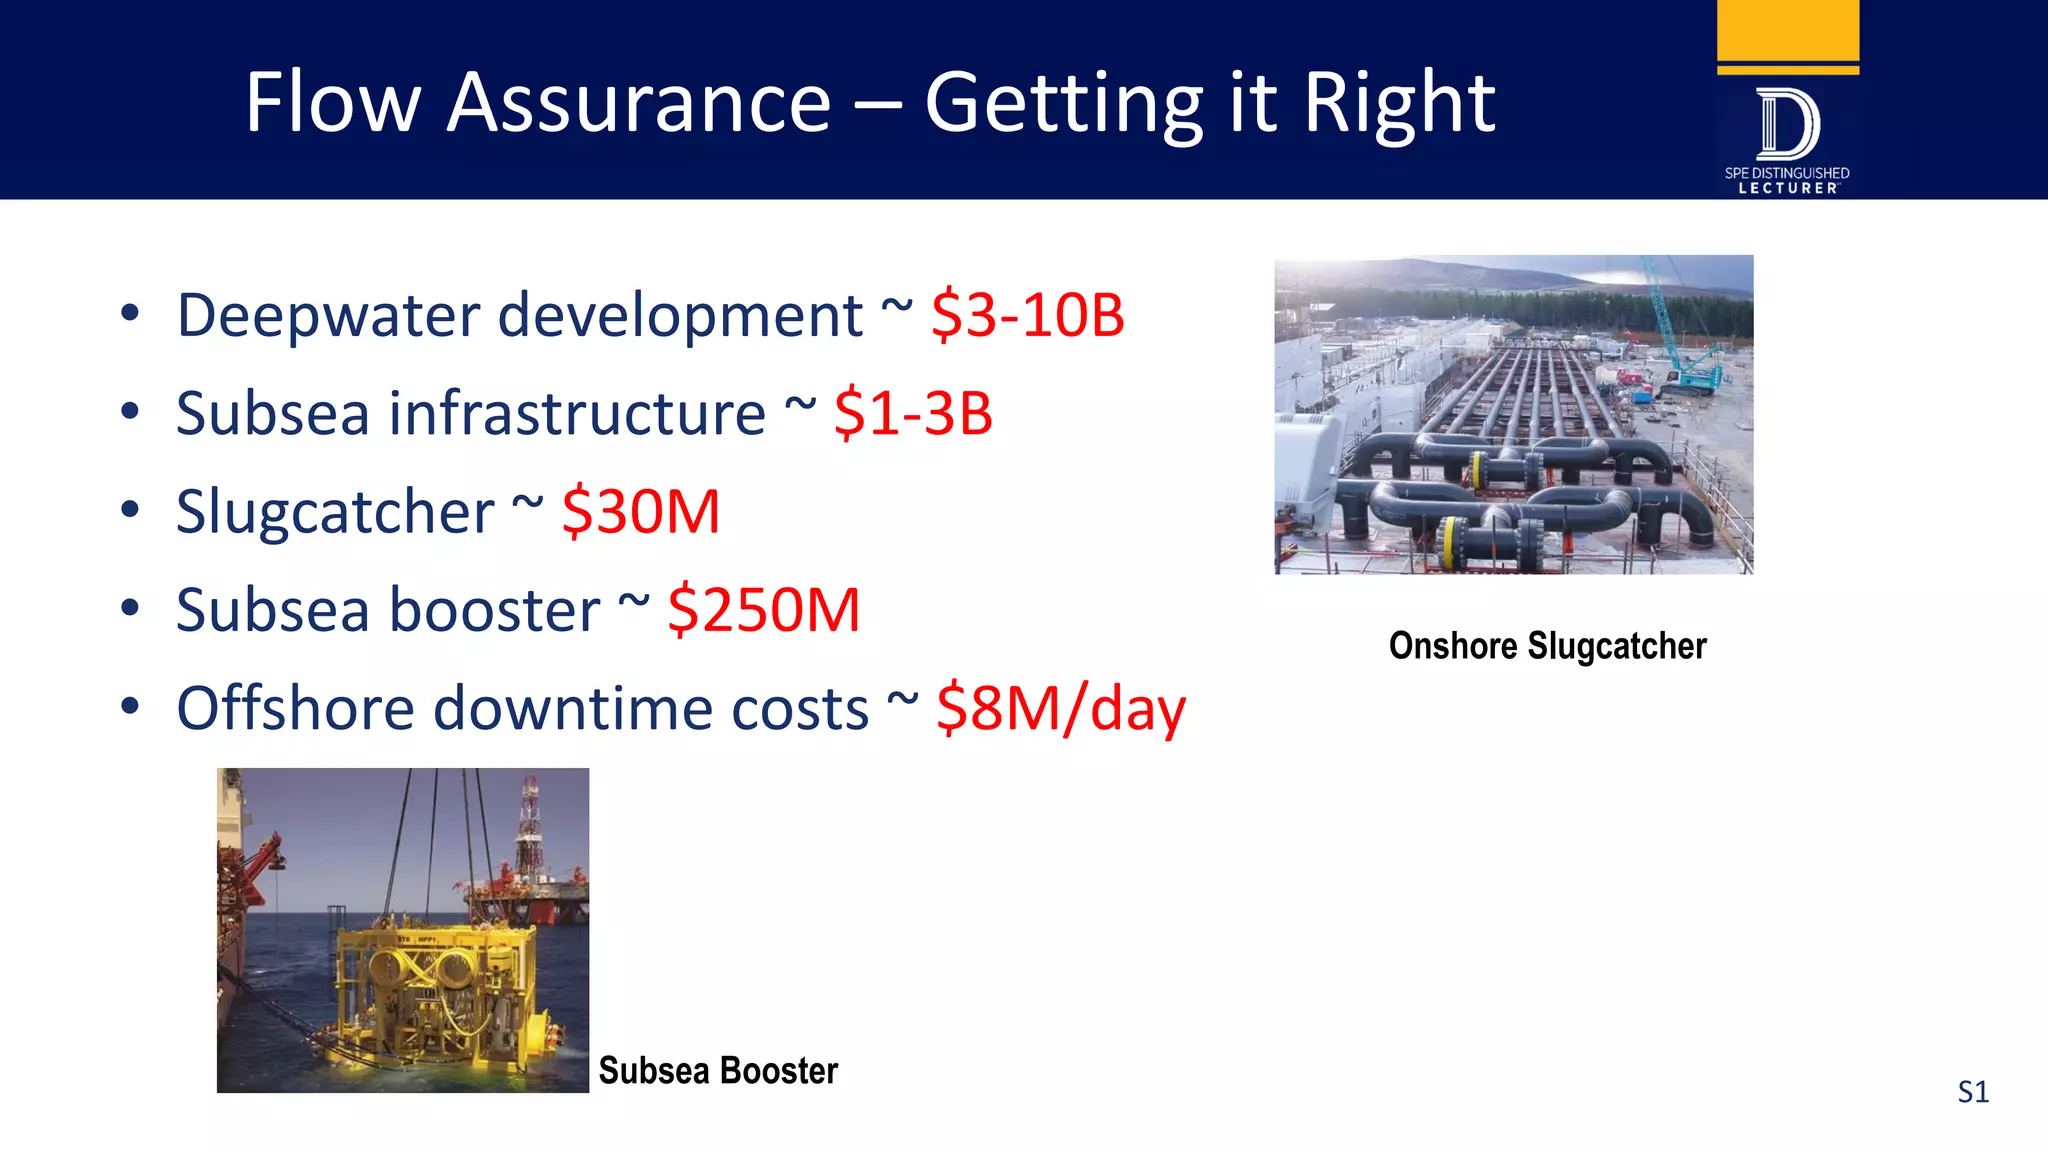

The document discusses the science and economics of multiphase flow in petroleum engineering, covering aspects such as fluid mechanics, pressure changes, nodal analysis, and flow assurance. It emphasizes the importance of accurate modeling and analysis for optimizing offshore and onshore production systems, while also addressing challenges posed by various fluid properties and terrain effects. Concluding remarks highlight the necessity of integrating economic considerations with technical advancements to maximize production and minimize operational risks.