Download as PDF, PPTX


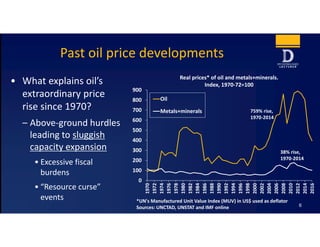


The document summarizes a presentation on the past, present, and future of oil prices. It explains that oil prices rose extraordinarily since 1970 due to above-ground hurdles limiting supply expansion. Recent price declines are attributed to slowing global growth and rising shale oil production. Technological advances may allow shale and other sources to continue growing, keeping supply abundant and prices in the range of $40-60 per barrel long-term.


![2.1 "Tight Shales - Not all Shales are Created Equal" - Sidney Green [EN]](https://cdn.slidesharecdn.com/ss_thumbnails/1sidneygreenen-110909063238-phpapp01-thumbnail.jpg?width=640&height=640&fit=bounds)


