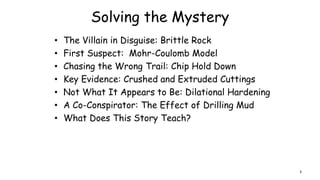
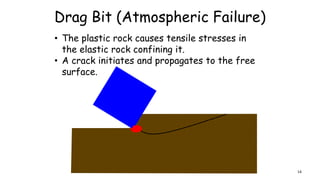
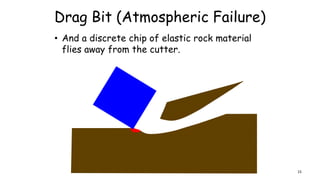
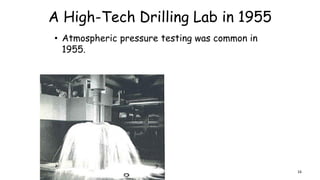
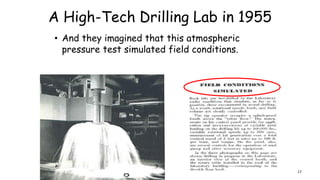
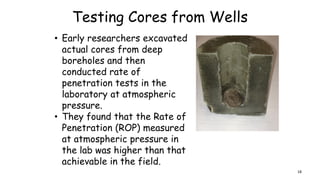
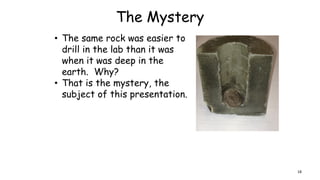
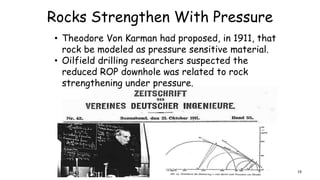
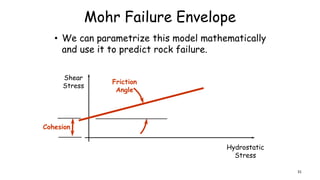
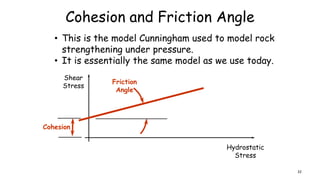
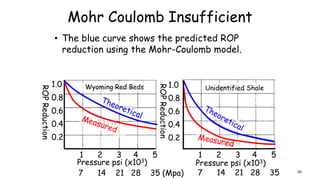
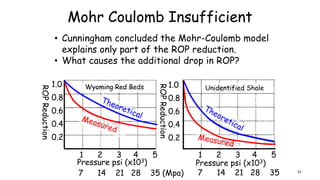
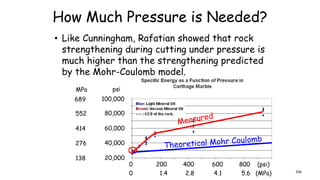
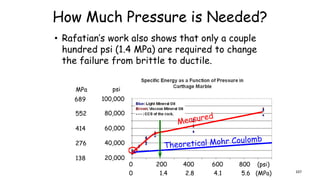
Primary funding is provided by
The SPE Foundation through member donations
and a contribution from Offshore Europe
The Society is grateful to those companies that allow their
professionals to serve as lecturers
Additional support provided by AIME
Society of Petroleum Engineers
Distinguished Lecturer Program
www.spe.org/dl
1
Society of Petroleum Engineers
Distinguished Lecturer Program
www.spe.org/dl
L.W. (Roy) Ledgerwood III
Solving the Mystery of Low Rate of
Penetration in Deep Wells
2
Solving the Mystery
• The Villain in Disguise: Brittle Rock
• First Suspect: Mohr-Coulomb Model
• Chasing the Wrong Trail: Chip Hold Down
• Key Evidence: Crushed and Extruded Cuttings
• Not What It Appears to Be: Dilational Hardening
• A Co-Conspirator: The Effect of Drilling Mud
• What Does This Story Teach?
3
The Villain in Disguise:
Brittle Rock
41:45
Rock at Atmospheric Pressure
• We experience rock as a brittle material.
5
Rock – A Grannular Material
• Generally speaking, rock made up of grains
cemented together.
• The cement between the grains is what provides
rock strength at atmospheric pressure.
6
Bits Cause Rock Failure
• Two general classed
of drill bits:
– Drag bits scrape
and shear rock.
– Rolling cone bits
crush rock.
Early 20th Century Late 20th Century
7
Roller Cone (Atmospheric Failure)
• Consider one rolling cone tooth indenting rock
at atmospheric pressure.
8
Roller Cone (Atmospheric Failure)
• First the rock immediately under the
indenter (red) changes to a crushed plastic
material confined by the remaining elastic
material.
9
Roller Cone (Atmospheric Failure)
• The plastic rock causes tensile stresses in
the elastic rock confining it.
• Cracks initiate in the elastic rock and
propagate to the free surface.
10
Roller Cone (Atmospheric Failure)
• Discrete chips of rock fly away from the
indention area.
• Each chip preserves the original fabric of the
elastic rock.
11
Drag Bit (Atmospheric Failure)
• The process is similar when a drag-bit cutter
shears rock at atmospheric pressure.
12
Drag Bit (Atmospheric Failure)
• The rock at the bottom of the cutter
changes to a crushed plastic material
confined by the remaining elastic material.
13
Drag Bit (Atmospheric Failure)
• The plastic rock causes tensile stresses in
the elastic rock confining it.
• A crack initiates and propagates to the free
surface.
14
Drag Bit (Atmospheric Failure)
• And a discrete chip of elastic rock material
flies away from the cutter.
15
A High-Tech Drilling Lab in 1955
• Atmospheric pressure testing was common in
1955.
16
A High-Tech Drilling Lab in 1955
• And they imagined that this atmospheric
pressure test simulated field conditions.
17
Testing Cores from Wells
• Early researchers excavated
actual cores from deep
boreholes and then
conducted rate of
penetration tests in the
laboratory at atmospheric
pressure.
• They found that the Rate of
Penetration (ROP) measured
at atmospheric pressure in
the lab was higher than that
achievable in the field.
18
The Mystery
• The same rock was easier to
drill in the lab than it was
when it was deep in the
earth. Why?
• That is the mystery, the
subject of this presentation.
18
Rocks Strengthen With Pressure
• Theodore Von Karman had proposed, in 1911, that
rock be modeled as pressure sensitive material.
• Oilfield drilling researchers suspected the
reduced ROP downhole was related to rock
strengthening under pressure.
19
First Suspect:
Mohr-Coulomb Material
205:45
Cunningham
• In 1955, Bob Cunningham
did Master’s Thesis
research at Rice
University in which he:
• measured drilling rates
in a specially-designed
high-pressure microbit
test machine.
• He also modeled drilling
mathematically.
21
Microbit Test Machine
Microbit
Actual
Bit
• Cunningham designed the high-
pressure test machine to use
1 ¼” (3.1 cm) diameter microbits.
22
Modeling Rock Failure
• Cunningham modeled the rock as a Mohr-
Coulomb material.
• This model may be plotted in a space of
hydrostatic stress vs shear-stress.
Hydrostatic
Stress
Shear
Stress
23
Mohr Space
• In this space, a circle on the hydrostat
represents a stress state.
Hydrostatic
Stress
Shear
Stress
24
Compressive Strength Test
• Imagine that we conduct a test in which we
take a cylinder of rock and stress it axially until
it fails.
• We call the stress required to fail the rock the
compressive strength.
Compressive
Strength 25
Unconfined Compressive Strength
• We can plot the stress at failure in this Mohr-
Coulomb space as a circle intersecting the
horizontal axis at the confining pressure and
and at the Unconfined Compressive Strength.
Hydrostatic
Stress
Shear
Stress
Confining
Pressure
Unconfined
Compressive
StrengthShear
Stress
26
Confined Compressive Strength
• Now let’s conduct the test again but this time
with confining pressure.
• The rock will have a larger compressive
strength when it is confined by confining
pressure.
Confining
pressure
Compressive
Strength
Confining
pressure
27
Confined Compressive Strength
• We can plot the confined compressive strength
with a circle as shown below.
Hydrostatic
Stress
Shear
Stress
Confining
Pressure
Confined
Compressive
Strength
Shear
Stress
28
Confined Compressive Strength
• If the confining pressure is raised even more,
then the material is even stronger.
Hydrostatic
Stress
Shear
Stress
Confining
Pressure
Confined
Compressive
Strength
Shear
Stress
29
Mohr Failure Envelope
Hydrostatic
Stress
Shear
Stress
• We may put all the circles representing
different failure strengths together and define
a “failure surface” that approximates them.
30
Mohr Failure Envelope
• If we remove the circles, the failure envelope is
left describing rock strengthening with
pressure.
Hydrostatic
Stress
Shear
Stress
31
Mohr Failure Envelope
• If an arbitrary stress state grows to the point
where it touches the failure envelope, the rock
will fail.
Hydrostatic
Stress
Shear
Stress
31
Failure
Mohr Failure Envelope
• We can parametrize this model mathematically
and use it to predict rock failure.
Hydrostatic
Stress
Shear
Stress
Cohesion
Friction
Angle
31
Cohesion and Friction Angle
• This is the model Cunningham used to model rock
strengthening under pressure.
• It is essentially the same model as we use today.
Hydrostatic
Stress
Shear
Stress
Cohesion
Friction
Angle
32
A Pressure Sensitive Material
• I like to demonstrate the behavior of
pressure-sensitive granular materials with
some ball bearings glued to boards.
• The ball bearings are an idealized
representation the grains of the rock.
33
A Pressure Sensitive Material
• Imagine placing the ball bearings together as
shown below.
34
A Pressure Sensitive Material
• When shear forces are applied, the two
boards have to move apart, to allow the balls
to slide past each other.
shear
force
35
A Pressure Sensitive Material
• When shear forces are applied, the two
boards have to move apart, to allow the balls
to slide past each other.
shear
force
36
A Pressure Sensitive Material
• When shear forces are applied, the two
boards have to move apart, to allow the balls
to slide past each other.
shear
force
37
A Pressure Sensitive Material
• This results in a volume expansion of the
material being sheared.
• Rock expands in a manner analogous to this
when it is sheared.
shear
force
38
A Pressure Sensitive Material
• If a dead weight is set on the top piece, such
that it forces the balls together, how will
this affect the shear force?
Weight
39
A Pressure Sensitive Material
• A dead weight forcing the grains together
will increase the shear force required to
shear the material.
shear
force
Weight
40
A Pressure Sensitive Material
• As the rock shears, there is still a volume
expansion which the weight resists.
Weight
shear
force
41
A Pressure Sensitive Material
• As the rock shears, there is still a volume
expansion which the weight resists.
Weight
shear
force
42
Meaning of the Illustration
1. In this illustration, the dead weight is like
pressure. It makes it difficult to shear the
two pieces since the balls (like grains)
interlock.
2. And the whole assembly dilates as it is
sheared like rock does when it is sheared.
43
Downhole Pressures
• There are many different pressures stressing
rock in the earth near a borehole.
• What combination of these govern reduced ROP?
Borehole
Pressure
In Situ Pore
Pressure
Overburden
Pressure
Confining
Pressure
4411:00
Differential Pressure
• Cunningham and Eenink (1958) found that the
difference between borehole pressure and
pore pressure governs ROP.
Borehole
Pressure
Pb
In Situ Pore
Pressure Pp
Differential Pressure = Pb - Pp
45
Mud Seals Borehole
• Many rocks are permeable and drilling mud is
formulated to prevent the mud from flowing
into the earth.
In Situ Pore
Pressure Pp
Borehole
Pressure
Pb
46
Differential Pressure
• Cunningham and Eenink detected what they
called a “filter cake” of mud and crushed rock
sealing the surface of the borehole.
In Situ Pore
Pressure Pp
Borehole
Pressure
Pb
47
Mohr Coulomb Insufficient
• The graphs below are some of the results of
ROP reduction as a function of pressure.
• The vertical scale is percent of ROP at
atmospheric pressure.
48
1.0
0.8
0.6
0.4
0.2
ROPReduction
1.0
0.8
0.6
0.4
0.2
ROPReduction1 2 3 4 5 1 2 3 4 5
Pressure psi (x103) Pressure psi (x103)
7 14 21 28 35 (Mpa) 7 14 21 28 35
Mohr Coulomb Insufficient
• The red curves below are the measured ROP
reduction as a function of differential pressure.
1 2 3 4 5 1 2 3 4 5
Pressure psi (x103) Pressure psi (x103)
1.0
0.8
0.6
0.4
0.2
1.0
0.8
0.6
0.4
0.2
ROPReduction
ROPReduction
Unidentified ShaleWyoming Red Beds
7 14 21 28 35 (Mpa) 7 14 21 28 35 49
Mohr Coulomb Insufficient
• The blue curve shows the predicted ROP
reduction using the Mohr-Coulomb model.
1.0
0.8
0.6
0.4
0.2
1.0
0.8
0.6
0.4
0.2
ROPReduction
ROPReduction
Unidentified ShaleWyoming Red Beds
1 2 3 4 5 1 2 3 4 5
Pressure psi (x103) Pressure psi (x103)
7 14 21 28 35 (Mpa) 7 14 21 28 35 50
Mohr Coulomb Insufficient
• Cunningham concluded the Mohr-Coulomb model
explains only part of the ROP reduction.
• What causes the additional drop in ROP?
1.0
0.8
0.6
0.4
0.2
1.0
0.8
0.6
0.4
0.2
ROPReduction
ROPReduction
Unidentified ShaleWyoming Red Beds
1 2 3 4 5 1 2 3 4 5
Pressure psi (x103) Pressure psi (x103)
7 14 21 28 35 (Mpa) 7 14 21 28 35 51
Chasing the Wrong Trail:
Chip Hold Down
5212:15
Garnier and Van Lingen
• Garnier and Van Lingen (1958) used a high-
pressure microbit rig and attempted to
identify the other mechanism that accounts
for lower penetration rates than that
predicted by the Mohr-Coulomb theory.
53
Chip Hold-Down
• Garnier and Van Lingen imagined that in the
downhole environment long brittle cracks
propagate, like they do at atmospheric
pressure.
54
Chip Hold-Down
• But these chips, they imagined, are held in
place by the filter-cake and the downhole
pressure.
• They called this “chip hold-down.”
55
Garnier and Van Lingen
• The graphs below are some of their results of
ROP reduction as a function of pressure.
25 50 75 100 125
Pressure kg/cm2
5
4
3
2
1
Penetration
Per
Revolution
(mm/rev)
56
Garnier and Van Lingen
25 50 75 100 125
Pressure kg/cm2
• Like Cunningham, they showed that the
theoretical Mohr Coulomb model only accounted
for part of the reduction in ROP.
5
4
3
2
1
Penetration
Per
Revolution
(mm/rev)
57
Strength
Effect
Garnier and Van Lingen
25 50 75 100 125
Pressure kg/cm2
• They hypothesized that the “chip hold-down”
mechanism accounted for the additional
reduction in ROP.
5
4
3
2
1
Penetration
Per
Revolution
(mm/rev)
Strength
Effect
Chip Hold
Down Effect
58
Feenstra and Van Leeuwen
• Feenstra and Van
Leeuwen (1964) made
use of the first full-
size high-pressure bit
test facility to study
chip hold-down.
Photo courtesy of Mines Paris Tech59
Feenstra and Van Leeuwen
• Feenstra and Van Leeuwen recognized that chip
hold-down effect was affected by bit rotary
speed.
40 60 80 100 120
Pressure kg/cm2
8
4
6
2
ROP
Reduction
Factor
60
Feenstra and Van Leeuwen
• They observed that the reduction in penetration
rate, due to chip hold-down was more severe at
high rotary speeds.
40 60 80 100 120
Pressure kg/cm2
8
4
6
2
ROP
Reduction
Factor
27 RPM
65 RPM
113 RPM
315 RPM
61
Feenstra and Van Leeuwen
• Feenstra and Van Leeuwen imagined that drilling
fluid had to invade the crack to equalize the
pressure allowing excavation of the chip.
62
Key Evidence:
Crushed and Extruded Cuttings
6315:25
Sawtooth Shaped PDC Cuttings
• Researchers observed that PDC bits cutting
under pressure create cuttings with a saw-tooth
shape.
64
Sawtooth Shaped PDC Cuttings
• These are photos of actual cuttings.
65
Morphology of the Cuttings
• We assumed that the saw-tooth shaped cutting
was created as the rock failed in a brittle
manner over and over.
66
Morphology of Cuttings
• First a long brittle crack propagates.
67
Morphology of Cuttings
• Then a chip of rock moves up.
68
Morphology of Cuttings
• The cutter advances loading the rock again.
69
Morphology of Cuttings
• Then another long crack propagates.
70
Morphology of Cuttings
• Then another chip moves up.
71
Morphology of Cuttings
• Another crack propagates.
72
Morphology of Cuttings
• Another chip moves up into the stack of chips
making up the cutting.
73
Imagining Brittle Failure
• We imagined that the saw-tooth shaped cutting
was a stack of rock chips each preserving the
original rock morphology within the chip.
74
Crushed and Extruded
• Ron Bland (Black 2008) showed that these saw-
tooth cuttings were not discrete “chips.”
• Rather the rock is crushed and extruded.
75
Crushed and Extruded
• The saw-tooth shaped cuttings are easily
crushable into powder.
• They would not be so easily crushable if they
consisted of stacked chips of un-failed rock.
76
Both PDC and Tricone Bits
• Bland showed that this was true of cuttings
generated under pressure by both PDC bits and
Roller Cone bits.
• He reported the size of the crushed material
making up the re-compacted cutting for both
PDC and roller cone bits.
Average Crushed Particle Size
Tricone Bit 3.7 microns
PDC Bit 4.3 microns
77
Drag Bits Crush and Extrude
• The teeth of drill bits downhole do not drive
long brittle cracks, as earlier models postulated.
• Rather, they crush and extrude re-compacted
rock powder (red).
78
Rolling Cone Bits Crush and Extrude
• This is also true of roller cone bits downhole.
• They do not drive long cracks.
• Rather they crush the rock and extrude the
crushed material.
82
79
Discrete Element Models
• Discrete Element Models (DEM) of rock cutting
under pressure confirm that the rock is entirely
crushed.
Ledgerwood, (2007)
Amber balls =
cemented
grains
Blue balls =
crushed material
with no bonds
PDC Cutter Black dots =
Pressure BC
80
Discrete Element Models
• DEM models predict a similar crushing and
extruding process for rock under the action of
a Roller Cone tooth.
Ledgerwood, (2007)
Rolling Cone
Tooth
81
Crushed Rock – A Third Material
• The crushed rock powder is a third material, in
addition to the cutter and the un-failed rock.
This raises the question:
what are the mechanical
properties of the
crushed rock powder?
Cutter
Un-failed
rock
82
Crushed Rock – A Third Material
• We are tempted to follow our gut and assume
the crushed rock has relatively low strength.
• But this is wrong.
• To understand why
crushed rock powder may
have significant strength,
we must consider the
mechanism of dilational
hardening.
83
Not What It Appears To Be:
Dilational Hardening
8418:45
Dilational Hardening
• Recall that the downhole stress primarily
responsible for strengthening rock is the
differential pressure.
• Differential Pressure = Pb - Pp
Borehole
Pressure (Pb)
Pore Pressure
(Pp)
85
Dilational Hardening
• But what really matters for the strength of the
cutting is the pore pressure inside the crushed
cutting.
• Differential Pressure = Pb - Pc
Borehole
Pressure (Pb)
Pore Pressure
(Pp)
Pore Pressure in
Cutting (Pc)
86
Dilational Hardening
• As we demonstrated earlier, when a granular
material is sheared, it dilates.
• All of the dilation is concentrated in growth of
pore volume.
Borehole
Pressure (Pb)
Pore Pressure
(Pp)
Pore Pressure in
Cutting (Pc)
87
Dilational Hardening
• If the crushed rock is impermeable to the
drilling fluid (on the time-scale of cutting),
then dilation will cause the pore pressure in the
cutting to drop.
Borehole
Pressure (Pb)
Pore Pressure
(Pp)
Pore Pressure in
Cutting (Pc)
88
Dilational Hardening
• And it is common for the pore pressure in the
dilating cutting to drop to zero.
Borehole
Pressure (Pb)
Pore Pressure
(Pp)
Pore Pressure in
Cutting (Pc)
89
Dilational Hardening
• So the crushed rock material of the cutting can
be strengthened by the entire borehole
pressure.
• Differential Pressure in Cutting = Pb – 0 = Pb.
Borehole
Pressure (Pb)
Pore Pressure
(Pp)
Pore Pressure in
Cutting (Pc)
90
Dilational Hardening
• This shows the counter-intuitive result that the
very act of shearing the rock in a pressure
environment can cause the rock to be stronger.
Borehole
Pressure (Pb)
Pore Pressure
(Pp)
Pore Pressure in
Cutting (Pc)
91
Cuttings After A Test
• After a test, when we can examine cuttings like
this, they are very weak because time has
passed and the cuttings have imbibed filtrate
from the drilling fluid, weakening them.
92
Strength at Instant Created
• To evaluate the strength of the crushed rock
material, we must evaluate it at the instant that
it is created, before filtrate invades the cutting
weakening it.
Borehole
Pressure (Pb)
Pore Pressure
(Pp)
Pore Pressure in
Cutting (Pc)
93
Cutting Evaluation Bit
• A special bit was built with metal rods protruding
from the face of the bit.
• The rods are
positioned in the
paths of the
extruding cuttings.
• Some of the rods
were copper, some
brass, some mild
steel, some hard
steel.
Copper
Bronze
Mild Steel
Hard Steel
Ledgerwood (2007) 94
Cutting Evaluation Bit
• The goal was to estimate the strength of the
cutting by determining which rods the cutting
would be able to
bend as the
cutting flowed
over the rod.
Copper
Bronze
Mild Steel
Hard Steel
Ledgerwood (2007) 95
Cutting Evaluation Bit
• A test in Catoosa shale showed that the shale
cuttings bent all the rods, even the hard-steel
rods.
Ledgerwood (2007)
96
Cutting Evaluation Bit
• The orientation of the rods is colored here to
show the change.
• Red is the original orientation of the rods.
• Green is the deformed orientation of the rods.
Ledgerwood (2007)
97
Cuttings Strong When Created
• Estimates based on these tests show that at
the instant cuttings are created, they have a
strength on the same order of magnitude as the
confined strength of the original rock itself.
Scale in inches
98
Pressure Sensitive Material
• I have another demonstration which illustrates
this.
• It is a balloon, full of sand, connected to a
syringe.
99
Pressure Sensitive Material
• When the syringe plunger is in, the sand in the
balloon is easy to deform.
• And the balloon returns to its original shape
when the deforming force is taken away.
100
Pressure Sensitive Material
• But when a vacuum is pulled on the sand in the
balloon, the balloon resists deformation.
• And the balloon does not return to its normal
shape when the deforming force is taken away.
101
Pressure Sensitive Material
• This occurs because when a vacuum is pulled on
the balloon, there is atmospheric pressure on
the outside of the balloon squeezing the sand
grains together, making them more difficult to
shear.
14.7 psi 102
0 psi
Meaning of this Demonstration
• This balloon demonstration shows how loose
sand particles, like crushed rock powder, can
have high strength when it is confined.
103
Meaning of this Demonstration
• In this example, the balloon has only 14.7 psi
(one atmosphere) squeezing it.
• What if we could take this experiment to the
bottom of a borehole where there was 10,000
psi (70 MPa) psi squeezing it. Can you imagine
how strong it would be then?
103
Where Does Most Energy Go?
• Discrete element models show that most of the
energy expended while drilling under pressure
• is not expended
breaking the
elastic bonds that
hold the rock
together;
• but it is expended
deforming the
crushed powder.
Ledgerwood (2007)
104
How Much Pressure is Needed?
• Rafatian (2008), conducted single cutter
experiments investigationing the effect of
pressure on Specific Energy.
105
How Much Pressure is Needed?
• Like Cunningham, Rafatian showed that rock
strengthening during cutting under pressure is
much higher than the strengthening predicted
by the Mohr-Coulomb model.
0 1.4 2.8 4.1 5.6 (MPa)
0 200 400 600 800 (psi)
20,000
40,000
60,000
80,000
100,000
psi
138
276
414
552
689
MPa
106
How Much Pressure is Needed?
• Rafatian’s work also shows that only a couple
hundred psi (1.4 MPa) are required to change
the failure from brittle to ductile.
0 1.4 2.8 4.1 5.6 (MPa)
0 200 400 600 800 (psi)
20,000
40,000
60,000
80,000
100,000
psi
138
276
414
552
689
MPa
107
Summary So Far
• At atmospheric pressure
rocks are brittle and form
finite-sized chips of rock.
• If the confining pressure is
higher than the pore
pressure, then rocks become
ductile and fail by crushing
in volume.
• The strength of the crushed
powder is governed by the
differential pressure.
10823:15
Summary So Far (Continued)
• The process of shearing the
rock can strengthen it
because of pore dilation.
• The strength of the
crushed rock powder is high
at the instant it is created.
• Only a small increase in
pressure is required to
strengthen the rock and
change the cutting from
brittle to ductile.
109
Summary So Far (Continued)
• Most of the energy expended
while drilling downhole is spent
deforming the crushed powder,
not breaking the original
cementing bonds.
110
A Co-Conspirator:
The Effect of Drilling Mud
11124:15
Joint Industry Study
• A joint industry study
investigating the effects of bit
design and mud properties on
ROP documented that mud has a
huge effect on the ROP of bits.
• The team conducted tests in a
high-pressure drilling test
machine.
• Results were reported in Judzis
2007 and Black 2008.
112
Test Parameters
• In all tests shown here, the
following parameters were used:
• 6” (15cm) diameter PDC Bit,
• 11,000 psi (76 MPa) confining
pressure,
• 300 GPM (1135 liter/min)
flow rate.
113
Test Parameters
• The data on following slides will
show changes in ROP as the
composition of the drilling fluid
is changed between:
• Clear water,
• Clear base oil,
• 11 ppg (1.32 SG) Water-base
mud,
• 16 ppg (1.92 SG) Oil-base
mud.
114
Carthage Limestone
• The green data points show the ROPs achieved
when drilling with clear water as a drilling fluid.
0 22 44 67 89 111 (kN)
0 5 10 15 20 25 (KIPS)
40
50
60
30
20
10
0
12
15
18
9
6
3
m/hr ft/hr
0
115
Carthage Limestone
0 22 44 67 89 111 (kN)
0 5 10 15 20 25 (KIPS)
40
50
60
30
20
10
0
12
15
18
9
6
3
m/hr ft/hr
0
• The use of water-base mud reduced the ROP by
about a third.
116
Carthage Limestone
0 22 44 67 89 111 (kN)
0 5 10 15 20 25 (KIPS)
40
50
60
30
20
10
0
12
15
18
9
6
3
m/hr ft/hr
0
• The ROP with the 16 ppg oil-base mud was only
1/4 to 1/6 of that with clear water.
117
Mancos Shale
0 22 44 67 89 111 (kN)
0 5 10 15 20 25 (KIPS)
40
60
20
0
12
18
6
m/hr ft/hr
0
8024
10030
• We find similar results in Mancos shale.
• The ROP using 16 ppg oil-base mud is only about
1/6 that of the clear base oil.
118
Crab Orchard Sandstone
0 22 44 67 89 111 (kN)
0 5 10 15 20 25 (KIPS)
60
30
0
18
9
m/hr ft/hr
0
8027
• In Crab Orchard sandstone, the ROP with
water-base mud was about 1/4 that of clear
water. Oil base mud was less than a tenth.
119
Why?
0 22 44 67 89 111 (kN)
0 5 10 15 20 25 (KIPS)
60
30
0
18
9
m/hr ft/hr
0
8027
• Why should the presence of oil as a base fluid,
or weighting materials such as bentonite and
barite, cause the ROP to drop so much?
120
0
Fluid Invasion of the Cutting
• Mud properties have a strong effect on how
fast filtrate can invade the cutting.
Pore Pressure in
Cutting (Pc)
121
Fluid Invasion of the Cutting
• If fluid can invade the cutting and raise the
pore pressure in it, the cutting will become weak
and easy to drill.
Pore Pressure in
Cutting (Pc)
122
Fluid Invasion of the Cutting
• But if the mud seals the crushed cutting, then
the pore pressure will drop to zero and the
cutting will be strong and difficult to extrude.
Pore Pressure in
Cutting (Pc)
123
What Does this Story Teach?
12427:00
Model Building
• Model building is a key part of
Engineering, whether it is a
mental model, physical model, or
a mathematical one.
• A model must be sufficiently
analogous to the phenomenon of
interest to be useful.
• We must not let our intuitions
about the brittle nature of
rock, as we experience it, cloud
our reasoning of what goes on
downhole.
125
Pressure
• Pressure is the villain
stealing ROP.
• If there were a way to
eliminate the pressure, ROP
would increase.
• At one time industry
researchers sought to develop
a Pressure Fluctuating Tool.
• They demonstrated that if the
pressure could be dropped to
zero intermittently, ROP would
be like atmospheric ROP.
10,000 psi
20,000 psi
0 psi
126
Pressure
• Mud is a co-conspirator.
• Drilling mud enables pressure
to have its effect by sealing
the surfaces of rock and
cuttings and preventing
filtrate from invading them
and weakening them.
• There are big opportunities to
increase ROP through innovative
mud design which allows filtrate
to invade the crushed cutting,
while maintaining good borehole
control. 127
UCS and Friction Angle
• Ever since Cunningham, we
have used Unconfined
Compressive Strength and
Friction Angle (or
analogous parameters) to
parametrize drilling
models.
• We have known for sixty
years that such models
are inadequate to
describe downhole
drilling, but we persist
using them. 128
Mystery Remaining to be Solved
• There is a need, and an
opportunity, for
fundamental cutting
mechanics research to
identify the constitutive
properties that govern
drilling under pressure.
• What properties of
crushed rock detritus
govern strength and ROP?
129
Innovative Drilling
• For over sixty years, (Ledgerwood Jr. 1960)
researchers have investigated alternate
methods to rotary drilling including:
• Chemical,
• Electric Arc
• Electron Beam,
• Explosive,
• High Pressure Jetting
• Hammer Impact
• Laser
• Pellet Impact
• Plasma
• Pressure Fluctuations
• Thermal
• Whether future novel methods succeed
downhole will depend on researchers having the
proper models of rock downhole.
130
References
• Black, Alan D. Ronald G. Bland, David A. Curry, L.W. Ledgerwood III, Homer A.
Robertson, Arnis Judzis, Umesh Prasad, Timothy Grant, 2008, Optimization of Deep
Drilling Performance with Improvements in Drill Bit and Drilling Fluid Design,
IADC/SPE 112731
• Bredthauer, R.O., 1955, Strength Characteristics of Rock Samples Under
Hydrostatic Pressure, Rice University Master’s Thesis.
• Cunningham, R.A., The Effect of Hydrostatic Stress on the Drilling Rates of Rock
Formations, 1955, Rice University Master’s Thesis.
• Cunningham, R.A. & Eenink, J.G., 1958, Laboratory Study of the Effect of
Overburden, Formation and Mud Column Pressures on Drilling Rates of Permeable
Formations, Presented at the 33rd Annual Fall Meeting of the Society of Petroleum
Engineers, Houston.
• Detournay, E. & Tan, C.P., 2002, Dependence of Drilling Specific Energy on Bottom-
Hole Pressure in Shales, SPE/ISRM 78221, presented at the SPE/ISRM Rock
Mechanics Conference, Irving, TX.
• Dupriest, Fred E., and William L. Koederitz, 2005, Maximizing Drill Rates with Real-
Time Surveillance of Mechanical Specific Energy, SPE/IADC 92194
• Feenstra R. & J.J.M. Van Leeuwen, 1964, Full Scale Experiments on Jets in
Impermeable Rock Drilling, Journal of Petroleum Technology, March, pp 329-336.
• Garnier, A.J. and Van Lingen, 1958, N.H., Phenomena Affecting Drilling Rates at
Depth, Trans AIME 217.
131
References
• Judzis, Arnis, Bland, Ronald G., Curry, David A., Black, Alan D., Robertson, Homer A.,
Meiners, Matthew J., and Grant, Timothy C., 2007. Optimization of Deep Drilling
Performance: Benchmark testing drives ROP improvements for bit and drilling fluids.
Paper SPE/IADC 105885, presented at the SPE/IADC drilling conference,
Amsterdam, 20–22 February.
• Kühne, I.G., 1952, Die Wirkungsweise von Rotarymeiseln und anderen drehenden
Gesteinsbohrern, Sonderdruck aus der Zeitschrift, Bohrtecknik-Brunnenbau, Helf 1-
5.
• Ledgerwood, L.W. Jr., Efforts to Develop Improved Oilwell Drilling Methods,
Journal of Petroleum Technology, April 1960.
• Ledgerwood, L.W. III, PFC Modeling of Rock Cutting Under High Pressure
Conditions, in Rock Mechanics: Meeting Society’s Challenges and Demands, v 1,
Eberhardt, Erik et. al. eds., Taylor & Francis Group, London, 2007 pp 511-518.
• Ledgerwood, L.W. III, PFC3D Model of Rock Cutting under High Pressure Calibrated
to the Inelastic Region of Triaxial Tests at High Strain, Proceedings of the 6th
International Conference on Discrete Element Analysis, Boulder, CO, August 4-5,
2013.
• Pessier, R.C. & Fear, M.J., 1992, Quantifying Common Drilling Problems with
Mechanical Specific Energy and a Bit-Specific Coefficient of Sliding Friction, SPE
24584, presented at the 67th annual Technical Conference and Exhibition of the
SPE, Washington.
132
References
• Rafatian, Navid, Modeling the Effect of Pressure on Rock Strengthening
and Mechanical Specific Energy, University of Tulsa Master’s Thesis, 2008
• Rafatian, Navid, Stefan Miska, L.W. Ledgerwood, Ramadan Ahmed,
Mengjiao Yu, Nicholas Takach, Experimental Study of MSE of a Single PDC
Cutter under Simulated Pressurized Conditions, SPE 119302 SPE/IADC
Drilling Conference, Amsterdam, The Netherlands.
• Teale, R., 1964, The Concept of Specific Energy in Rock Drilling, Int. J.
Rock Mech. Mining Sci. vol 2, pp 57-73.
• Van Lingen, N.H.,, 1961, Bottom Scavenging-A Major Factor Governing
Penetration Rates At Depth, Journal of Petroleum Tech., Feb, pp 187-196.
• Von Karman, Zeitschrift des Vereines Deutscher Ingenieure No 42, Band
55, Oktober 21, 1911
133
Society of Petroleum Engineers
Distinguished Lecturer Program
www.spe.org/dl
Your Feedback is Important
Enter your section in the DL Evaluation Contest by
completing the evaluation form for this presentation
Visit SPE.org/dl
138

Leroy Ledgerwood

  • 1.
    Primary funding isprovided by The SPE Foundation through member donations and a contribution from Offshore Europe The Society is grateful to those companies that allow their professionals to serve as lecturers Additional support provided by AIME Society of Petroleum Engineers Distinguished Lecturer Program www.spe.org/dl 1
  • 2.
    Society of PetroleumEngineers Distinguished Lecturer Program www.spe.org/dl L.W. (Roy) Ledgerwood III Solving the Mystery of Low Rate of Penetration in Deep Wells 2
  • 3.
    Solving the Mystery •The Villain in Disguise: Brittle Rock • First Suspect: Mohr-Coulomb Model • Chasing the Wrong Trail: Chip Hold Down • Key Evidence: Crushed and Extruded Cuttings • Not What It Appears to Be: Dilational Hardening • A Co-Conspirator: The Effect of Drilling Mud • What Does This Story Teach? 3
  • 4.
    The Villain inDisguise: Brittle Rock 41:45
  • 5.
    Rock at AtmosphericPressure • We experience rock as a brittle material. 5
  • 6.
    Rock – AGrannular Material • Generally speaking, rock made up of grains cemented together. • The cement between the grains is what provides rock strength at atmospheric pressure. 6
  • 7.
    Bits Cause RockFailure • Two general classed of drill bits: – Drag bits scrape and shear rock. – Rolling cone bits crush rock. Early 20th Century Late 20th Century 7
  • 8.
    Roller Cone (AtmosphericFailure) • Consider one rolling cone tooth indenting rock at atmospheric pressure. 8
  • 9.
    Roller Cone (AtmosphericFailure) • First the rock immediately under the indenter (red) changes to a crushed plastic material confined by the remaining elastic material. 9
  • 10.
    Roller Cone (AtmosphericFailure) • The plastic rock causes tensile stresses in the elastic rock confining it. • Cracks initiate in the elastic rock and propagate to the free surface. 10
  • 11.
    Roller Cone (AtmosphericFailure) • Discrete chips of rock fly away from the indention area. • Each chip preserves the original fabric of the elastic rock. 11
  • 12.
    Drag Bit (AtmosphericFailure) • The process is similar when a drag-bit cutter shears rock at atmospheric pressure. 12
  • 13.
    Drag Bit (AtmosphericFailure) • The rock at the bottom of the cutter changes to a crushed plastic material confined by the remaining elastic material. 13
  • 14.
    Drag Bit (AtmosphericFailure) • The plastic rock causes tensile stresses in the elastic rock confining it. • A crack initiates and propagates to the free surface. 14
  • 15.
    Drag Bit (AtmosphericFailure) • And a discrete chip of elastic rock material flies away from the cutter. 15
  • 16.
    A High-Tech DrillingLab in 1955 • Atmospheric pressure testing was common in 1955. 16
  • 17.
    A High-Tech DrillingLab in 1955 • And they imagined that this atmospheric pressure test simulated field conditions. 17
  • 18.
    Testing Cores fromWells • Early researchers excavated actual cores from deep boreholes and then conducted rate of penetration tests in the laboratory at atmospheric pressure. • They found that the Rate of Penetration (ROP) measured at atmospheric pressure in the lab was higher than that achievable in the field. 18
  • 19.
    The Mystery • Thesame rock was easier to drill in the lab than it was when it was deep in the earth. Why? • That is the mystery, the subject of this presentation. 18
  • 20.
    Rocks Strengthen WithPressure • Theodore Von Karman had proposed, in 1911, that rock be modeled as pressure sensitive material. • Oilfield drilling researchers suspected the reduced ROP downhole was related to rock strengthening under pressure. 19
  • 21.
  • 22.
    Cunningham • In 1955,Bob Cunningham did Master’s Thesis research at Rice University in which he: • measured drilling rates in a specially-designed high-pressure microbit test machine. • He also modeled drilling mathematically. 21
  • 23.
    Microbit Test Machine Microbit Actual Bit •Cunningham designed the high- pressure test machine to use 1 ¼” (3.1 cm) diameter microbits. 22
  • 24.
    Modeling Rock Failure •Cunningham modeled the rock as a Mohr- Coulomb material. • This model may be plotted in a space of hydrostatic stress vs shear-stress. Hydrostatic Stress Shear Stress 23
  • 25.
    Mohr Space • Inthis space, a circle on the hydrostat represents a stress state. Hydrostatic Stress Shear Stress 24
  • 26.
    Compressive Strength Test •Imagine that we conduct a test in which we take a cylinder of rock and stress it axially until it fails. • We call the stress required to fail the rock the compressive strength. Compressive Strength 25
  • 27.
    Unconfined Compressive Strength •We can plot the stress at failure in this Mohr- Coulomb space as a circle intersecting the horizontal axis at the confining pressure and and at the Unconfined Compressive Strength. Hydrostatic Stress Shear Stress Confining Pressure Unconfined Compressive StrengthShear Stress 26
  • 28.
    Confined Compressive Strength •Now let’s conduct the test again but this time with confining pressure. • The rock will have a larger compressive strength when it is confined by confining pressure. Confining pressure Compressive Strength Confining pressure 27
  • 29.
    Confined Compressive Strength •We can plot the confined compressive strength with a circle as shown below. Hydrostatic Stress Shear Stress Confining Pressure Confined Compressive Strength Shear Stress 28
  • 30.
    Confined Compressive Strength •If the confining pressure is raised even more, then the material is even stronger. Hydrostatic Stress Shear Stress Confining Pressure Confined Compressive Strength Shear Stress 29
  • 31.
    Mohr Failure Envelope Hydrostatic Stress Shear Stress •We may put all the circles representing different failure strengths together and define a “failure surface” that approximates them. 30
  • 32.
    Mohr Failure Envelope •If we remove the circles, the failure envelope is left describing rock strengthening with pressure. Hydrostatic Stress Shear Stress 31
  • 33.
    Mohr Failure Envelope •If an arbitrary stress state grows to the point where it touches the failure envelope, the rock will fail. Hydrostatic Stress Shear Stress 31 Failure
  • 34.
    Mohr Failure Envelope •We can parametrize this model mathematically and use it to predict rock failure. Hydrostatic Stress Shear Stress Cohesion Friction Angle 31
  • 35.
    Cohesion and FrictionAngle • This is the model Cunningham used to model rock strengthening under pressure. • It is essentially the same model as we use today. Hydrostatic Stress Shear Stress Cohesion Friction Angle 32
  • 36.
    A Pressure SensitiveMaterial • I like to demonstrate the behavior of pressure-sensitive granular materials with some ball bearings glued to boards. • The ball bearings are an idealized representation the grains of the rock. 33
  • 37.
    A Pressure SensitiveMaterial • Imagine placing the ball bearings together as shown below. 34
  • 38.
    A Pressure SensitiveMaterial • When shear forces are applied, the two boards have to move apart, to allow the balls to slide past each other. shear force 35
  • 39.
    A Pressure SensitiveMaterial • When shear forces are applied, the two boards have to move apart, to allow the balls to slide past each other. shear force 36
  • 40.
    A Pressure SensitiveMaterial • When shear forces are applied, the two boards have to move apart, to allow the balls to slide past each other. shear force 37
  • 41.
    A Pressure SensitiveMaterial • This results in a volume expansion of the material being sheared. • Rock expands in a manner analogous to this when it is sheared. shear force 38
  • 42.
    A Pressure SensitiveMaterial • If a dead weight is set on the top piece, such that it forces the balls together, how will this affect the shear force? Weight 39
  • 43.
    A Pressure SensitiveMaterial • A dead weight forcing the grains together will increase the shear force required to shear the material. shear force Weight 40
  • 44.
    A Pressure SensitiveMaterial • As the rock shears, there is still a volume expansion which the weight resists. Weight shear force 41
  • 45.
    A Pressure SensitiveMaterial • As the rock shears, there is still a volume expansion which the weight resists. Weight shear force 42
  • 46.
    Meaning of theIllustration 1. In this illustration, the dead weight is like pressure. It makes it difficult to shear the two pieces since the balls (like grains) interlock. 2. And the whole assembly dilates as it is sheared like rock does when it is sheared. 43
  • 47.
    Downhole Pressures • Thereare many different pressures stressing rock in the earth near a borehole. • What combination of these govern reduced ROP? Borehole Pressure In Situ Pore Pressure Overburden Pressure Confining Pressure 4411:00
  • 48.
    Differential Pressure • Cunninghamand Eenink (1958) found that the difference between borehole pressure and pore pressure governs ROP. Borehole Pressure Pb In Situ Pore Pressure Pp Differential Pressure = Pb - Pp 45
  • 49.
    Mud Seals Borehole •Many rocks are permeable and drilling mud is formulated to prevent the mud from flowing into the earth. In Situ Pore Pressure Pp Borehole Pressure Pb 46
  • 50.
    Differential Pressure • Cunninghamand Eenink detected what they called a “filter cake” of mud and crushed rock sealing the surface of the borehole. In Situ Pore Pressure Pp Borehole Pressure Pb 47
  • 51.
    Mohr Coulomb Insufficient •The graphs below are some of the results of ROP reduction as a function of pressure. • The vertical scale is percent of ROP at atmospheric pressure. 48 1.0 0.8 0.6 0.4 0.2 ROPReduction 1.0 0.8 0.6 0.4 0.2 ROPReduction1 2 3 4 5 1 2 3 4 5 Pressure psi (x103) Pressure psi (x103) 7 14 21 28 35 (Mpa) 7 14 21 28 35
  • 52.
    Mohr Coulomb Insufficient •The red curves below are the measured ROP reduction as a function of differential pressure. 1 2 3 4 5 1 2 3 4 5 Pressure psi (x103) Pressure psi (x103) 1.0 0.8 0.6 0.4 0.2 1.0 0.8 0.6 0.4 0.2 ROPReduction ROPReduction Unidentified ShaleWyoming Red Beds 7 14 21 28 35 (Mpa) 7 14 21 28 35 49
  • 53.
    Mohr Coulomb Insufficient •The blue curve shows the predicted ROP reduction using the Mohr-Coulomb model. 1.0 0.8 0.6 0.4 0.2 1.0 0.8 0.6 0.4 0.2 ROPReduction ROPReduction Unidentified ShaleWyoming Red Beds 1 2 3 4 5 1 2 3 4 5 Pressure psi (x103) Pressure psi (x103) 7 14 21 28 35 (Mpa) 7 14 21 28 35 50
  • 54.
    Mohr Coulomb Insufficient •Cunningham concluded the Mohr-Coulomb model explains only part of the ROP reduction. • What causes the additional drop in ROP? 1.0 0.8 0.6 0.4 0.2 1.0 0.8 0.6 0.4 0.2 ROPReduction ROPReduction Unidentified ShaleWyoming Red Beds 1 2 3 4 5 1 2 3 4 5 Pressure psi (x103) Pressure psi (x103) 7 14 21 28 35 (Mpa) 7 14 21 28 35 51
  • 55.
    Chasing the WrongTrail: Chip Hold Down 5212:15
  • 56.
    Garnier and VanLingen • Garnier and Van Lingen (1958) used a high- pressure microbit rig and attempted to identify the other mechanism that accounts for lower penetration rates than that predicted by the Mohr-Coulomb theory. 53
  • 57.
    Chip Hold-Down • Garnierand Van Lingen imagined that in the downhole environment long brittle cracks propagate, like they do at atmospheric pressure. 54
  • 58.
    Chip Hold-Down • Butthese chips, they imagined, are held in place by the filter-cake and the downhole pressure. • They called this “chip hold-down.” 55
  • 59.
    Garnier and VanLingen • The graphs below are some of their results of ROP reduction as a function of pressure. 25 50 75 100 125 Pressure kg/cm2 5 4 3 2 1 Penetration Per Revolution (mm/rev) 56
  • 60.
    Garnier and VanLingen 25 50 75 100 125 Pressure kg/cm2 • Like Cunningham, they showed that the theoretical Mohr Coulomb model only accounted for part of the reduction in ROP. 5 4 3 2 1 Penetration Per Revolution (mm/rev) 57 Strength Effect
  • 61.
    Garnier and VanLingen 25 50 75 100 125 Pressure kg/cm2 • They hypothesized that the “chip hold-down” mechanism accounted for the additional reduction in ROP. 5 4 3 2 1 Penetration Per Revolution (mm/rev) Strength Effect Chip Hold Down Effect 58
  • 62.
    Feenstra and VanLeeuwen • Feenstra and Van Leeuwen (1964) made use of the first full- size high-pressure bit test facility to study chip hold-down. Photo courtesy of Mines Paris Tech59
  • 63.
    Feenstra and VanLeeuwen • Feenstra and Van Leeuwen recognized that chip hold-down effect was affected by bit rotary speed. 40 60 80 100 120 Pressure kg/cm2 8 4 6 2 ROP Reduction Factor 60
  • 64.
    Feenstra and VanLeeuwen • They observed that the reduction in penetration rate, due to chip hold-down was more severe at high rotary speeds. 40 60 80 100 120 Pressure kg/cm2 8 4 6 2 ROP Reduction Factor 27 RPM 65 RPM 113 RPM 315 RPM 61
  • 65.
    Feenstra and VanLeeuwen • Feenstra and Van Leeuwen imagined that drilling fluid had to invade the crack to equalize the pressure allowing excavation of the chip. 62
  • 66.
    Key Evidence: Crushed andExtruded Cuttings 6315:25
  • 67.
    Sawtooth Shaped PDCCuttings • Researchers observed that PDC bits cutting under pressure create cuttings with a saw-tooth shape. 64
  • 68.
    Sawtooth Shaped PDCCuttings • These are photos of actual cuttings. 65
  • 69.
    Morphology of theCuttings • We assumed that the saw-tooth shaped cutting was created as the rock failed in a brittle manner over and over. 66
  • 70.
    Morphology of Cuttings •First a long brittle crack propagates. 67
  • 71.
    Morphology of Cuttings •Then a chip of rock moves up. 68
  • 72.
    Morphology of Cuttings •The cutter advances loading the rock again. 69
  • 73.
    Morphology of Cuttings •Then another long crack propagates. 70
  • 74.
    Morphology of Cuttings •Then another chip moves up. 71
  • 75.
    Morphology of Cuttings •Another crack propagates. 72
  • 76.
    Morphology of Cuttings •Another chip moves up into the stack of chips making up the cutting. 73
  • 77.
    Imagining Brittle Failure •We imagined that the saw-tooth shaped cutting was a stack of rock chips each preserving the original rock morphology within the chip. 74
  • 78.
    Crushed and Extruded •Ron Bland (Black 2008) showed that these saw- tooth cuttings were not discrete “chips.” • Rather the rock is crushed and extruded. 75
  • 79.
    Crushed and Extruded •The saw-tooth shaped cuttings are easily crushable into powder. • They would not be so easily crushable if they consisted of stacked chips of un-failed rock. 76
  • 80.
    Both PDC andTricone Bits • Bland showed that this was true of cuttings generated under pressure by both PDC bits and Roller Cone bits. • He reported the size of the crushed material making up the re-compacted cutting for both PDC and roller cone bits. Average Crushed Particle Size Tricone Bit 3.7 microns PDC Bit 4.3 microns 77
  • 81.
    Drag Bits Crushand Extrude • The teeth of drill bits downhole do not drive long brittle cracks, as earlier models postulated. • Rather, they crush and extrude re-compacted rock powder (red). 78
  • 82.
    Rolling Cone BitsCrush and Extrude • This is also true of roller cone bits downhole. • They do not drive long cracks. • Rather they crush the rock and extrude the crushed material. 82 79
  • 83.
    Discrete Element Models •Discrete Element Models (DEM) of rock cutting under pressure confirm that the rock is entirely crushed. Ledgerwood, (2007) Amber balls = cemented grains Blue balls = crushed material with no bonds PDC Cutter Black dots = Pressure BC 80
  • 84.
    Discrete Element Models •DEM models predict a similar crushing and extruding process for rock under the action of a Roller Cone tooth. Ledgerwood, (2007) Rolling Cone Tooth 81
  • 85.
    Crushed Rock –A Third Material • The crushed rock powder is a third material, in addition to the cutter and the un-failed rock. This raises the question: what are the mechanical properties of the crushed rock powder? Cutter Un-failed rock 82
  • 86.
    Crushed Rock –A Third Material • We are tempted to follow our gut and assume the crushed rock has relatively low strength. • But this is wrong. • To understand why crushed rock powder may have significant strength, we must consider the mechanism of dilational hardening. 83
  • 87.
    Not What ItAppears To Be: Dilational Hardening 8418:45
  • 88.
    Dilational Hardening • Recallthat the downhole stress primarily responsible for strengthening rock is the differential pressure. • Differential Pressure = Pb - Pp Borehole Pressure (Pb) Pore Pressure (Pp) 85
  • 89.
    Dilational Hardening • Butwhat really matters for the strength of the cutting is the pore pressure inside the crushed cutting. • Differential Pressure = Pb - Pc Borehole Pressure (Pb) Pore Pressure (Pp) Pore Pressure in Cutting (Pc) 86
  • 90.
    Dilational Hardening • Aswe demonstrated earlier, when a granular material is sheared, it dilates. • All of the dilation is concentrated in growth of pore volume. Borehole Pressure (Pb) Pore Pressure (Pp) Pore Pressure in Cutting (Pc) 87
  • 91.
    Dilational Hardening • Ifthe crushed rock is impermeable to the drilling fluid (on the time-scale of cutting), then dilation will cause the pore pressure in the cutting to drop. Borehole Pressure (Pb) Pore Pressure (Pp) Pore Pressure in Cutting (Pc) 88
  • 92.
    Dilational Hardening • Andit is common for the pore pressure in the dilating cutting to drop to zero. Borehole Pressure (Pb) Pore Pressure (Pp) Pore Pressure in Cutting (Pc) 89
  • 93.
    Dilational Hardening • Sothe crushed rock material of the cutting can be strengthened by the entire borehole pressure. • Differential Pressure in Cutting = Pb – 0 = Pb. Borehole Pressure (Pb) Pore Pressure (Pp) Pore Pressure in Cutting (Pc) 90
  • 94.
    Dilational Hardening • Thisshows the counter-intuitive result that the very act of shearing the rock in a pressure environment can cause the rock to be stronger. Borehole Pressure (Pb) Pore Pressure (Pp) Pore Pressure in Cutting (Pc) 91
  • 95.
    Cuttings After ATest • After a test, when we can examine cuttings like this, they are very weak because time has passed and the cuttings have imbibed filtrate from the drilling fluid, weakening them. 92
  • 96.
    Strength at InstantCreated • To evaluate the strength of the crushed rock material, we must evaluate it at the instant that it is created, before filtrate invades the cutting weakening it. Borehole Pressure (Pb) Pore Pressure (Pp) Pore Pressure in Cutting (Pc) 93
  • 97.
    Cutting Evaluation Bit •A special bit was built with metal rods protruding from the face of the bit. • The rods are positioned in the paths of the extruding cuttings. • Some of the rods were copper, some brass, some mild steel, some hard steel. Copper Bronze Mild Steel Hard Steel Ledgerwood (2007) 94
  • 98.
    Cutting Evaluation Bit •The goal was to estimate the strength of the cutting by determining which rods the cutting would be able to bend as the cutting flowed over the rod. Copper Bronze Mild Steel Hard Steel Ledgerwood (2007) 95
  • 99.
    Cutting Evaluation Bit •A test in Catoosa shale showed that the shale cuttings bent all the rods, even the hard-steel rods. Ledgerwood (2007) 96
  • 100.
    Cutting Evaluation Bit •The orientation of the rods is colored here to show the change. • Red is the original orientation of the rods. • Green is the deformed orientation of the rods. Ledgerwood (2007) 97
  • 101.
    Cuttings Strong WhenCreated • Estimates based on these tests show that at the instant cuttings are created, they have a strength on the same order of magnitude as the confined strength of the original rock itself. Scale in inches 98
  • 102.
    Pressure Sensitive Material •I have another demonstration which illustrates this. • It is a balloon, full of sand, connected to a syringe. 99
  • 103.
    Pressure Sensitive Material •When the syringe plunger is in, the sand in the balloon is easy to deform. • And the balloon returns to its original shape when the deforming force is taken away. 100
  • 104.
    Pressure Sensitive Material •But when a vacuum is pulled on the sand in the balloon, the balloon resists deformation. • And the balloon does not return to its normal shape when the deforming force is taken away. 101
  • 105.
    Pressure Sensitive Material •This occurs because when a vacuum is pulled on the balloon, there is atmospheric pressure on the outside of the balloon squeezing the sand grains together, making them more difficult to shear. 14.7 psi 102 0 psi
  • 106.
    Meaning of thisDemonstration • This balloon demonstration shows how loose sand particles, like crushed rock powder, can have high strength when it is confined. 103
  • 107.
    Meaning of thisDemonstration • In this example, the balloon has only 14.7 psi (one atmosphere) squeezing it. • What if we could take this experiment to the bottom of a borehole where there was 10,000 psi (70 MPa) psi squeezing it. Can you imagine how strong it would be then? 103
  • 108.
    Where Does MostEnergy Go? • Discrete element models show that most of the energy expended while drilling under pressure • is not expended breaking the elastic bonds that hold the rock together; • but it is expended deforming the crushed powder. Ledgerwood (2007) 104
  • 109.
    How Much Pressureis Needed? • Rafatian (2008), conducted single cutter experiments investigationing the effect of pressure on Specific Energy. 105
  • 110.
    How Much Pressureis Needed? • Like Cunningham, Rafatian showed that rock strengthening during cutting under pressure is much higher than the strengthening predicted by the Mohr-Coulomb model. 0 1.4 2.8 4.1 5.6 (MPa) 0 200 400 600 800 (psi) 20,000 40,000 60,000 80,000 100,000 psi 138 276 414 552 689 MPa 106
  • 111.
    How Much Pressureis Needed? • Rafatian’s work also shows that only a couple hundred psi (1.4 MPa) are required to change the failure from brittle to ductile. 0 1.4 2.8 4.1 5.6 (MPa) 0 200 400 600 800 (psi) 20,000 40,000 60,000 80,000 100,000 psi 138 276 414 552 689 MPa 107
  • 112.
    Summary So Far •At atmospheric pressure rocks are brittle and form finite-sized chips of rock. • If the confining pressure is higher than the pore pressure, then rocks become ductile and fail by crushing in volume. • The strength of the crushed powder is governed by the differential pressure. 10823:15
  • 113.
    Summary So Far(Continued) • The process of shearing the rock can strengthen it because of pore dilation. • The strength of the crushed rock powder is high at the instant it is created. • Only a small increase in pressure is required to strengthen the rock and change the cutting from brittle to ductile. 109
  • 114.
    Summary So Far(Continued) • Most of the energy expended while drilling downhole is spent deforming the crushed powder, not breaking the original cementing bonds. 110
  • 115.
    A Co-Conspirator: The Effectof Drilling Mud 11124:15
  • 116.
    Joint Industry Study •A joint industry study investigating the effects of bit design and mud properties on ROP documented that mud has a huge effect on the ROP of bits. • The team conducted tests in a high-pressure drilling test machine. • Results were reported in Judzis 2007 and Black 2008. 112
  • 117.
    Test Parameters • Inall tests shown here, the following parameters were used: • 6” (15cm) diameter PDC Bit, • 11,000 psi (76 MPa) confining pressure, • 300 GPM (1135 liter/min) flow rate. 113
  • 118.
    Test Parameters • Thedata on following slides will show changes in ROP as the composition of the drilling fluid is changed between: • Clear water, • Clear base oil, • 11 ppg (1.32 SG) Water-base mud, • 16 ppg (1.92 SG) Oil-base mud. 114
  • 119.
    Carthage Limestone • Thegreen data points show the ROPs achieved when drilling with clear water as a drilling fluid. 0 22 44 67 89 111 (kN) 0 5 10 15 20 25 (KIPS) 40 50 60 30 20 10 0 12 15 18 9 6 3 m/hr ft/hr 0 115
  • 120.
    Carthage Limestone 0 2244 67 89 111 (kN) 0 5 10 15 20 25 (KIPS) 40 50 60 30 20 10 0 12 15 18 9 6 3 m/hr ft/hr 0 • The use of water-base mud reduced the ROP by about a third. 116
  • 121.
    Carthage Limestone 0 2244 67 89 111 (kN) 0 5 10 15 20 25 (KIPS) 40 50 60 30 20 10 0 12 15 18 9 6 3 m/hr ft/hr 0 • The ROP with the 16 ppg oil-base mud was only 1/4 to 1/6 of that with clear water. 117
  • 122.
    Mancos Shale 0 2244 67 89 111 (kN) 0 5 10 15 20 25 (KIPS) 40 60 20 0 12 18 6 m/hr ft/hr 0 8024 10030 • We find similar results in Mancos shale. • The ROP using 16 ppg oil-base mud is only about 1/6 that of the clear base oil. 118
  • 123.
    Crab Orchard Sandstone 022 44 67 89 111 (kN) 0 5 10 15 20 25 (KIPS) 60 30 0 18 9 m/hr ft/hr 0 8027 • In Crab Orchard sandstone, the ROP with water-base mud was about 1/4 that of clear water. Oil base mud was less than a tenth. 119
  • 124.
    Why? 0 22 4467 89 111 (kN) 0 5 10 15 20 25 (KIPS) 60 30 0 18 9 m/hr ft/hr 0 8027 • Why should the presence of oil as a base fluid, or weighting materials such as bentonite and barite, cause the ROP to drop so much? 120 0
  • 125.
    Fluid Invasion ofthe Cutting • Mud properties have a strong effect on how fast filtrate can invade the cutting. Pore Pressure in Cutting (Pc) 121
  • 126.
    Fluid Invasion ofthe Cutting • If fluid can invade the cutting and raise the pore pressure in it, the cutting will become weak and easy to drill. Pore Pressure in Cutting (Pc) 122
  • 127.
    Fluid Invasion ofthe Cutting • But if the mud seals the crushed cutting, then the pore pressure will drop to zero and the cutting will be strong and difficult to extrude. Pore Pressure in Cutting (Pc) 123
  • 128.
    What Does thisStory Teach? 12427:00
  • 129.
    Model Building • Modelbuilding is a key part of Engineering, whether it is a mental model, physical model, or a mathematical one. • A model must be sufficiently analogous to the phenomenon of interest to be useful. • We must not let our intuitions about the brittle nature of rock, as we experience it, cloud our reasoning of what goes on downhole. 125
  • 130.
    Pressure • Pressure isthe villain stealing ROP. • If there were a way to eliminate the pressure, ROP would increase. • At one time industry researchers sought to develop a Pressure Fluctuating Tool. • They demonstrated that if the pressure could be dropped to zero intermittently, ROP would be like atmospheric ROP. 10,000 psi 20,000 psi 0 psi 126
  • 131.
    Pressure • Mud isa co-conspirator. • Drilling mud enables pressure to have its effect by sealing the surfaces of rock and cuttings and preventing filtrate from invading them and weakening them. • There are big opportunities to increase ROP through innovative mud design which allows filtrate to invade the crushed cutting, while maintaining good borehole control. 127
  • 132.
    UCS and FrictionAngle • Ever since Cunningham, we have used Unconfined Compressive Strength and Friction Angle (or analogous parameters) to parametrize drilling models. • We have known for sixty years that such models are inadequate to describe downhole drilling, but we persist using them. 128
  • 133.
    Mystery Remaining tobe Solved • There is a need, and an opportunity, for fundamental cutting mechanics research to identify the constitutive properties that govern drilling under pressure. • What properties of crushed rock detritus govern strength and ROP? 129
  • 134.
    Innovative Drilling • Forover sixty years, (Ledgerwood Jr. 1960) researchers have investigated alternate methods to rotary drilling including: • Chemical, • Electric Arc • Electron Beam, • Explosive, • High Pressure Jetting • Hammer Impact • Laser • Pellet Impact • Plasma • Pressure Fluctuations • Thermal • Whether future novel methods succeed downhole will depend on researchers having the proper models of rock downhole. 130
  • 135.
    References • Black, AlanD. Ronald G. Bland, David A. Curry, L.W. Ledgerwood III, Homer A. Robertson, Arnis Judzis, Umesh Prasad, Timothy Grant, 2008, Optimization of Deep Drilling Performance with Improvements in Drill Bit and Drilling Fluid Design, IADC/SPE 112731 • Bredthauer, R.O., 1955, Strength Characteristics of Rock Samples Under Hydrostatic Pressure, Rice University Master’s Thesis. • Cunningham, R.A., The Effect of Hydrostatic Stress on the Drilling Rates of Rock Formations, 1955, Rice University Master’s Thesis. • Cunningham, R.A. & Eenink, J.G., 1958, Laboratory Study of the Effect of Overburden, Formation and Mud Column Pressures on Drilling Rates of Permeable Formations, Presented at the 33rd Annual Fall Meeting of the Society of Petroleum Engineers, Houston. • Detournay, E. & Tan, C.P., 2002, Dependence of Drilling Specific Energy on Bottom- Hole Pressure in Shales, SPE/ISRM 78221, presented at the SPE/ISRM Rock Mechanics Conference, Irving, TX. • Dupriest, Fred E., and William L. Koederitz, 2005, Maximizing Drill Rates with Real- Time Surveillance of Mechanical Specific Energy, SPE/IADC 92194 • Feenstra R. & J.J.M. Van Leeuwen, 1964, Full Scale Experiments on Jets in Impermeable Rock Drilling, Journal of Petroleum Technology, March, pp 329-336. • Garnier, A.J. and Van Lingen, 1958, N.H., Phenomena Affecting Drilling Rates at Depth, Trans AIME 217. 131
  • 136.
    References • Judzis, Arnis,Bland, Ronald G., Curry, David A., Black, Alan D., Robertson, Homer A., Meiners, Matthew J., and Grant, Timothy C., 2007. Optimization of Deep Drilling Performance: Benchmark testing drives ROP improvements for bit and drilling fluids. Paper SPE/IADC 105885, presented at the SPE/IADC drilling conference, Amsterdam, 20–22 February. • Kühne, I.G., 1952, Die Wirkungsweise von Rotarymeiseln und anderen drehenden Gesteinsbohrern, Sonderdruck aus der Zeitschrift, Bohrtecknik-Brunnenbau, Helf 1- 5. • Ledgerwood, L.W. Jr., Efforts to Develop Improved Oilwell Drilling Methods, Journal of Petroleum Technology, April 1960. • Ledgerwood, L.W. III, PFC Modeling of Rock Cutting Under High Pressure Conditions, in Rock Mechanics: Meeting Society’s Challenges and Demands, v 1, Eberhardt, Erik et. al. eds., Taylor & Francis Group, London, 2007 pp 511-518. • Ledgerwood, L.W. III, PFC3D Model of Rock Cutting under High Pressure Calibrated to the Inelastic Region of Triaxial Tests at High Strain, Proceedings of the 6th International Conference on Discrete Element Analysis, Boulder, CO, August 4-5, 2013. • Pessier, R.C. & Fear, M.J., 1992, Quantifying Common Drilling Problems with Mechanical Specific Energy and a Bit-Specific Coefficient of Sliding Friction, SPE 24584, presented at the 67th annual Technical Conference and Exhibition of the SPE, Washington. 132
  • 137.
    References • Rafatian, Navid,Modeling the Effect of Pressure on Rock Strengthening and Mechanical Specific Energy, University of Tulsa Master’s Thesis, 2008 • Rafatian, Navid, Stefan Miska, L.W. Ledgerwood, Ramadan Ahmed, Mengjiao Yu, Nicholas Takach, Experimental Study of MSE of a Single PDC Cutter under Simulated Pressurized Conditions, SPE 119302 SPE/IADC Drilling Conference, Amsterdam, The Netherlands. • Teale, R., 1964, The Concept of Specific Energy in Rock Drilling, Int. J. Rock Mech. Mining Sci. vol 2, pp 57-73. • Van Lingen, N.H.,, 1961, Bottom Scavenging-A Major Factor Governing Penetration Rates At Depth, Journal of Petroleum Tech., Feb, pp 187-196. • Von Karman, Zeitschrift des Vereines Deutscher Ingenieure No 42, Band 55, Oktober 21, 1911 133
  • 138.
    Society of PetroleumEngineers Distinguished Lecturer Program www.spe.org/dl Your Feedback is Important Enter your section in the DL Evaluation Contest by completing the evaluation form for this presentation Visit SPE.org/dl 138