Download as PDF, PPTX

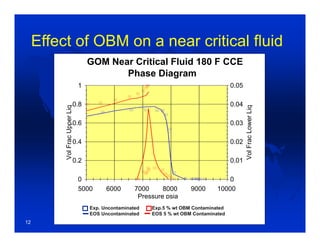
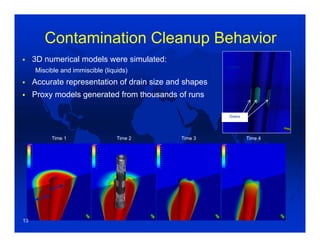
![10
-2
10
-1
10
0
10
1
10
2
10
-2
10
-1
10
0
Time [hrs]
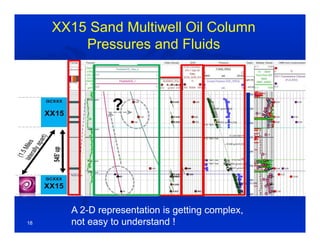
Contamination
5% contamination
Saturn 3D Radial Probe
XLD Probe
Dual Packers
3D Radial Probe
Tool Cleanup
time
(5%)
[hrs]
3D Radial Probe 0.71
Extra Large
Dimension Probe
9.10
Dual Packers 1.00
3 Dimensional
Radial Probe
Probe Dual Packers
Contamination Cleanup Behaviour
Slope = -
5/12
Slope
= -2/3
1414](https://image.slidesharecdn.com/cosanayan-190821142548/85/Cosan-Ayan-14-320.jpg)
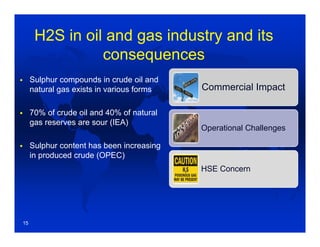
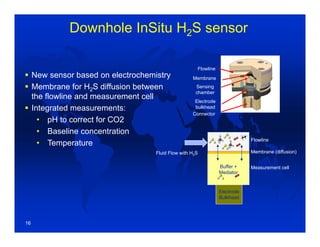
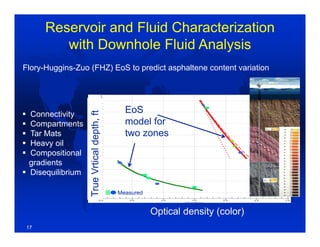


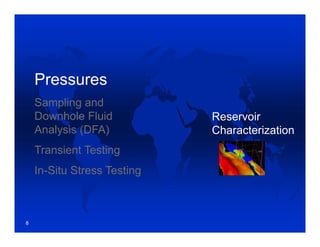
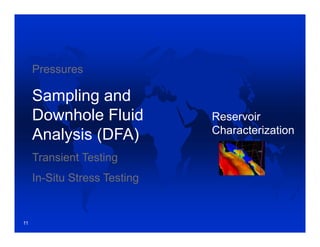
The document summarizes a presentation on using wireline formation testing (WFT) to characterize reservoirs and reduce uncertainties. It discusses how WFT can be used to measure pressures, sample and analyze downhole fluids, conduct transient tests, and test in-situ stresses. The results from these WFT analyses can be integrated into reservoir modeling workflows and help understand properties like permeability, fluid contacts, and the safe drilling window. Advanced sensors and improved transient testing capabilities in new generation WFT tools are providing more downhole data to reduce risks in reservoir evaluation.