Downloaded 1,533 times
![Vector data model Vector geometry types Point Centroid Line Boundary Area (boundary + centroid) face (3D area) [kernel (3D centroid)] [volumes (faces + kernel)] Geometry is true 3D: x, y, z Line Faces not in all GIS! Node Node Vertex Vertex Segment Segment Segment Node Boundary Vertex Vertex Vertex Vertex Centroid Area](https://image.slidesharecdn.com/grasscomo2006v3-1226565404091374-9/75/The-GRASS-GIS-software-with-QGIS-GIS-Seminar-8-2048.jpg)
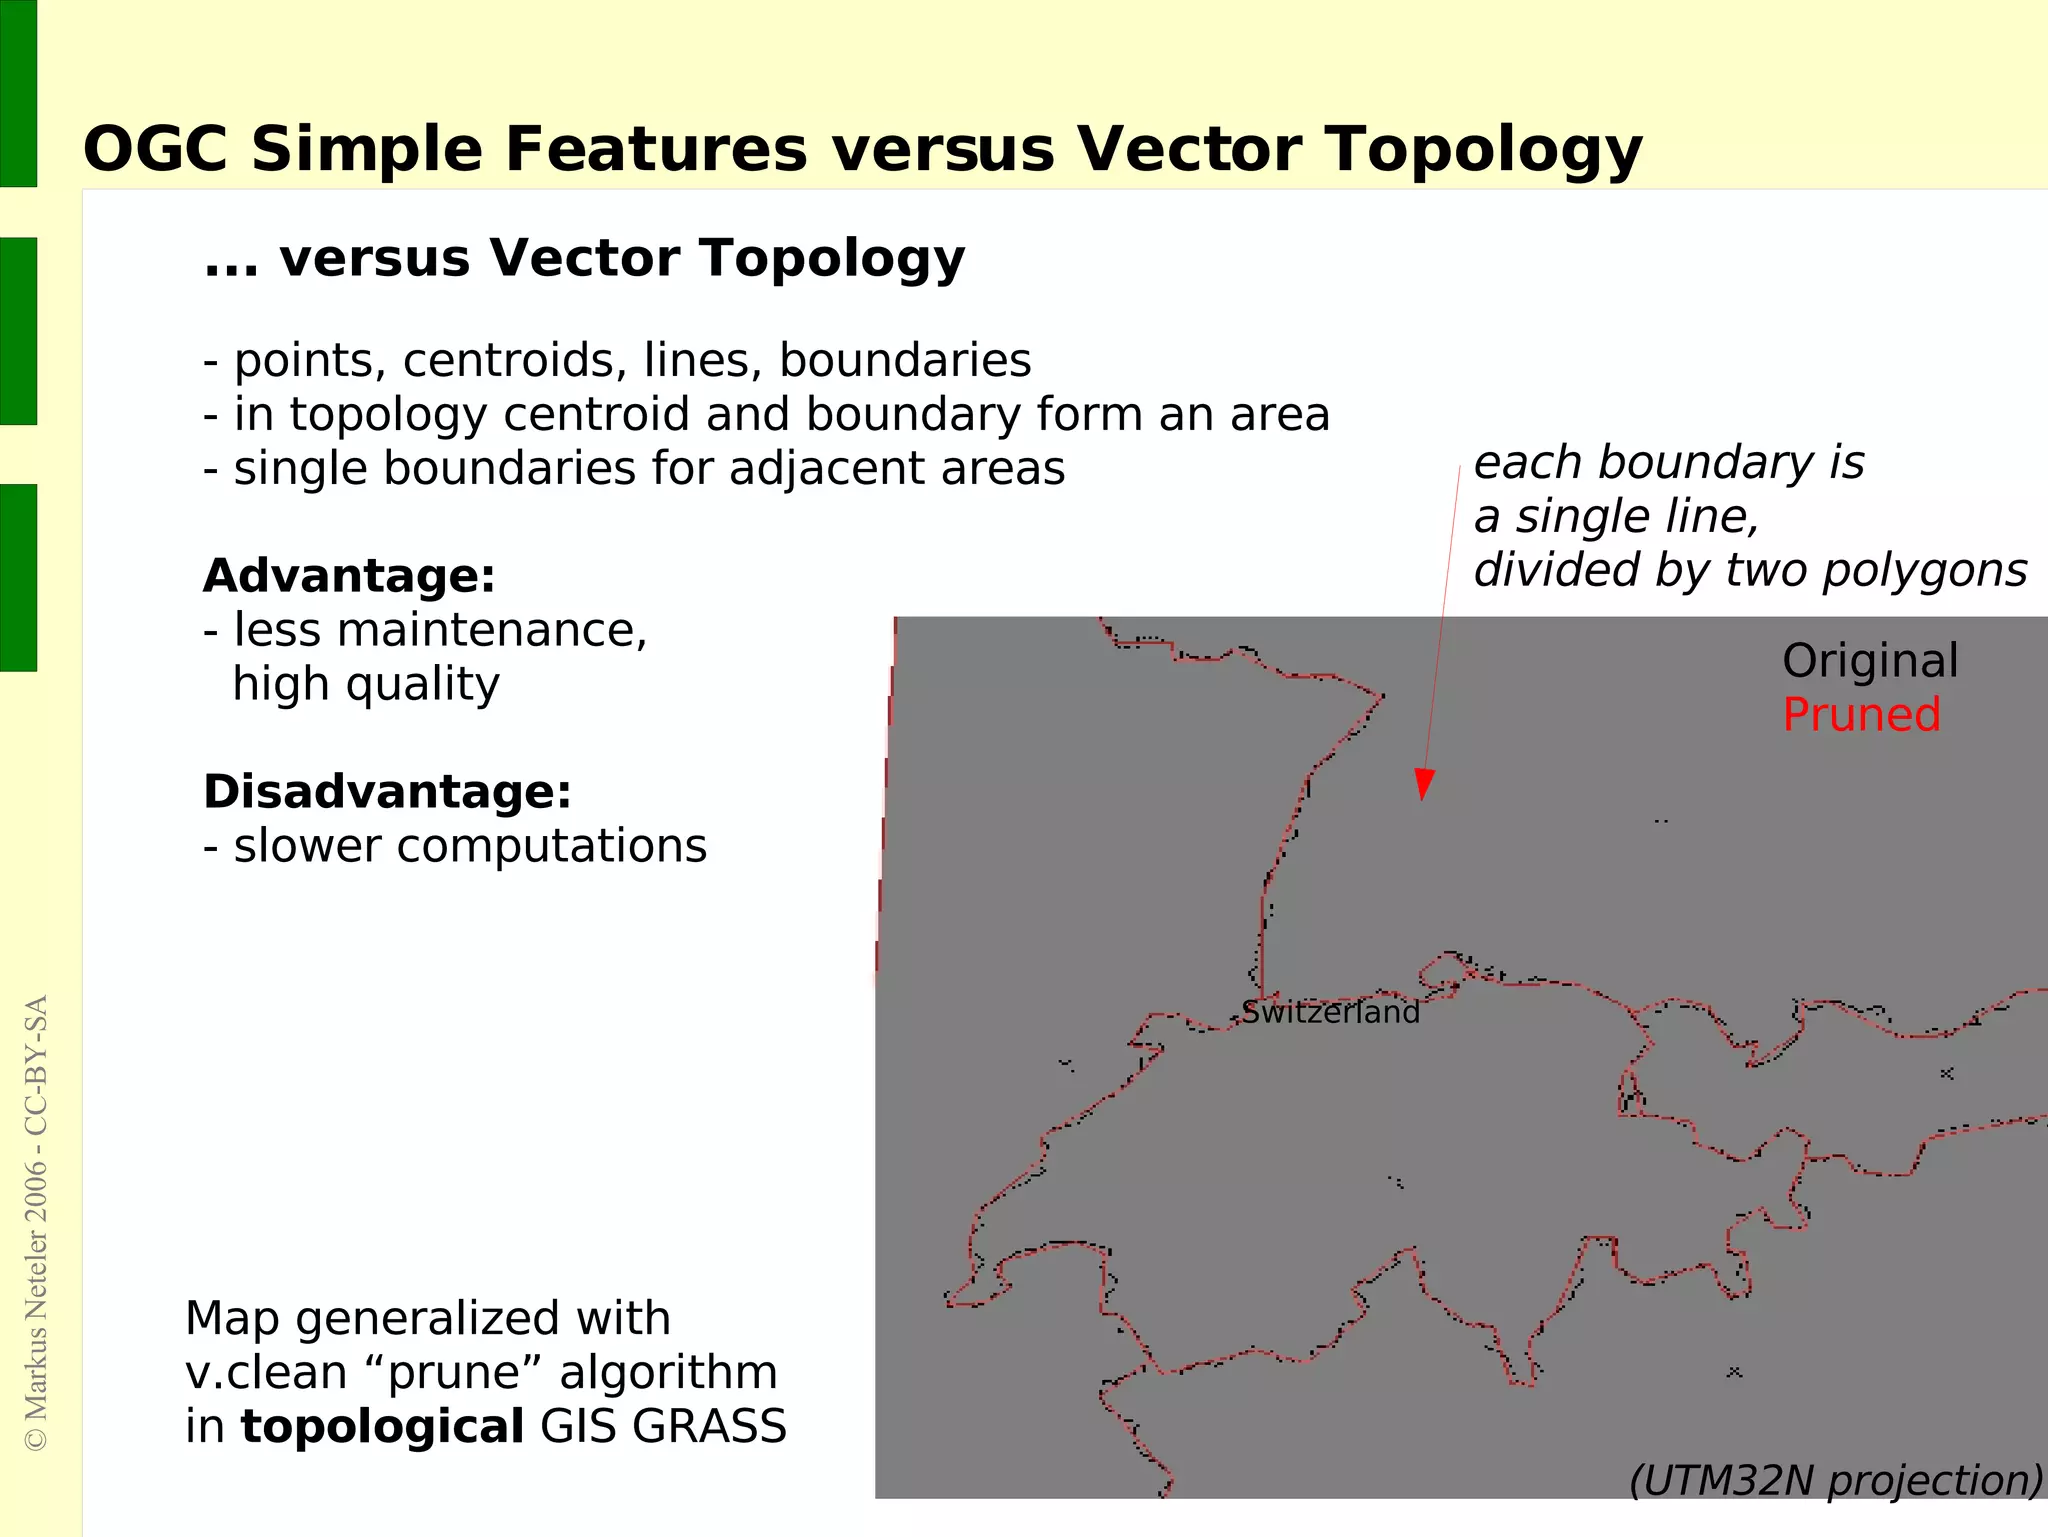
![Italy: Gauss-Boaga Fuso Ovest ESRI PRJ-File for Fuso Ovest (g.proj -w in GRASS) PROJCS[" Monte_Mario_Italy_1 ", GEOGCS[" GCS_Monte_Mario ", DATUM[" Monte_Mario ", SPHEROID[" International_1924 ", 6378388 , 297 ]], PRIMEM[" Greenwich ", 0 ], UNIT[" Degree ", 0.017453292519943295 ]], PROJECTION[" Transverse_Mercator "], PARAMETER[" False_Easting ", 1500000 ], PARAMETER[" False_Northing ", 0 ], PARAMETER[" Central_Meridian ", 9 ], PARAMETER[" Scale_Factor ", 0.9996 ], PARAMETER[" Latitude_Of_Origin ", 0 ], UNIT[" Meter ", 1 ]] EPSG codes: Gauss-Boaga/Monte Mario 1: EPSG 26591 Gauss-Boaga/Monte Mario 2: EPSG 26592](https://image.slidesharecdn.com/grasscomo2006v3-1226565404091374-9/75/The-GRASS-GIS-software-with-QGIS-GIS-Seminar-12-2048.jpg)
![GRASS 6 Vector data Vector geometry types Point Centroid Line Boundary Area (boundary + centroid) face (3D area) [kernel (3D centroid)] [volumes (faces + kernel)] Geometry is true 3D: x, y, z Line Faces Node Node Vertex Vertex Segment Segment Segment Node Boundary Vertex Vertex Vertex Vertex Centroid Area](https://image.slidesharecdn.com/grasscomo2006v3-1226565404091374-9/75/The-GRASS-GIS-software-with-QGIS-GIS-Seminar-48-2048.jpg)

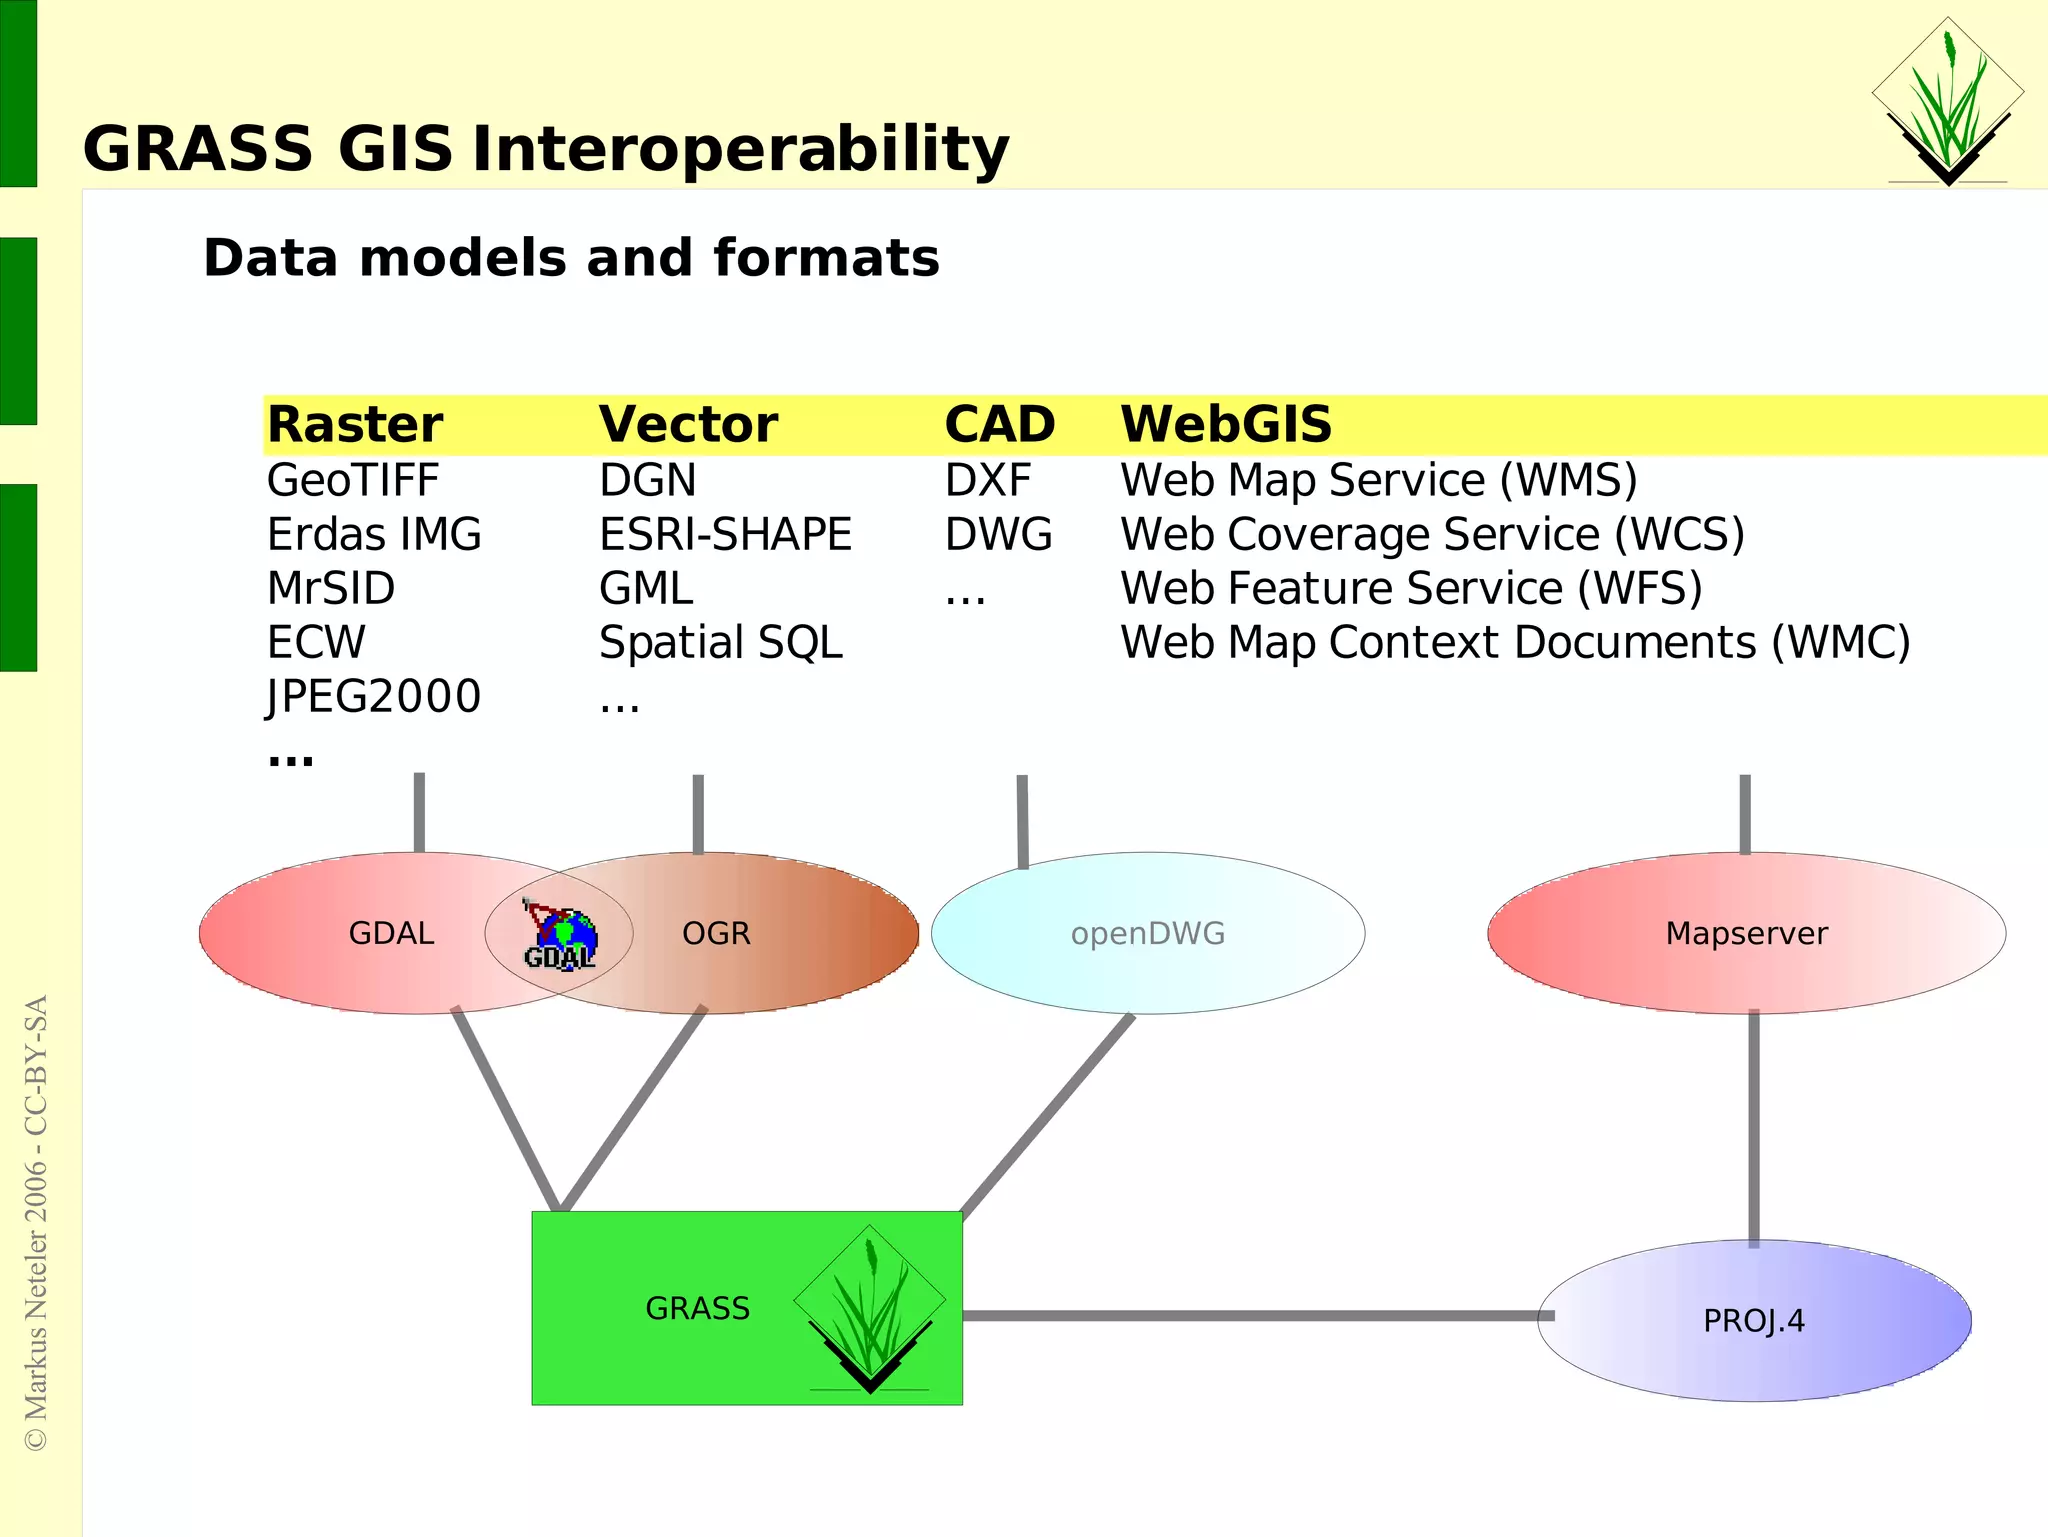
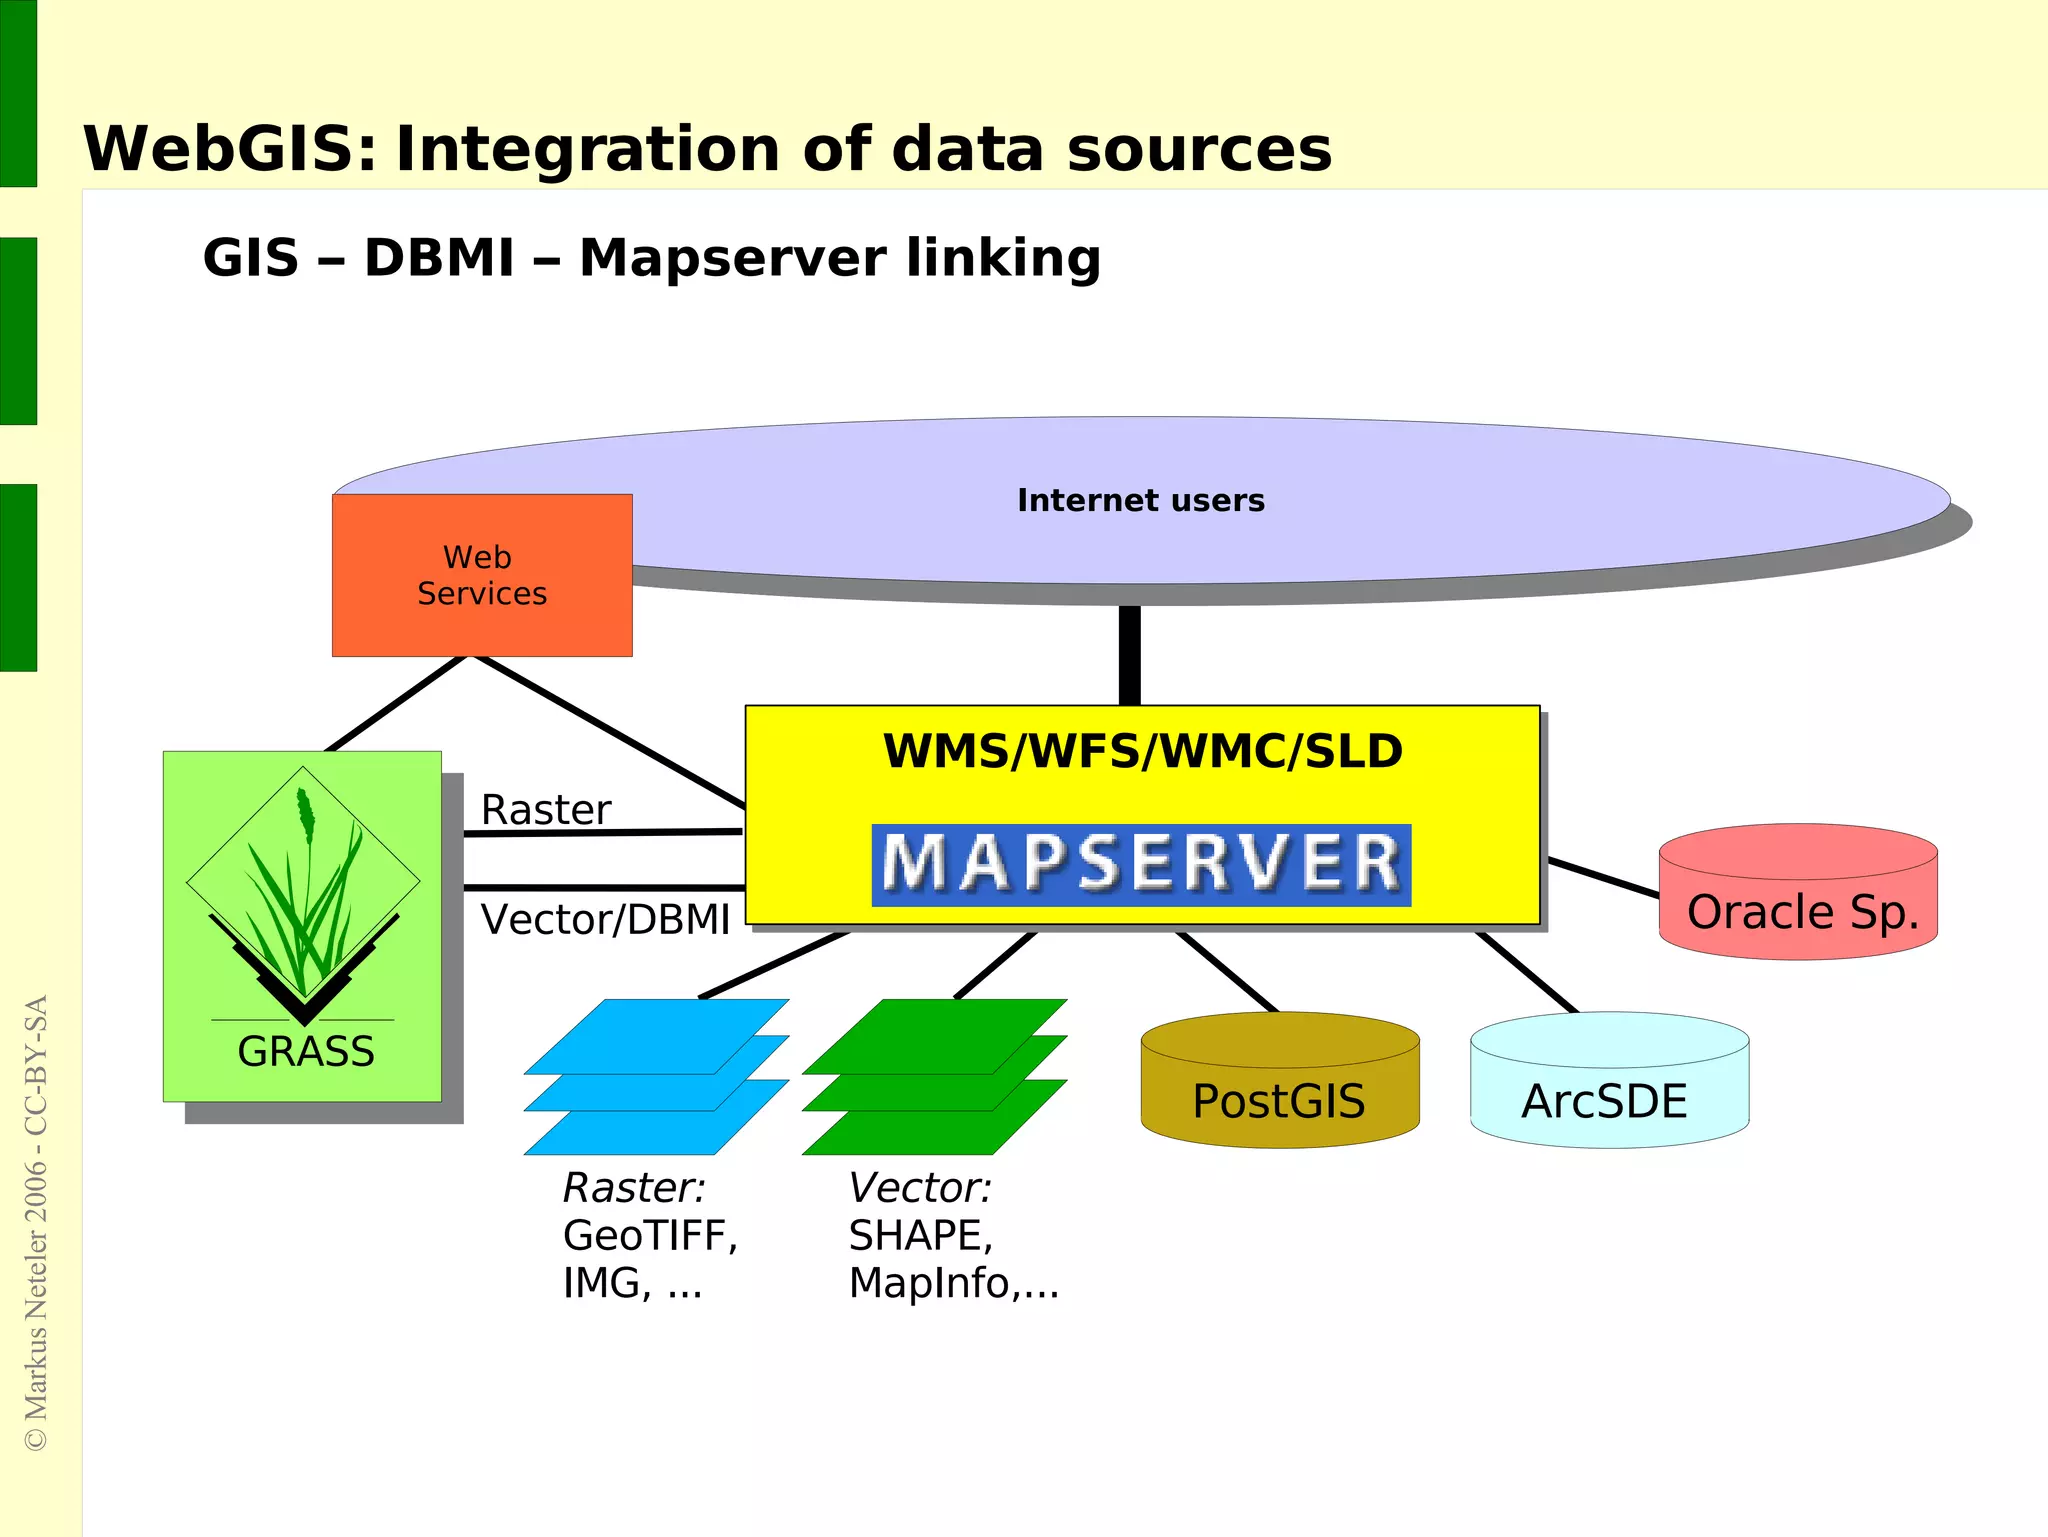
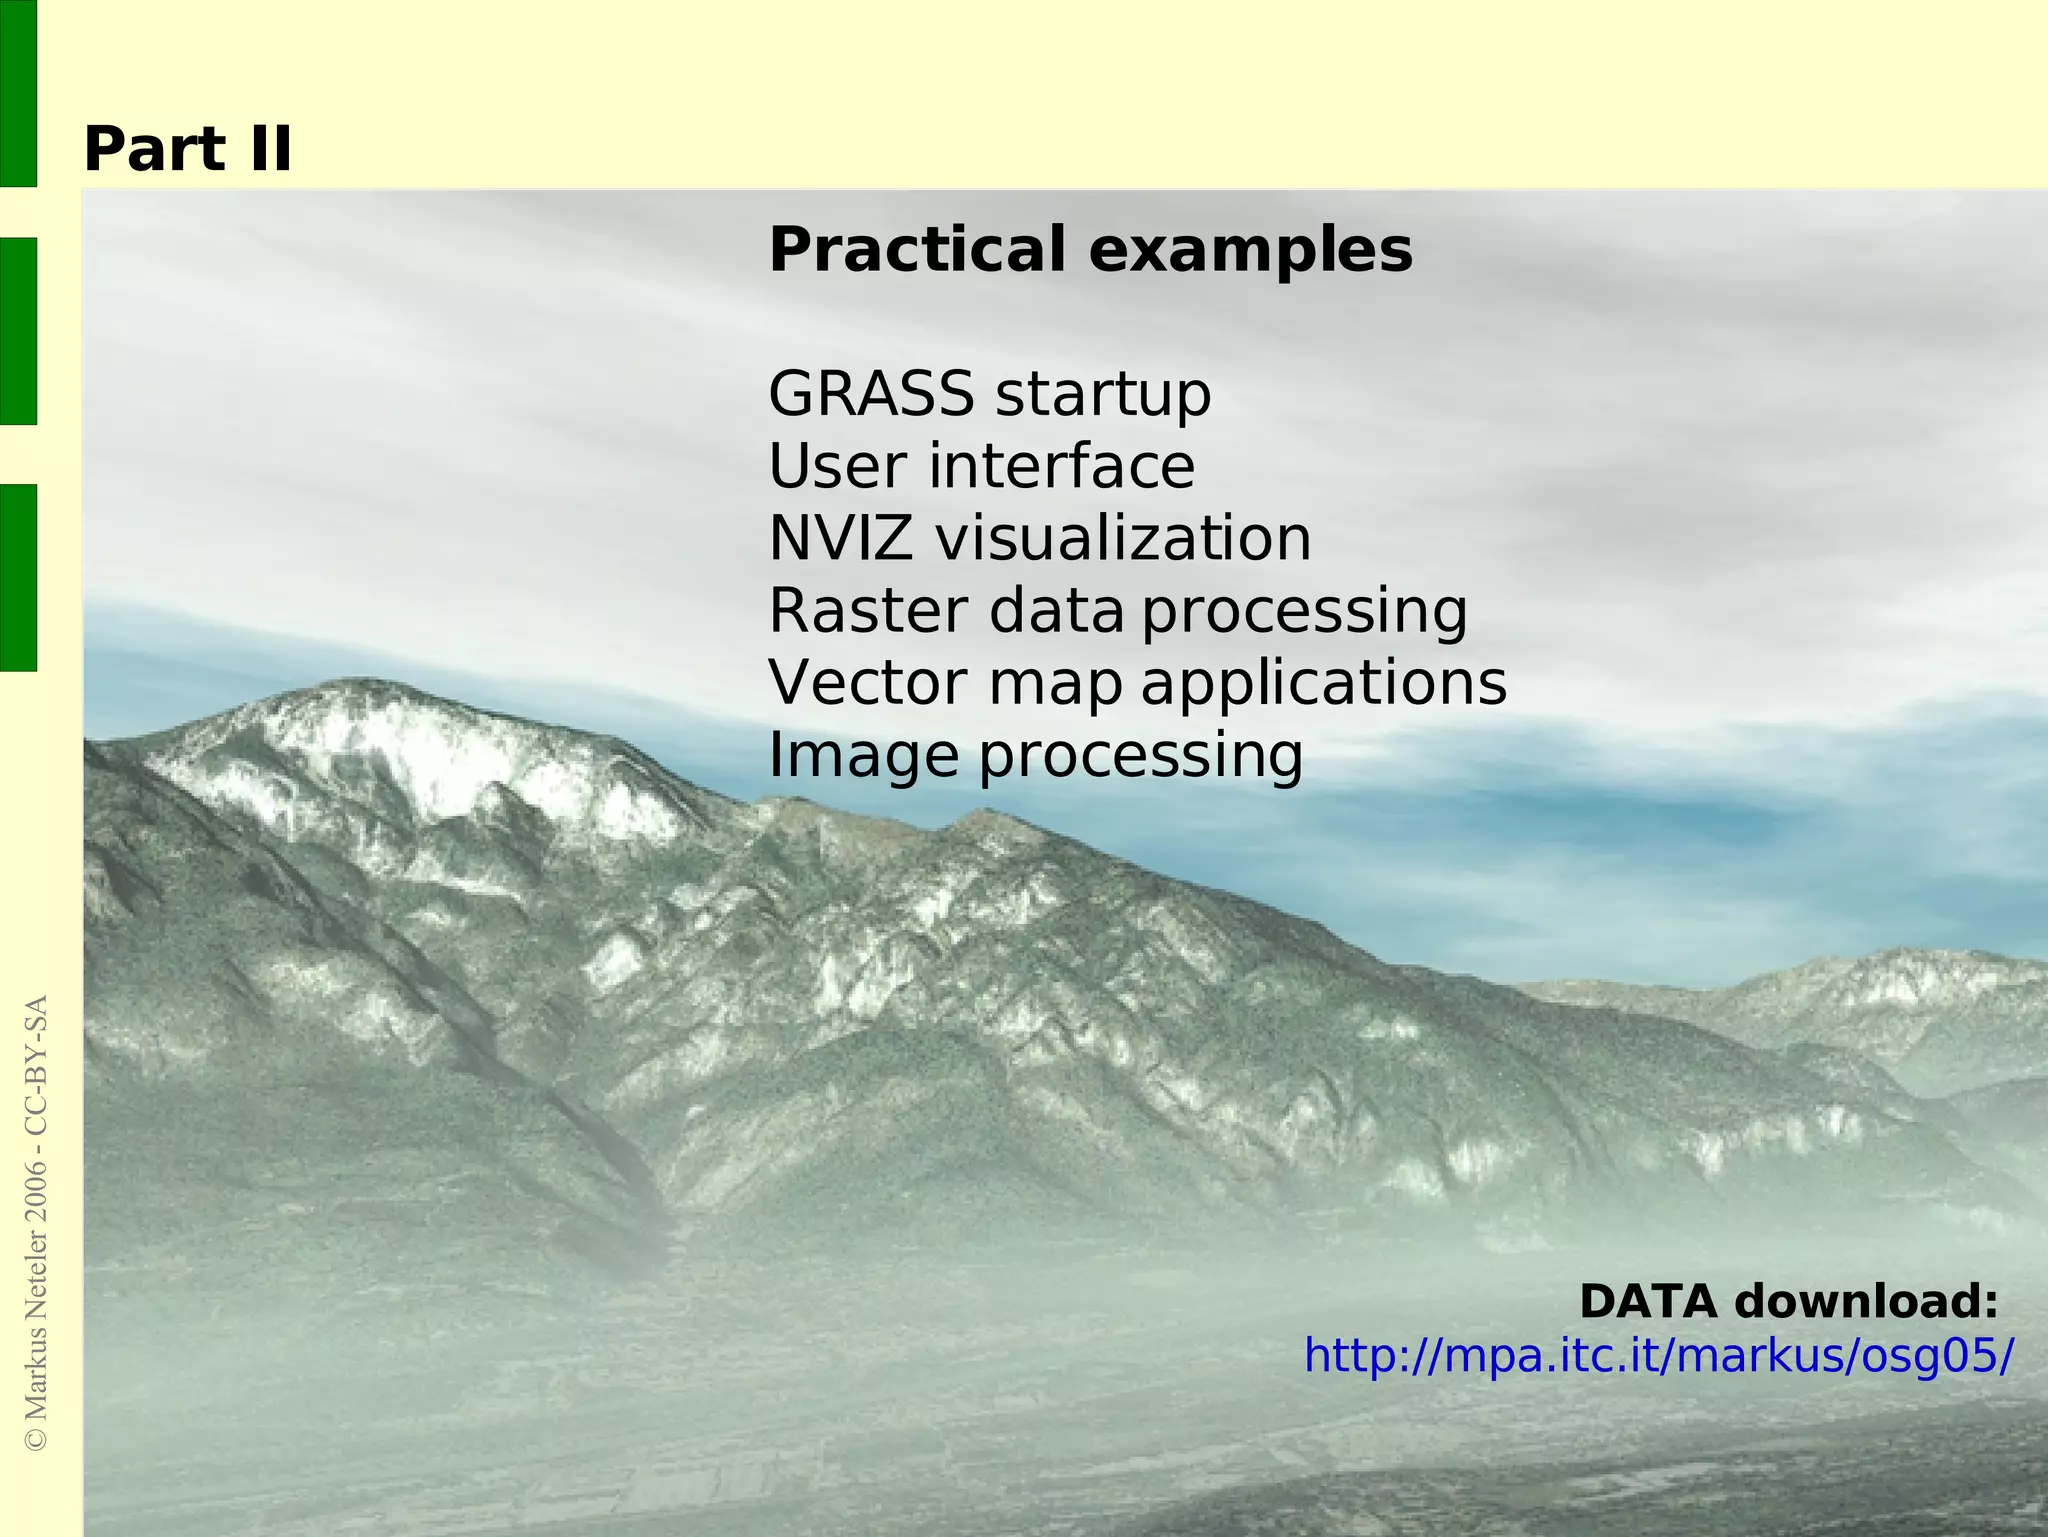
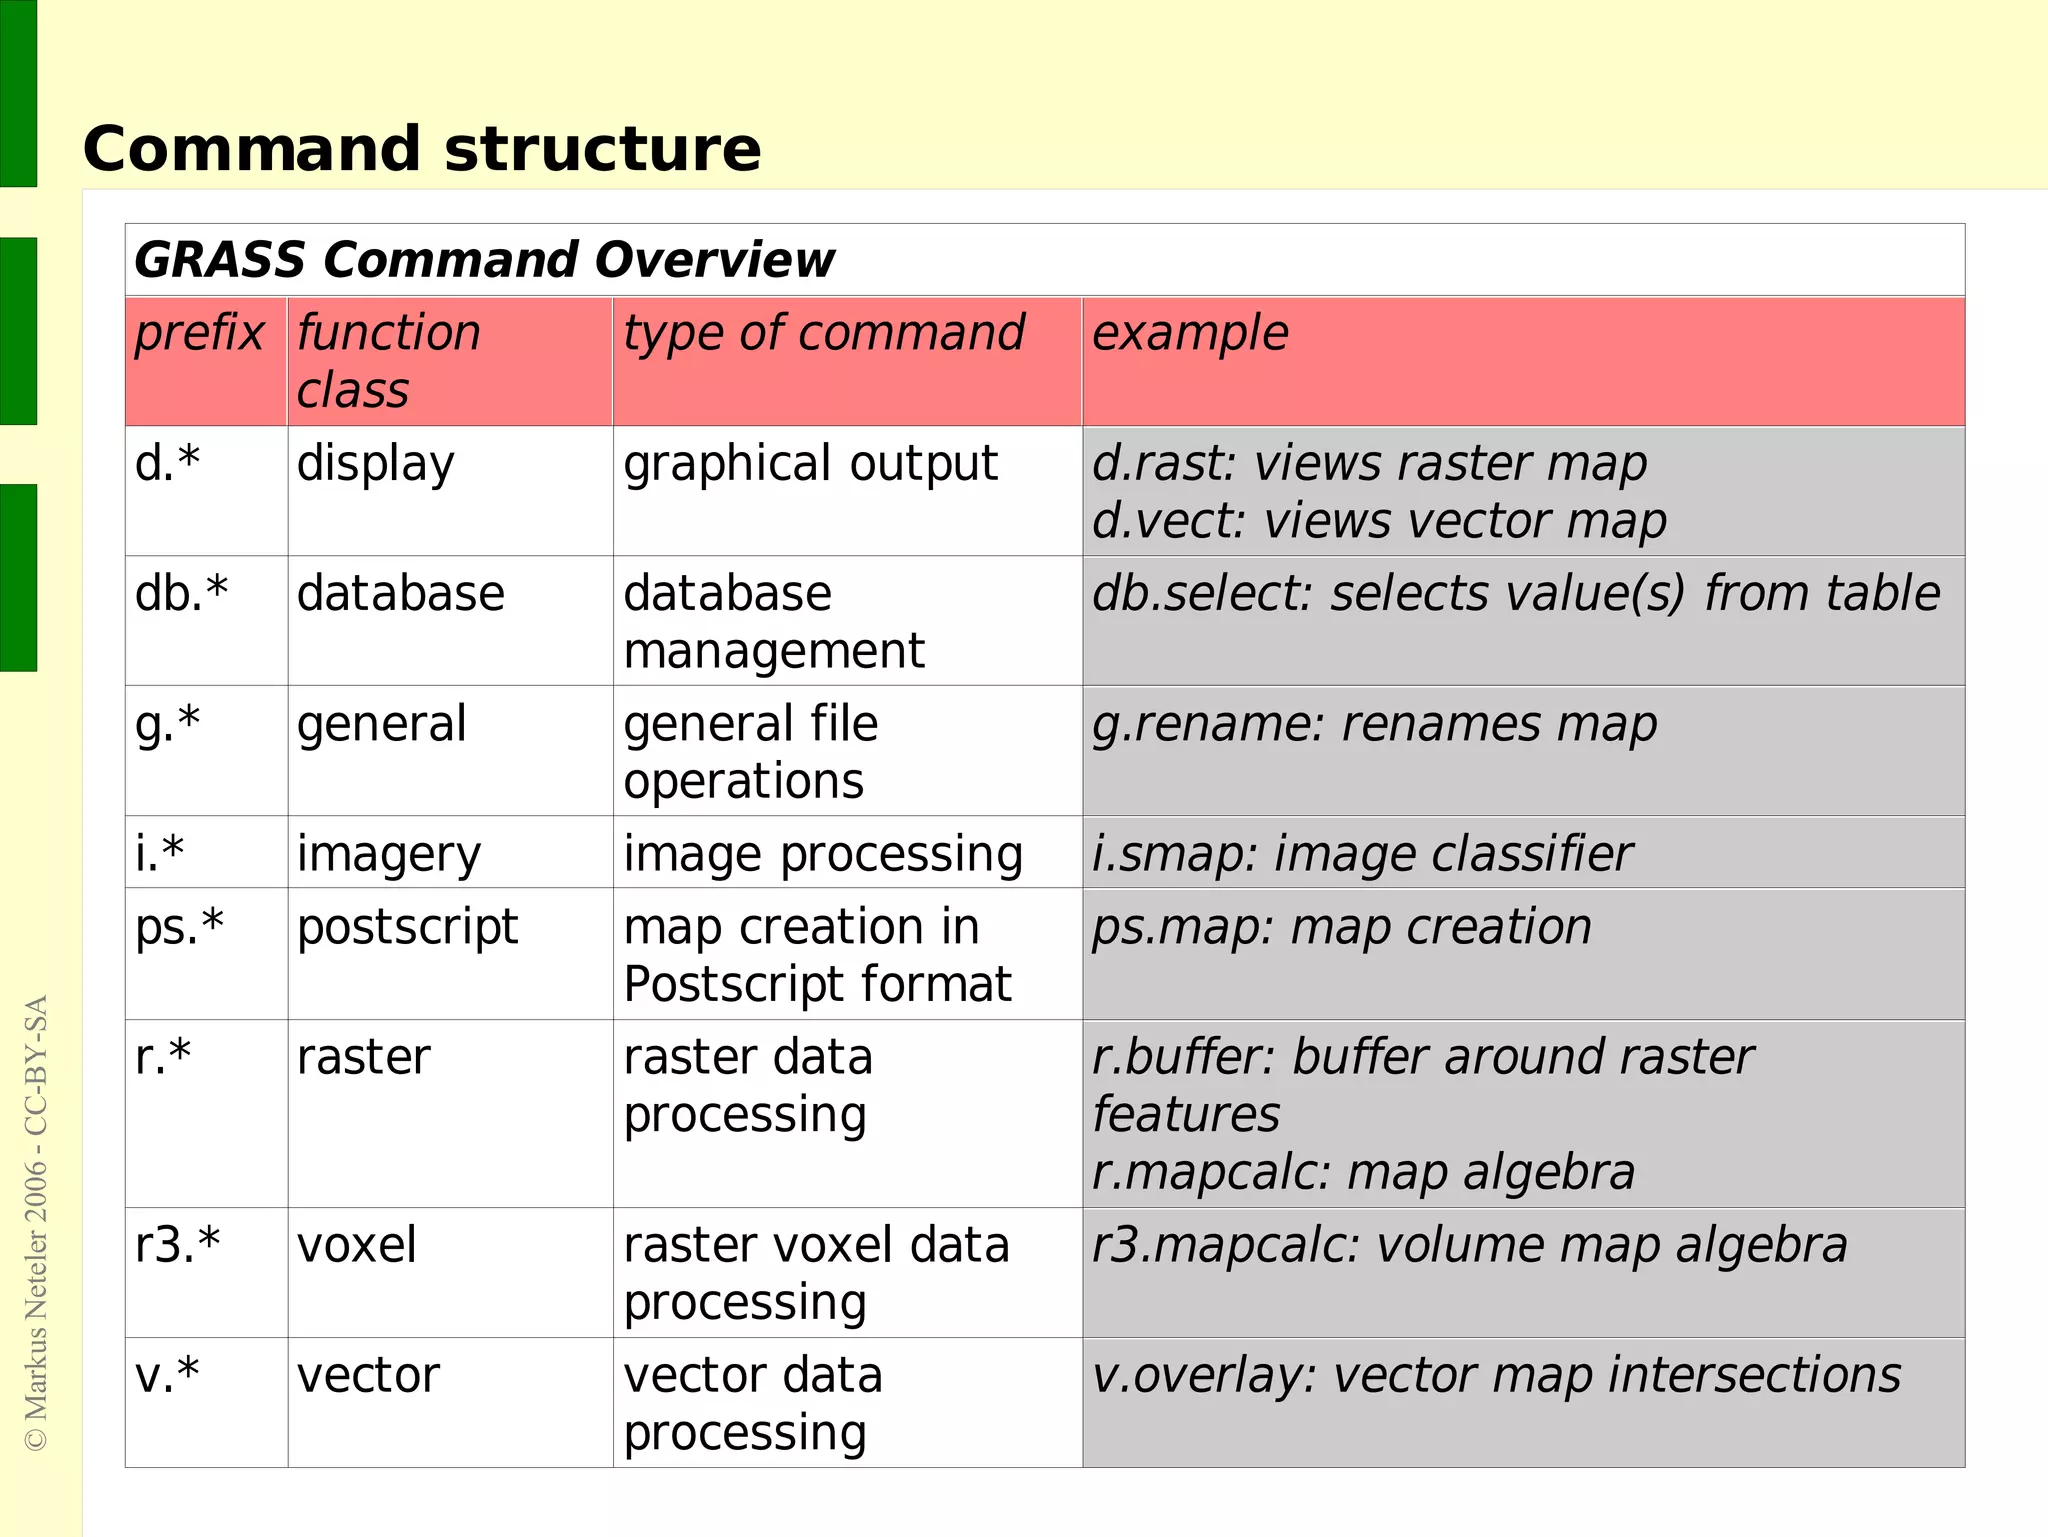
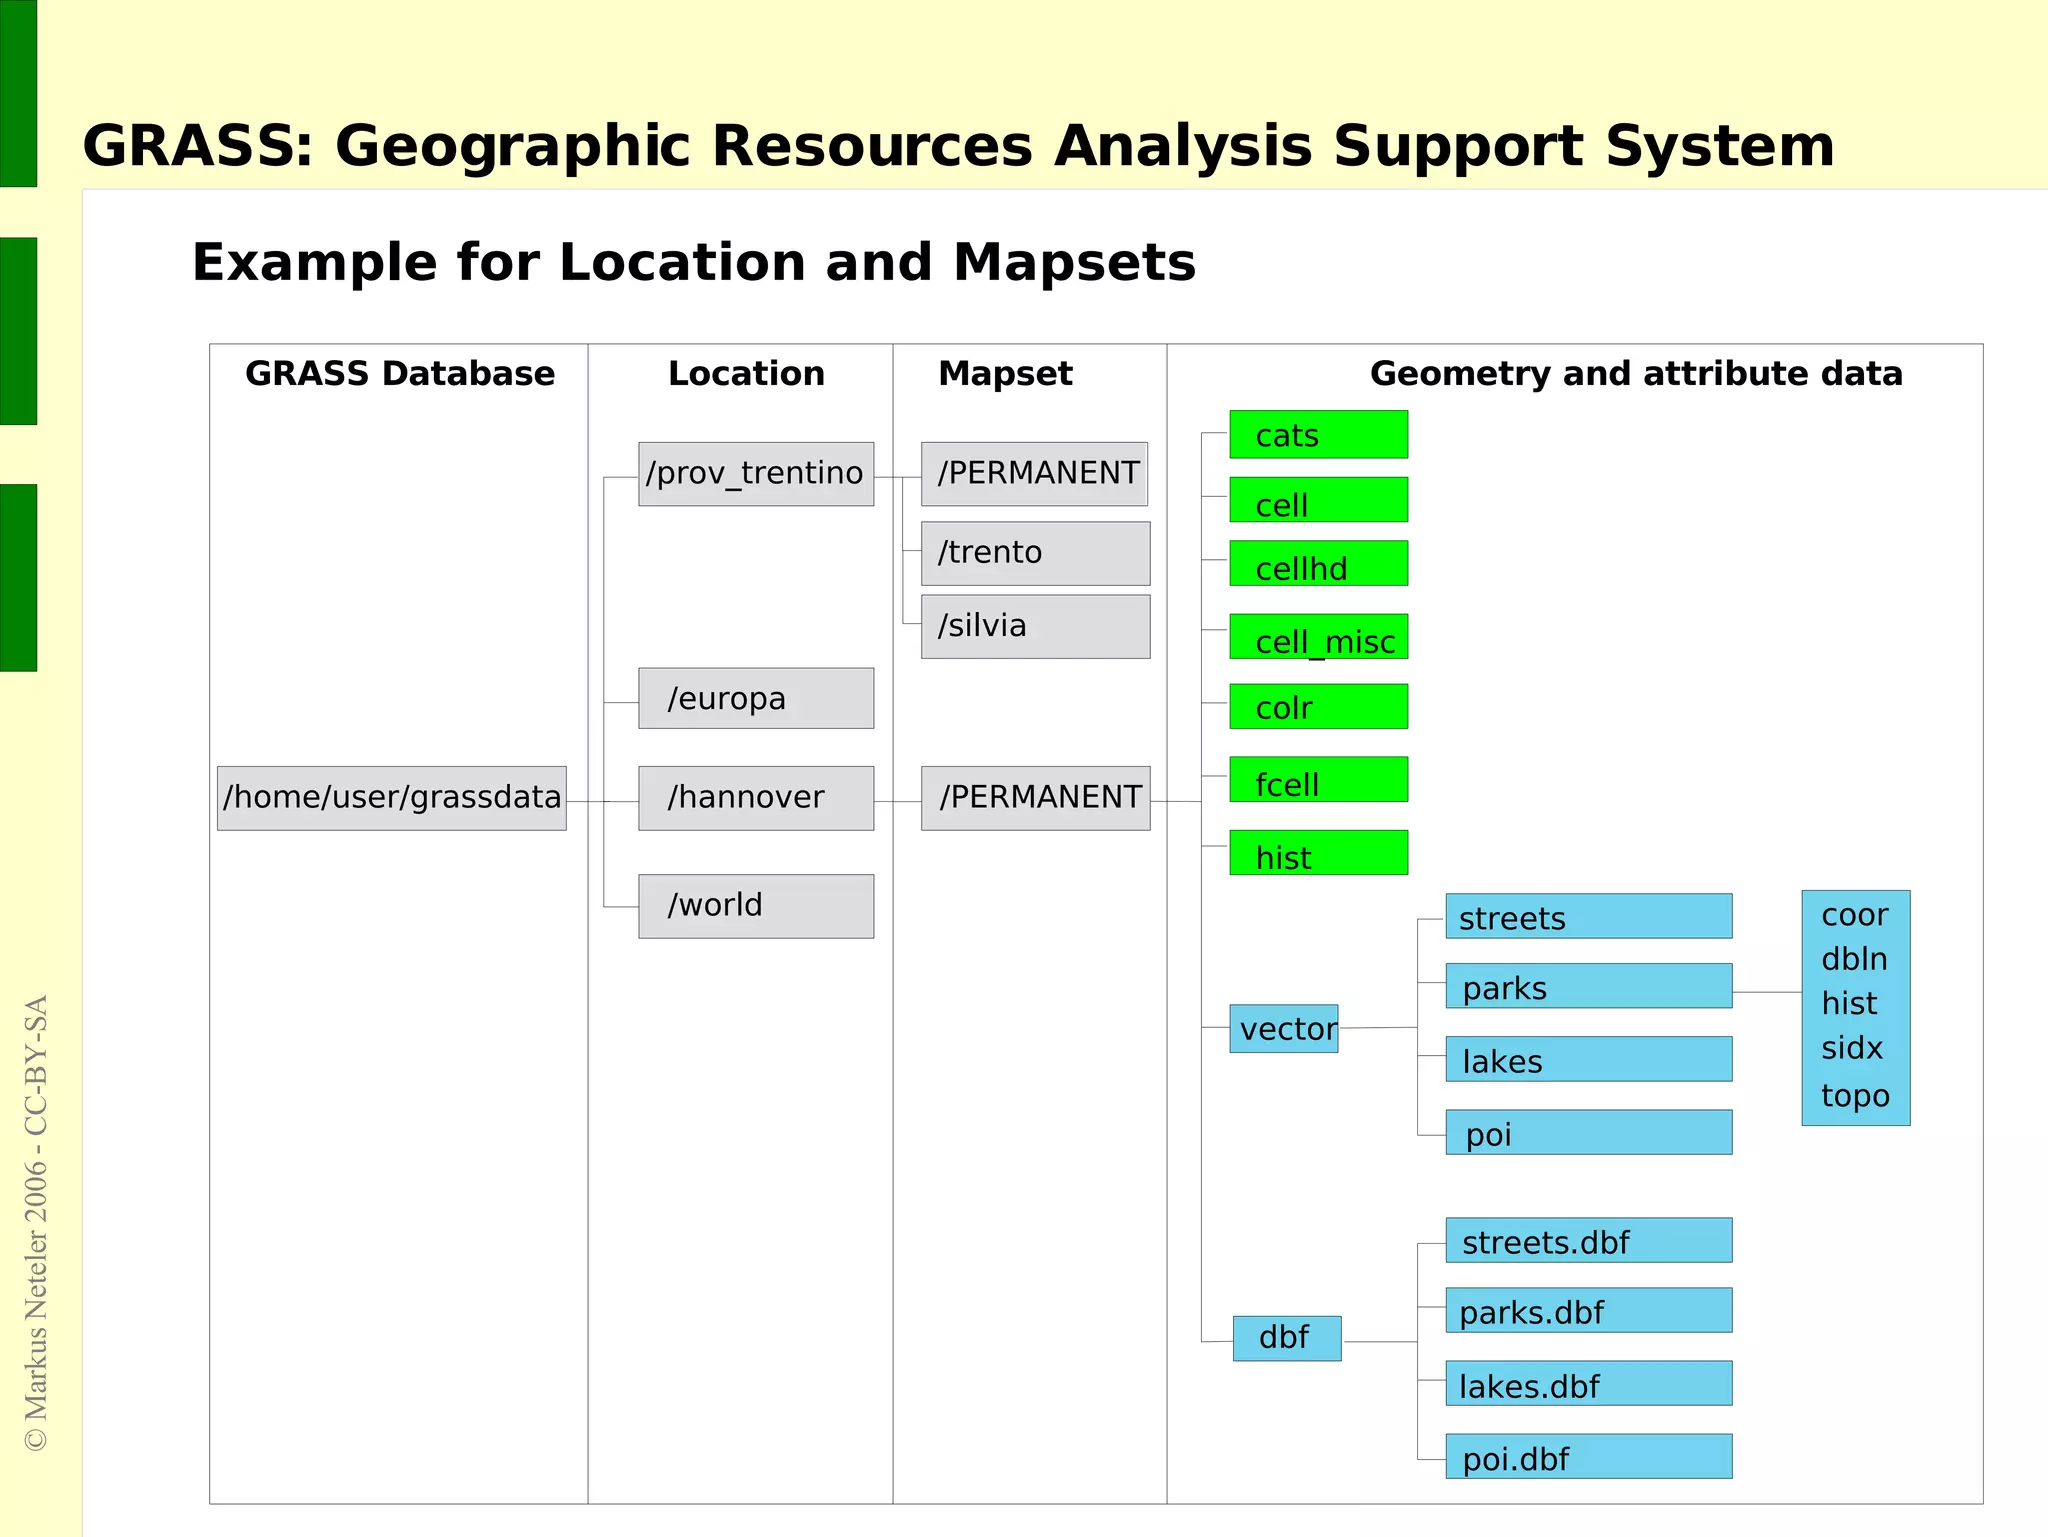
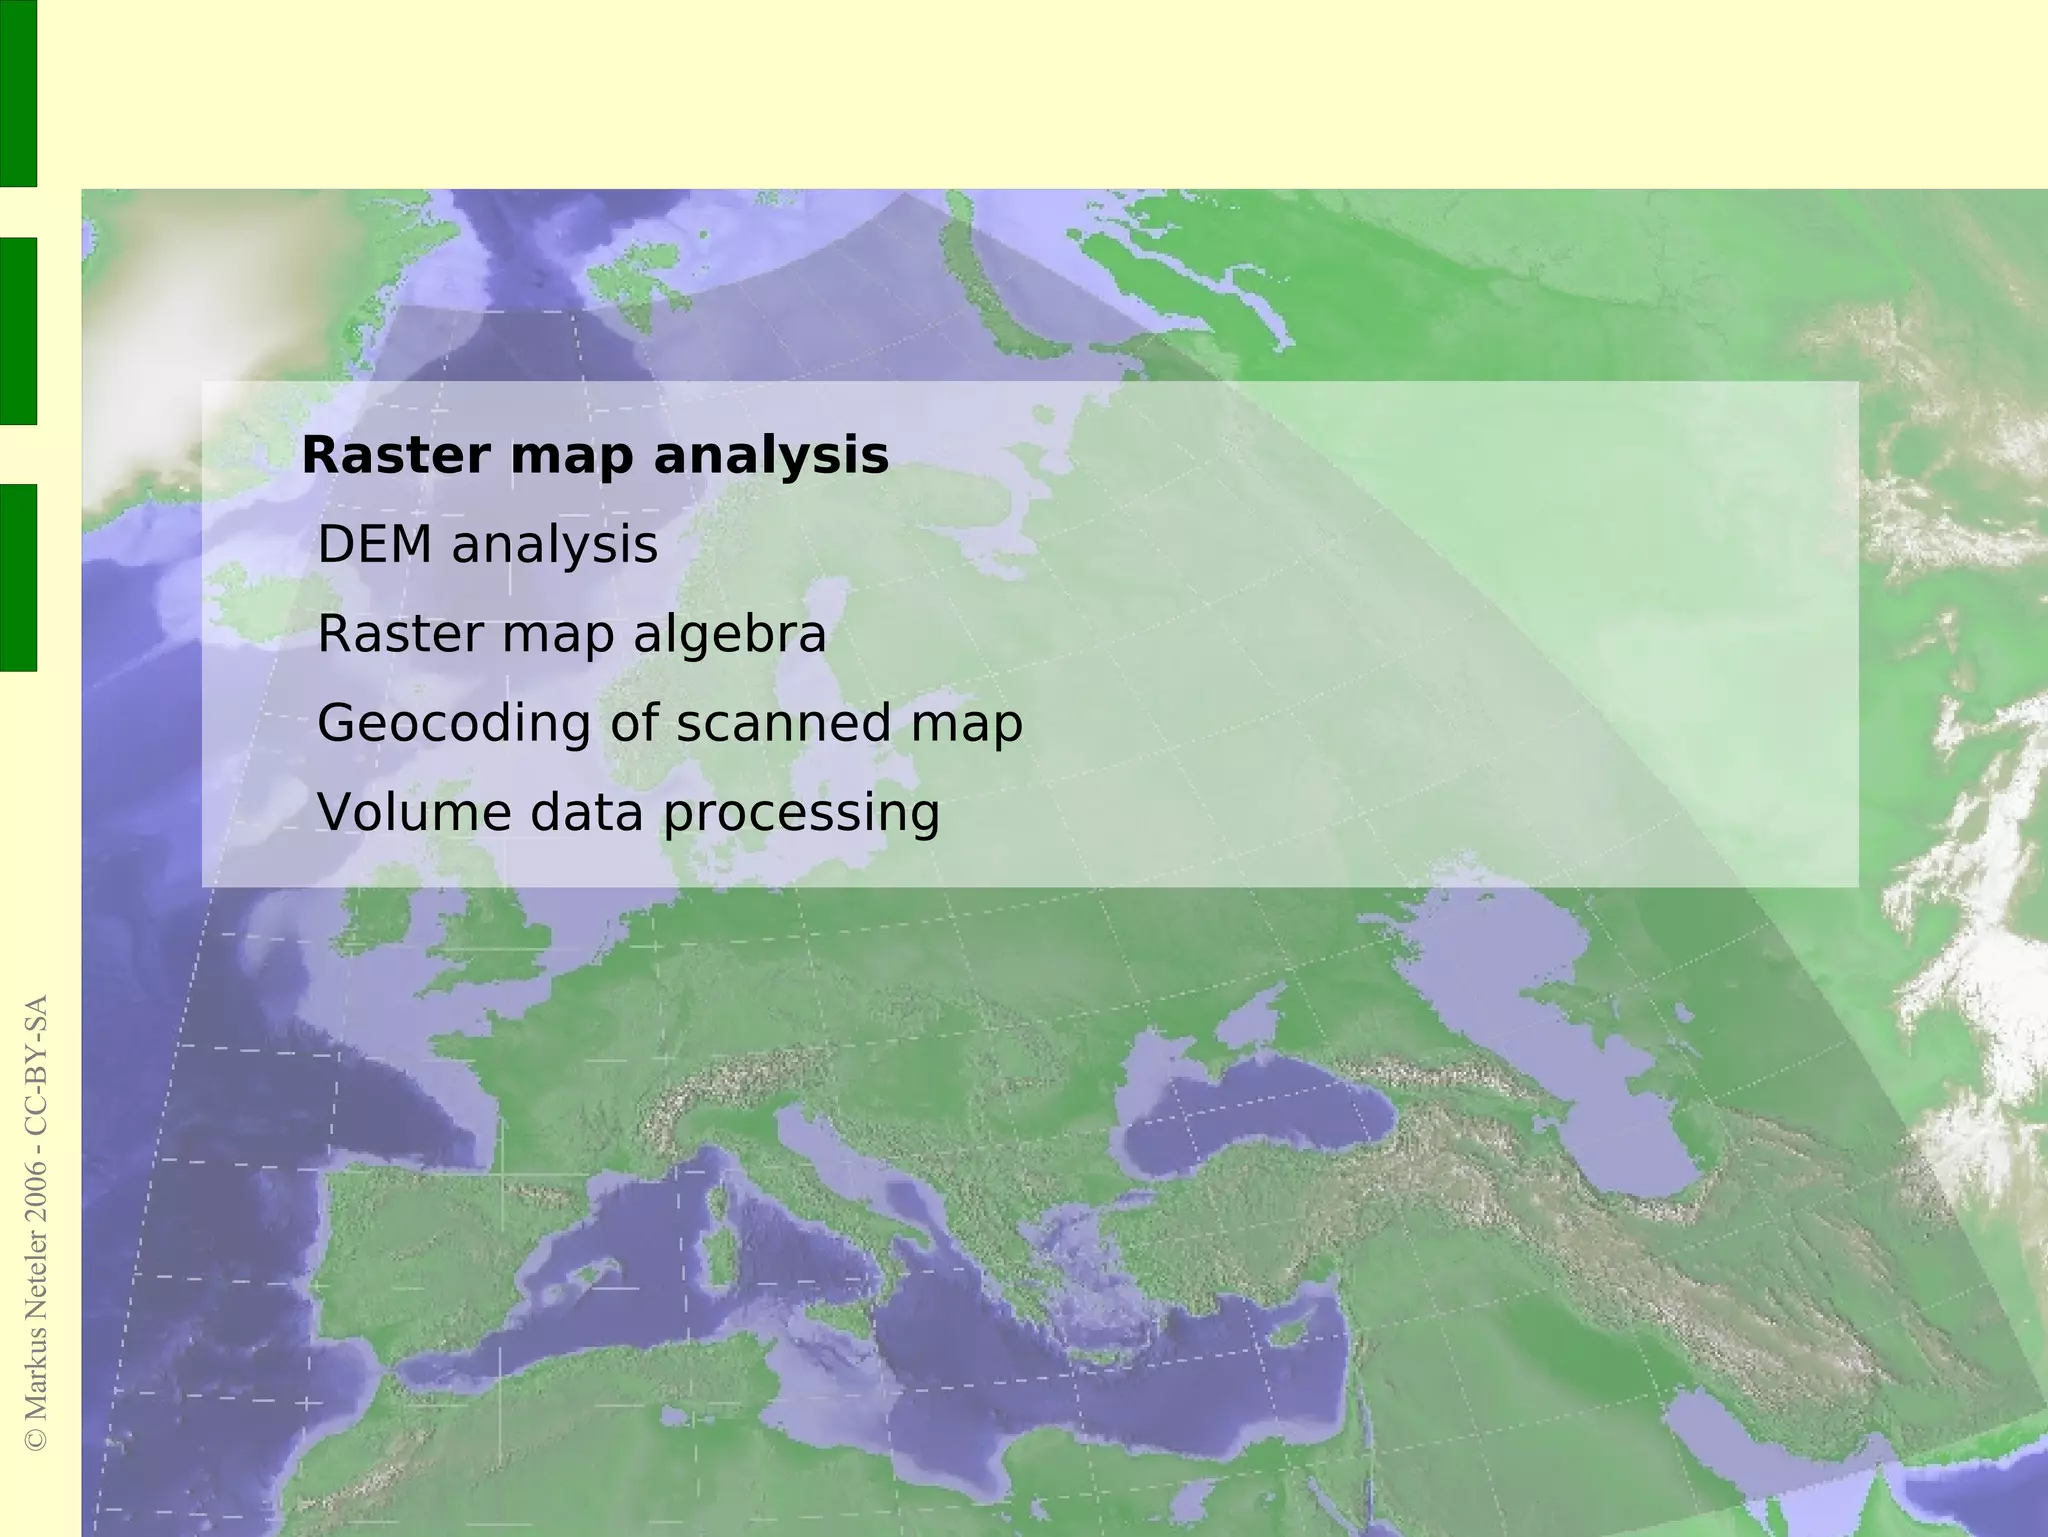
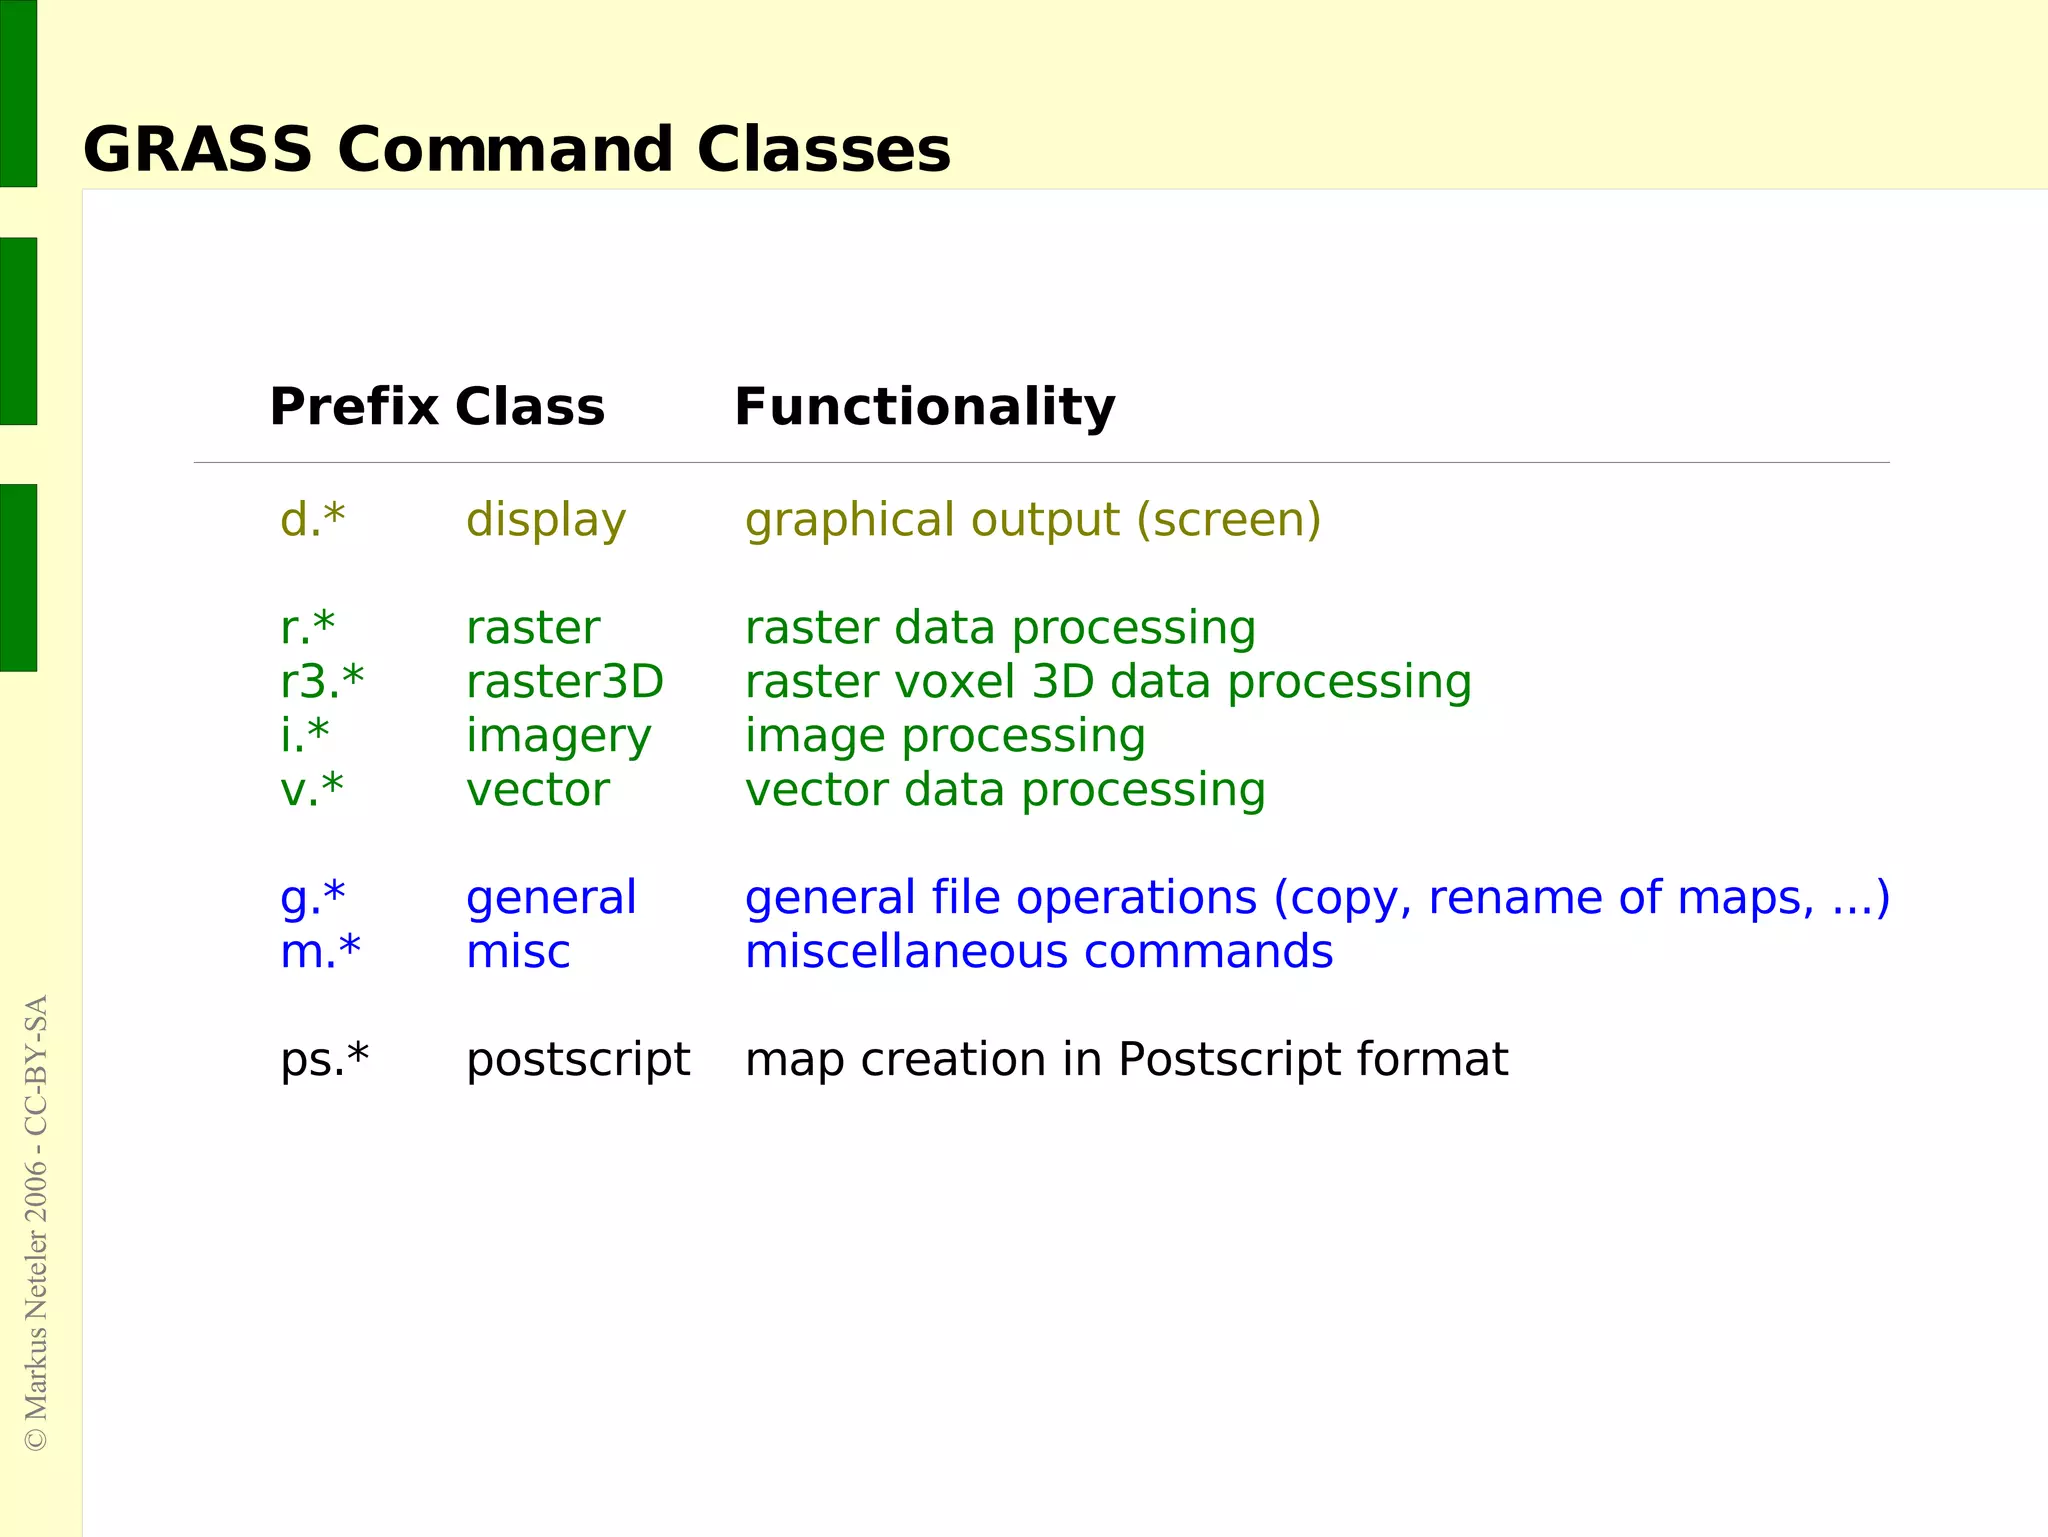
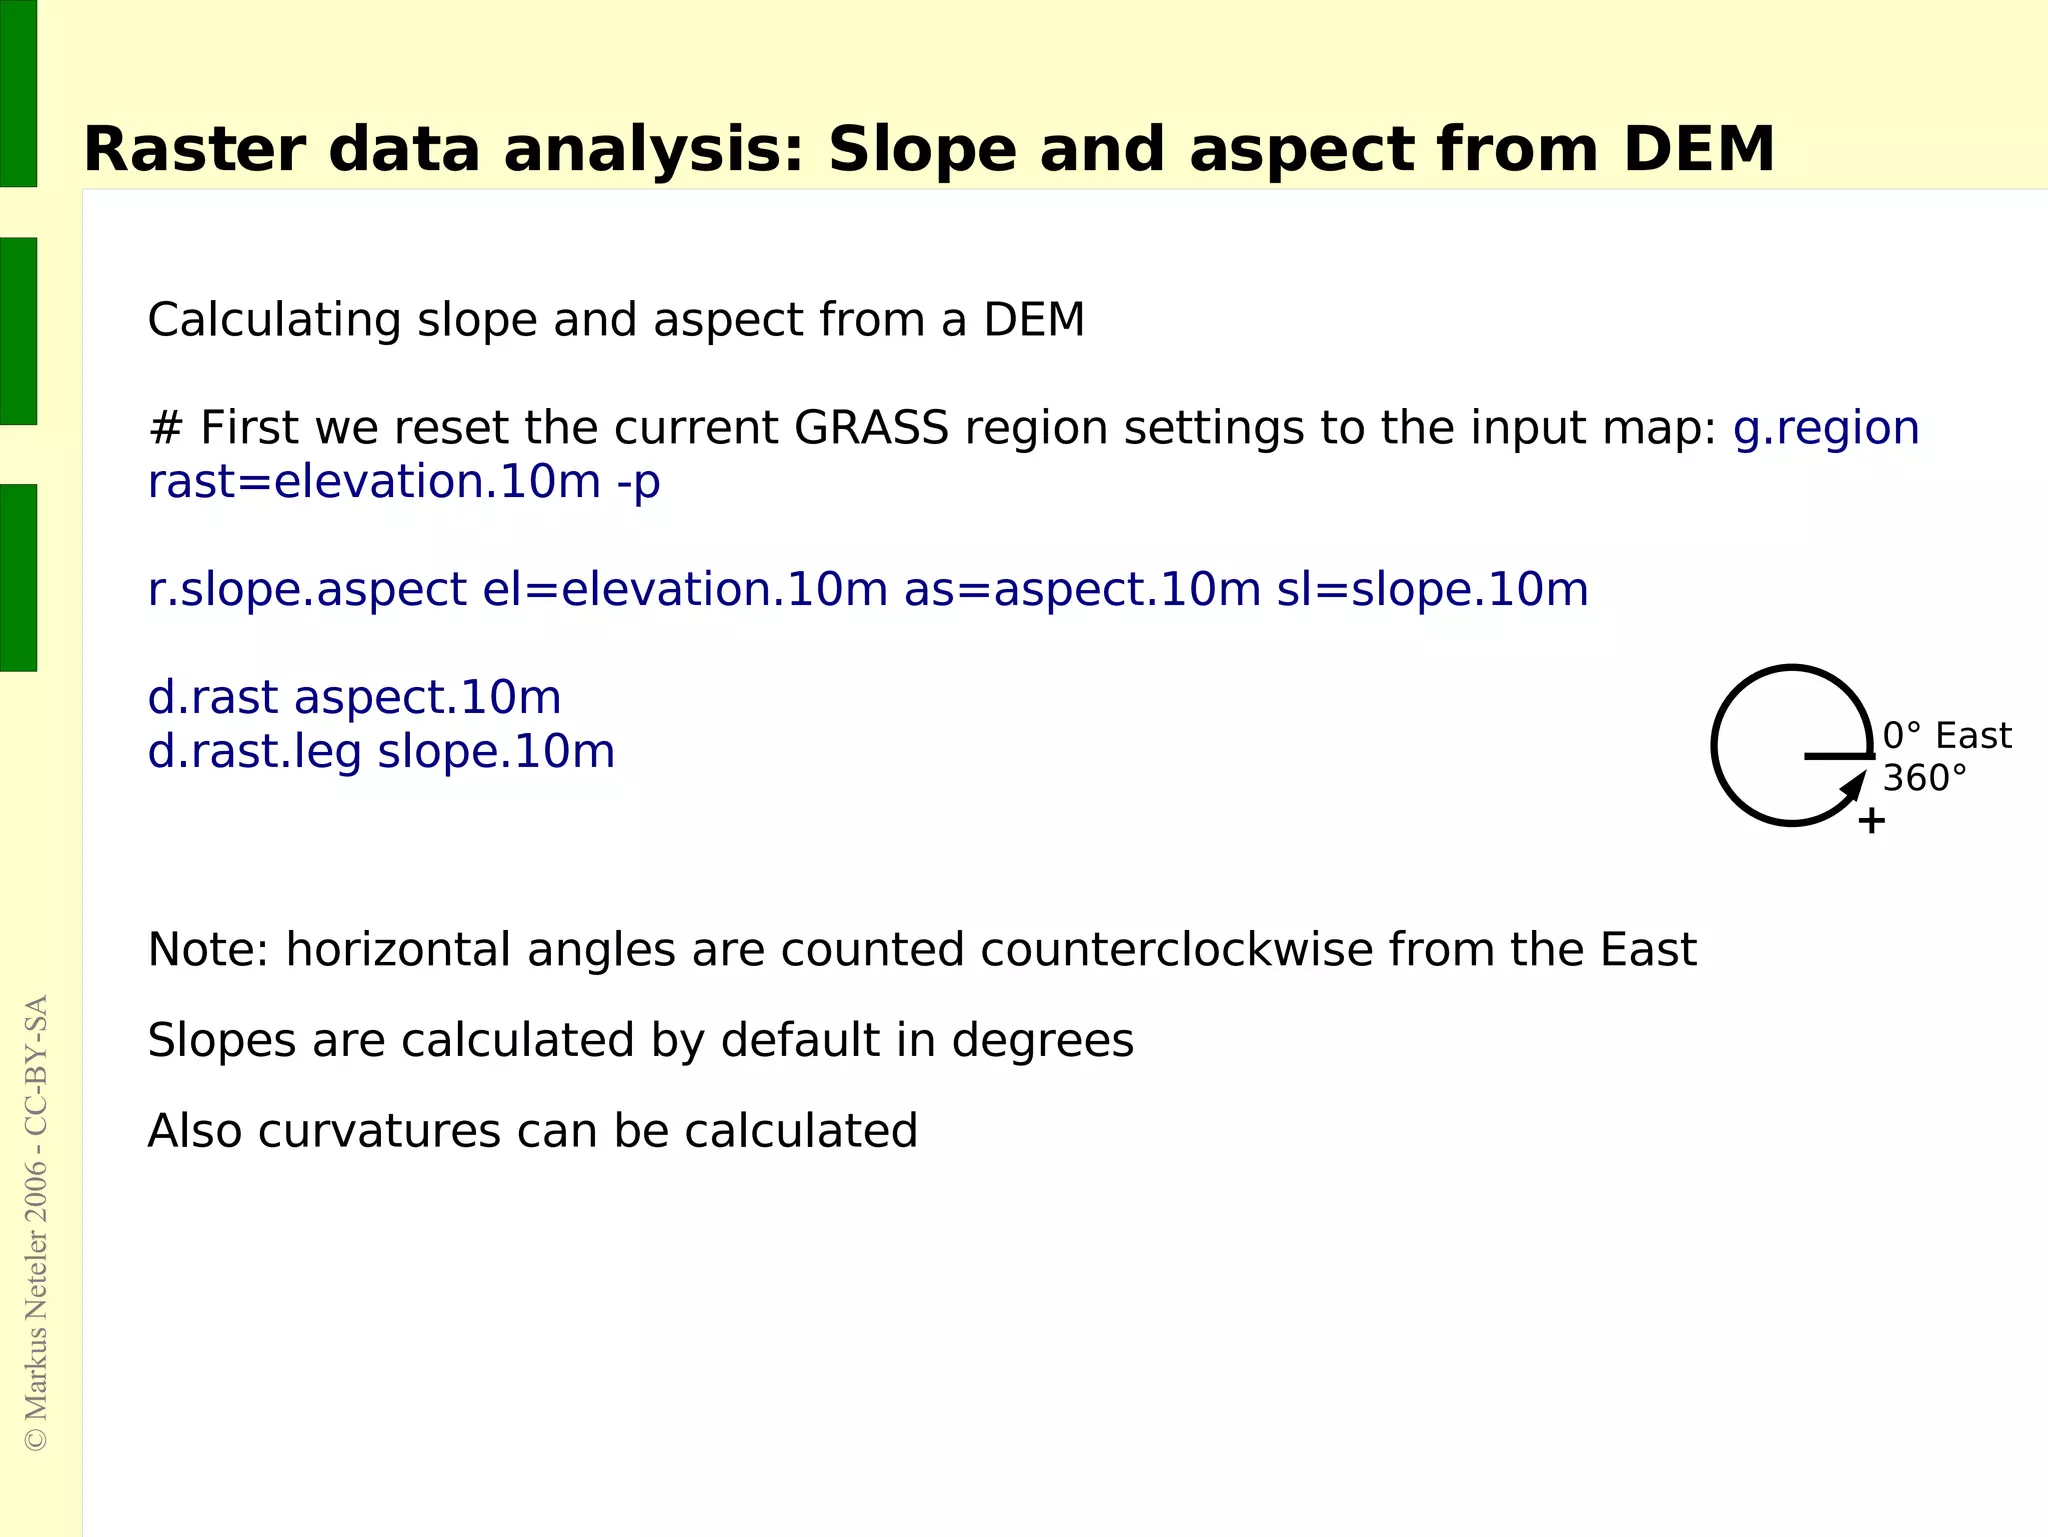
The document provides an extensive overview of the GRASS GIS software, detailing its development, functionalities, and application within geographical data analysis. It covers the software's capabilities, including raster and vector data management, programming support, and interoperability with other systems, alongside practical examples and usage instructions. Additionally, it discusses data import/export processes, project organization, and various analytical methods available in GRASS GIS.