Download as ODP, PPTX


Grass GIS 7 is an open-source geographic information system that provides extensive capabilities for raster and vector processing, network analysis, and image processing across multiple platforms. It features a native vector format, integrated database management systems, and advanced functionalities like space-time data handling and image classification tools. Additionally, it supports user-contributed extensions and offers resources for getting started, including free sample data and extensive documentation.
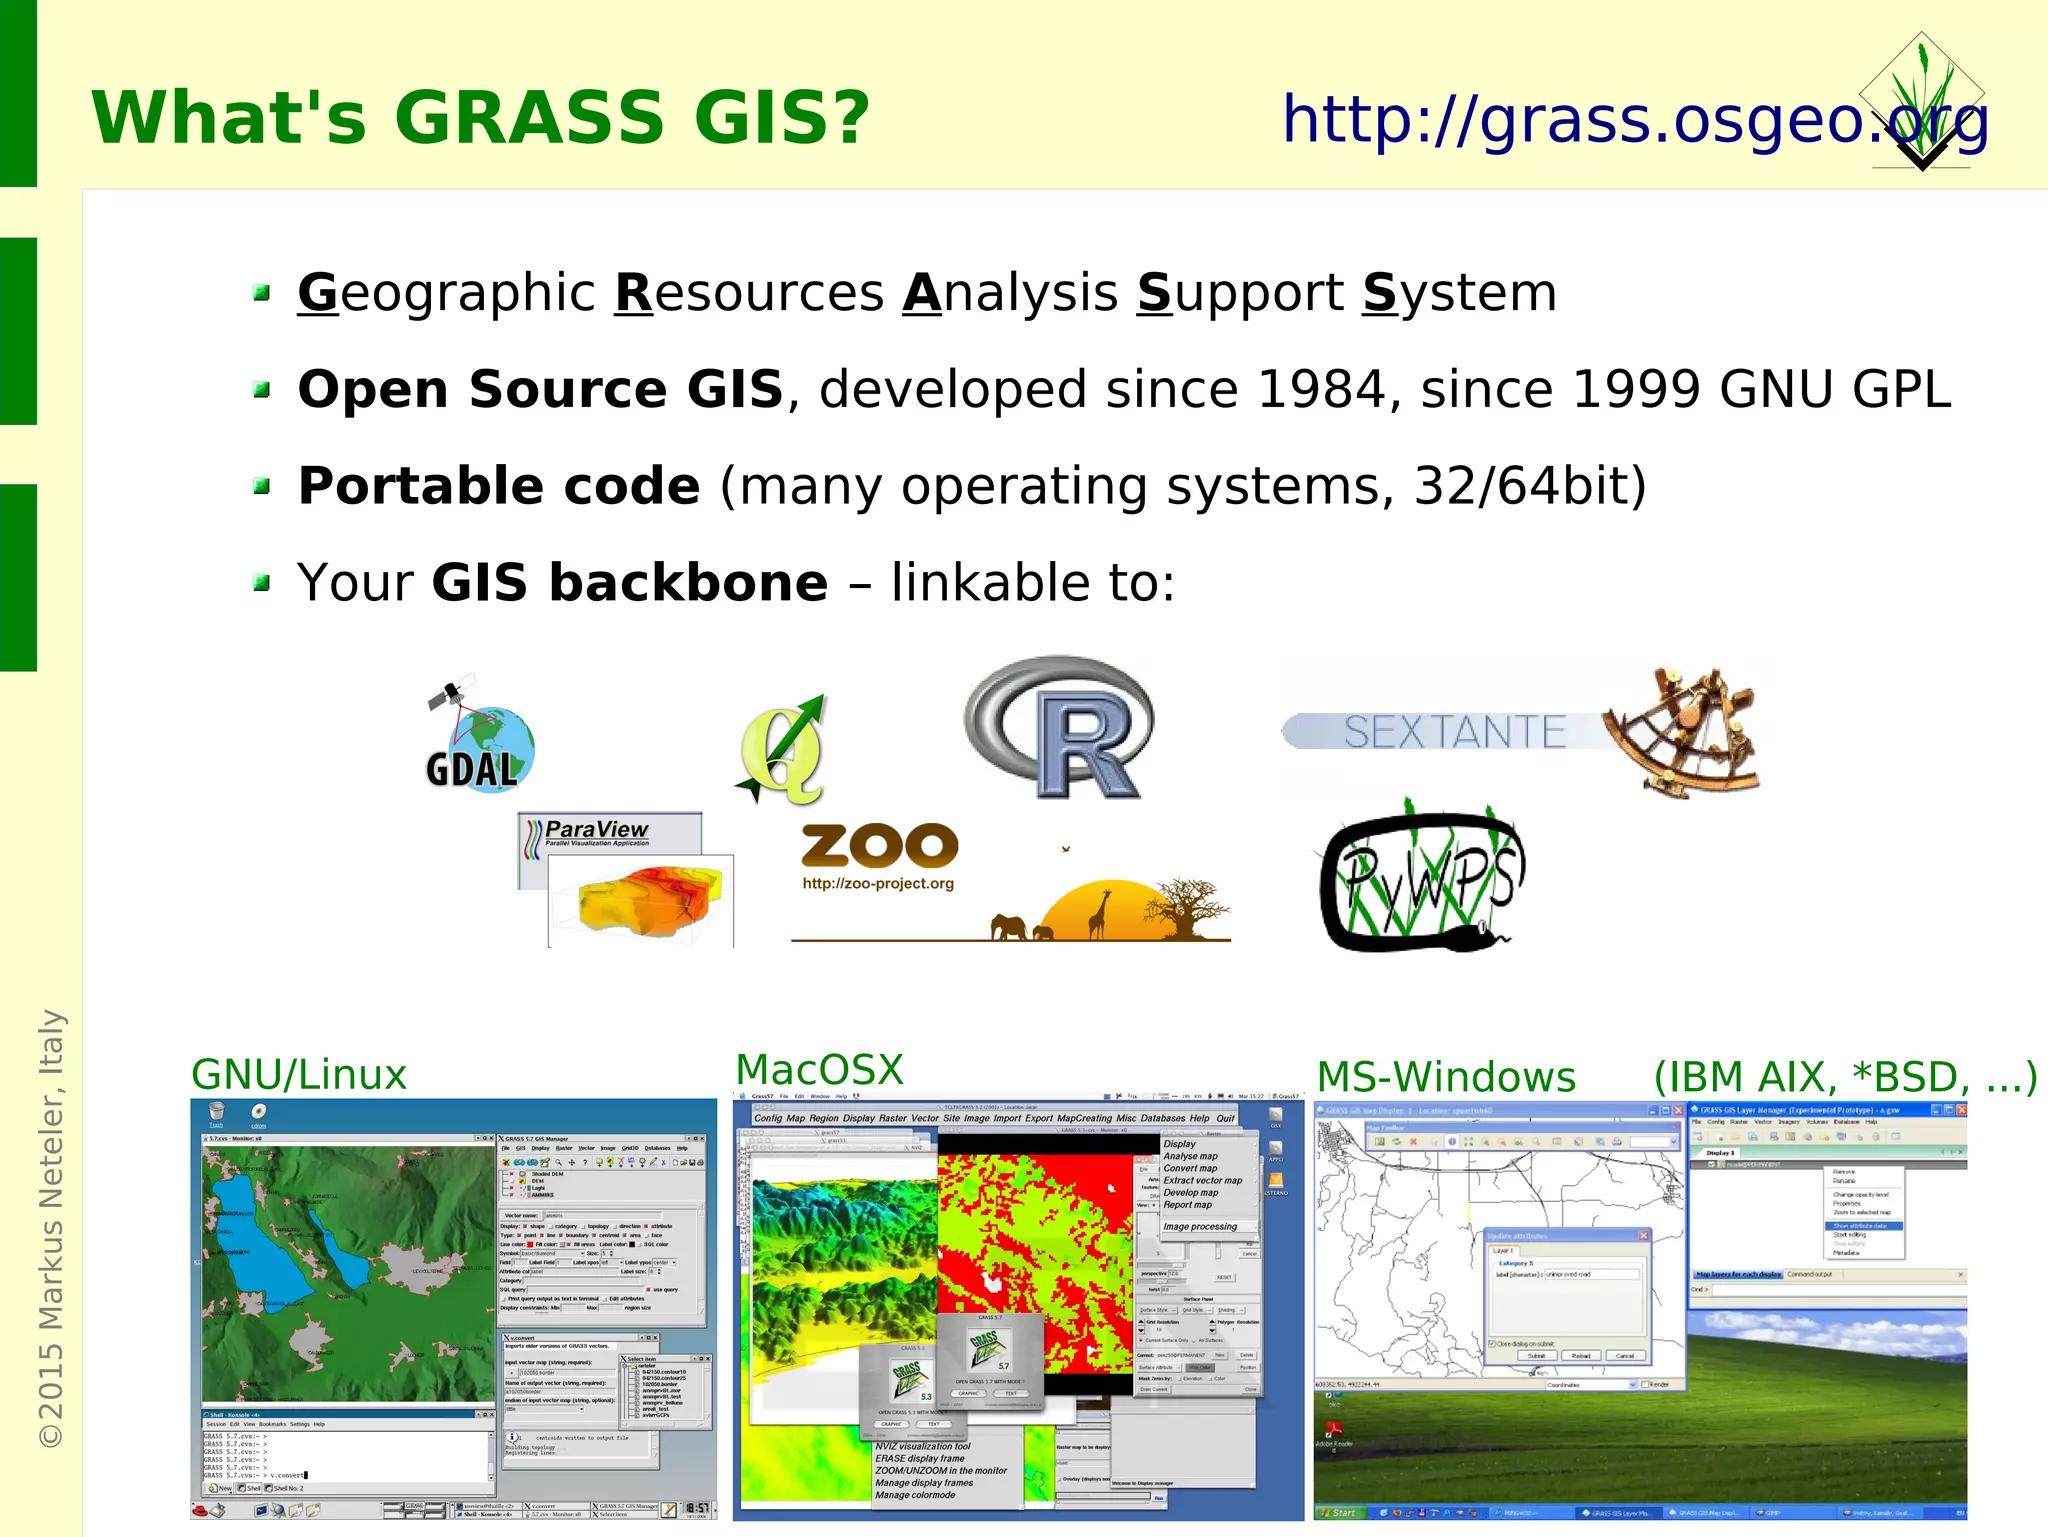
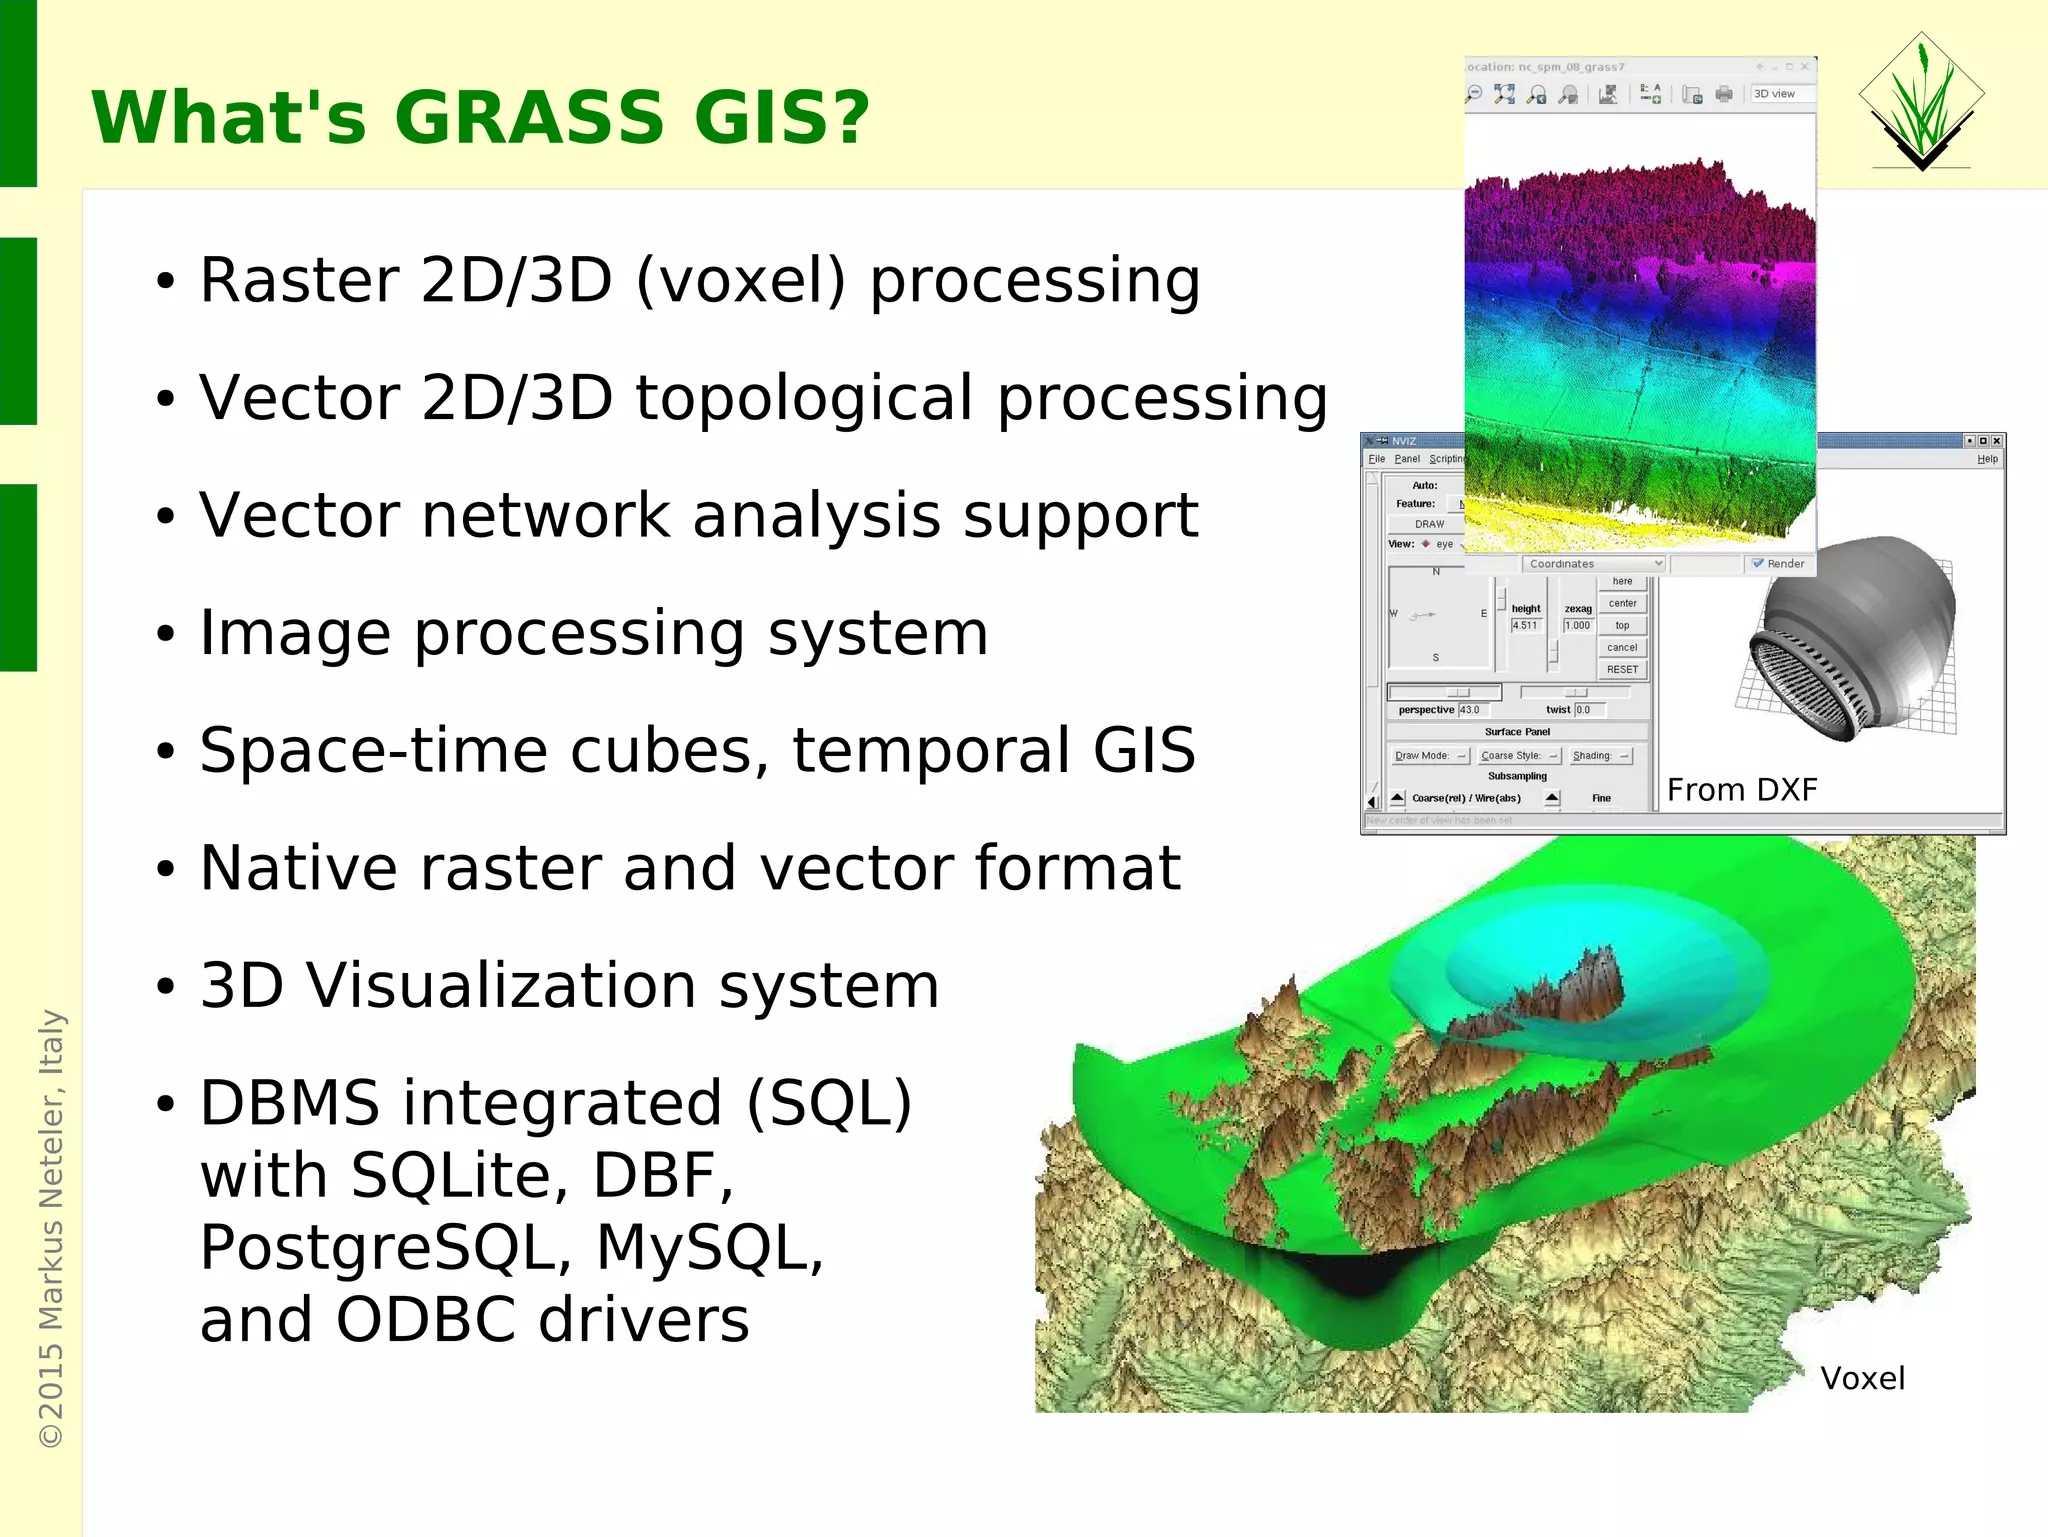
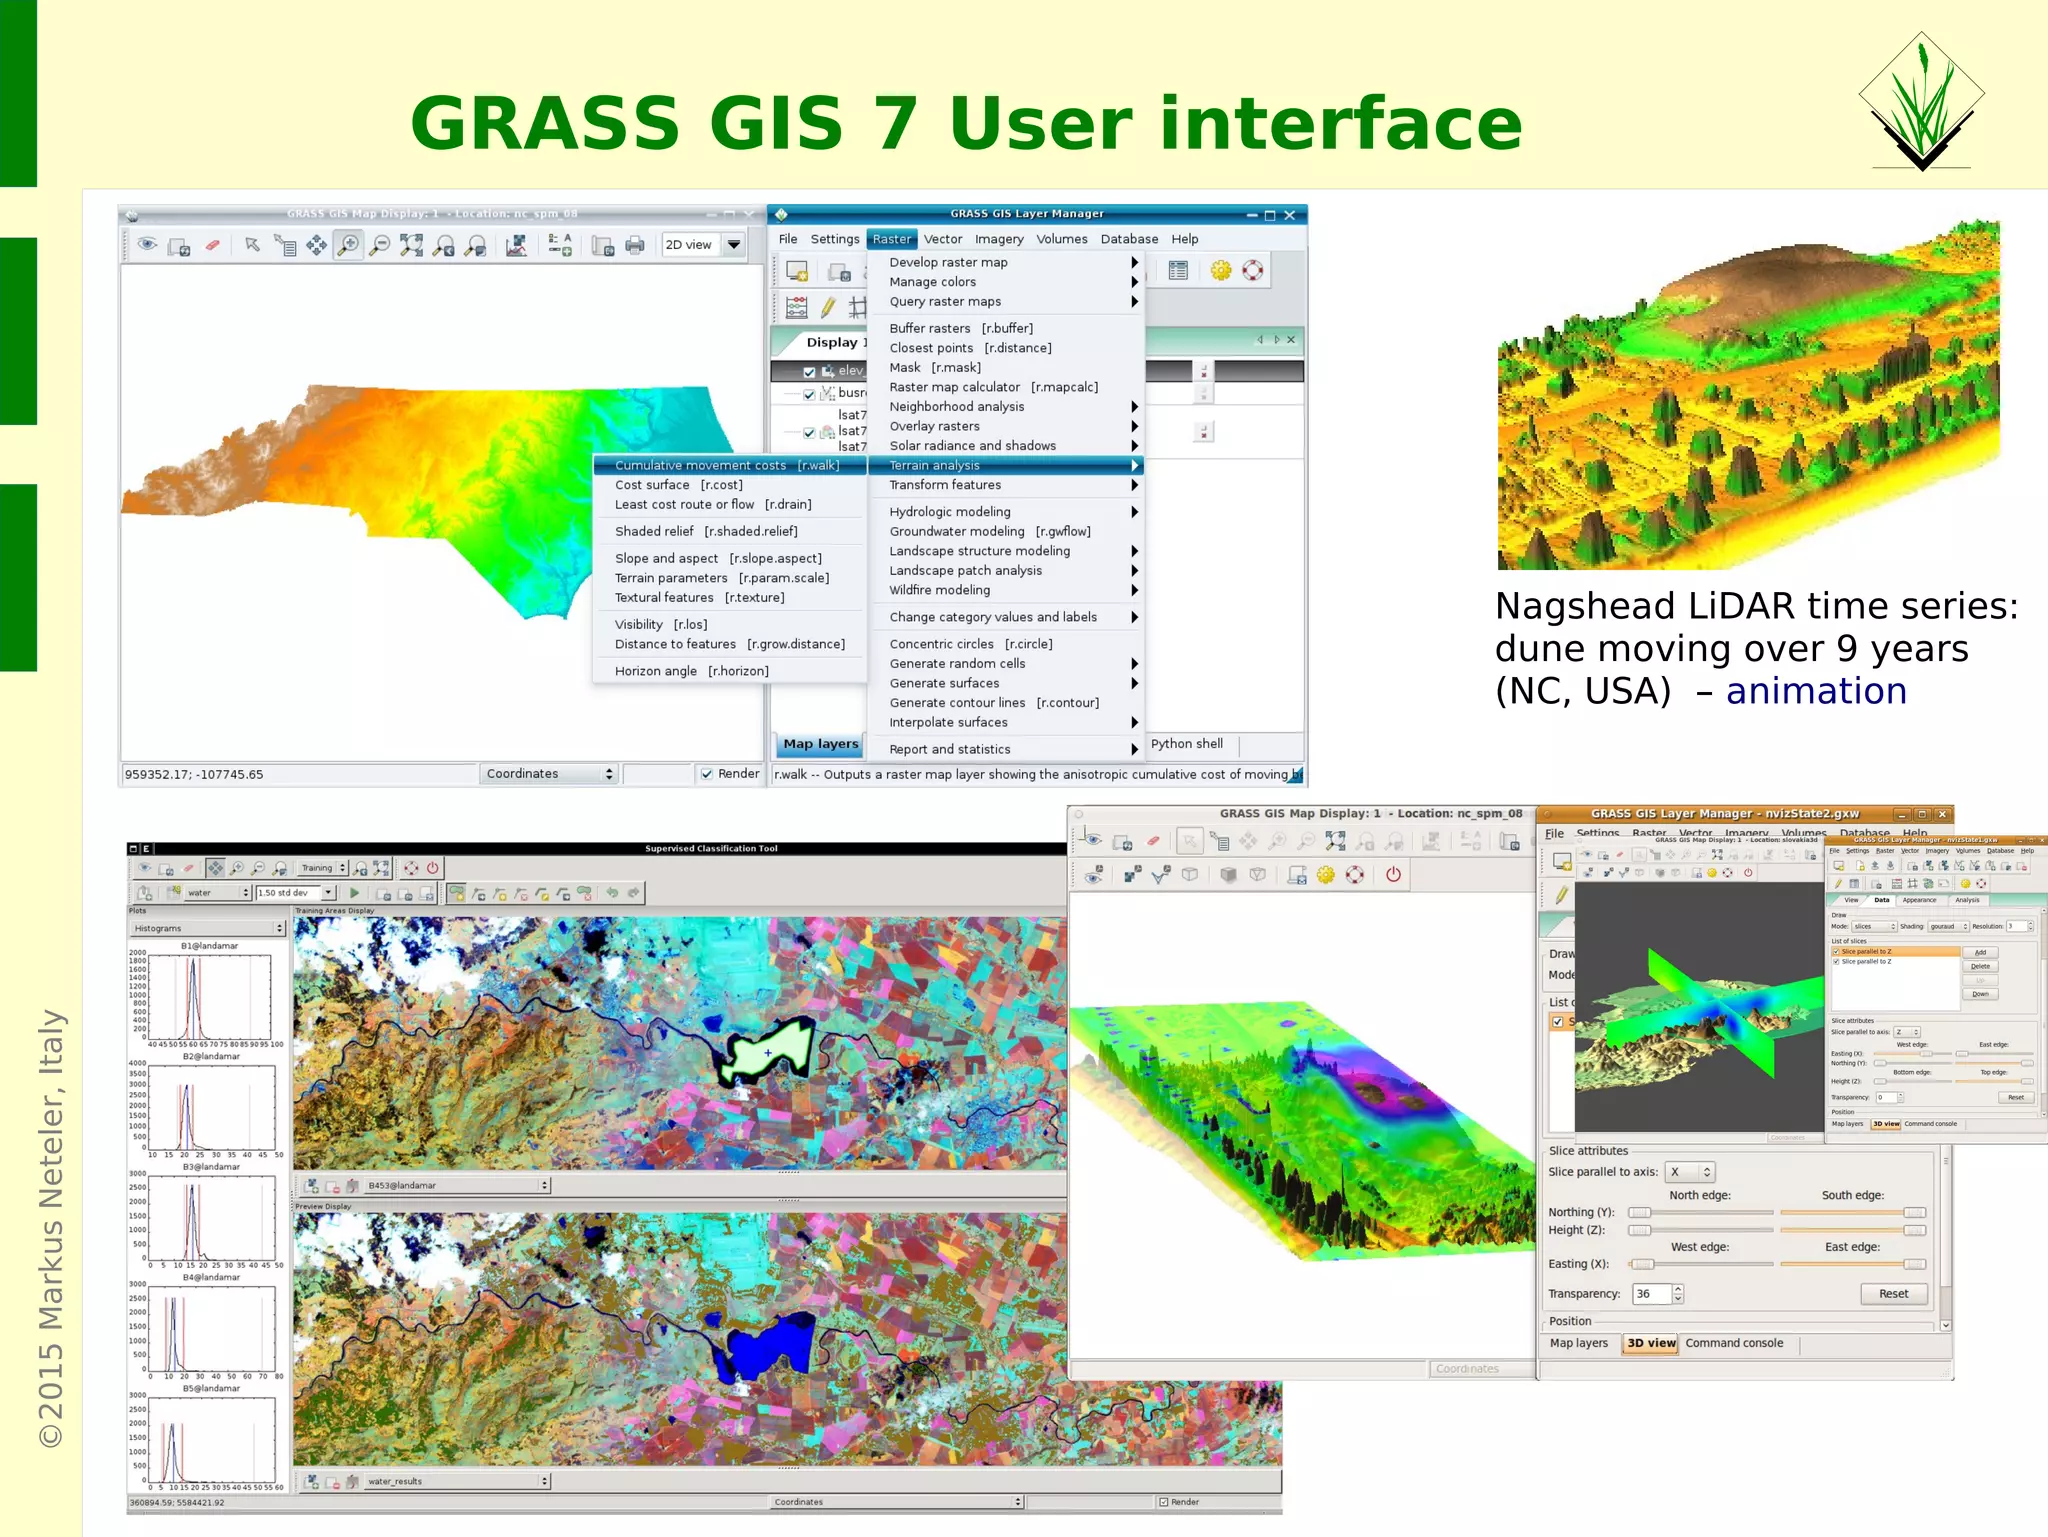
Introduction to GRASS GIS 7, open-source and portable across various OS. Key features include 2D/3D raster and vector processing.
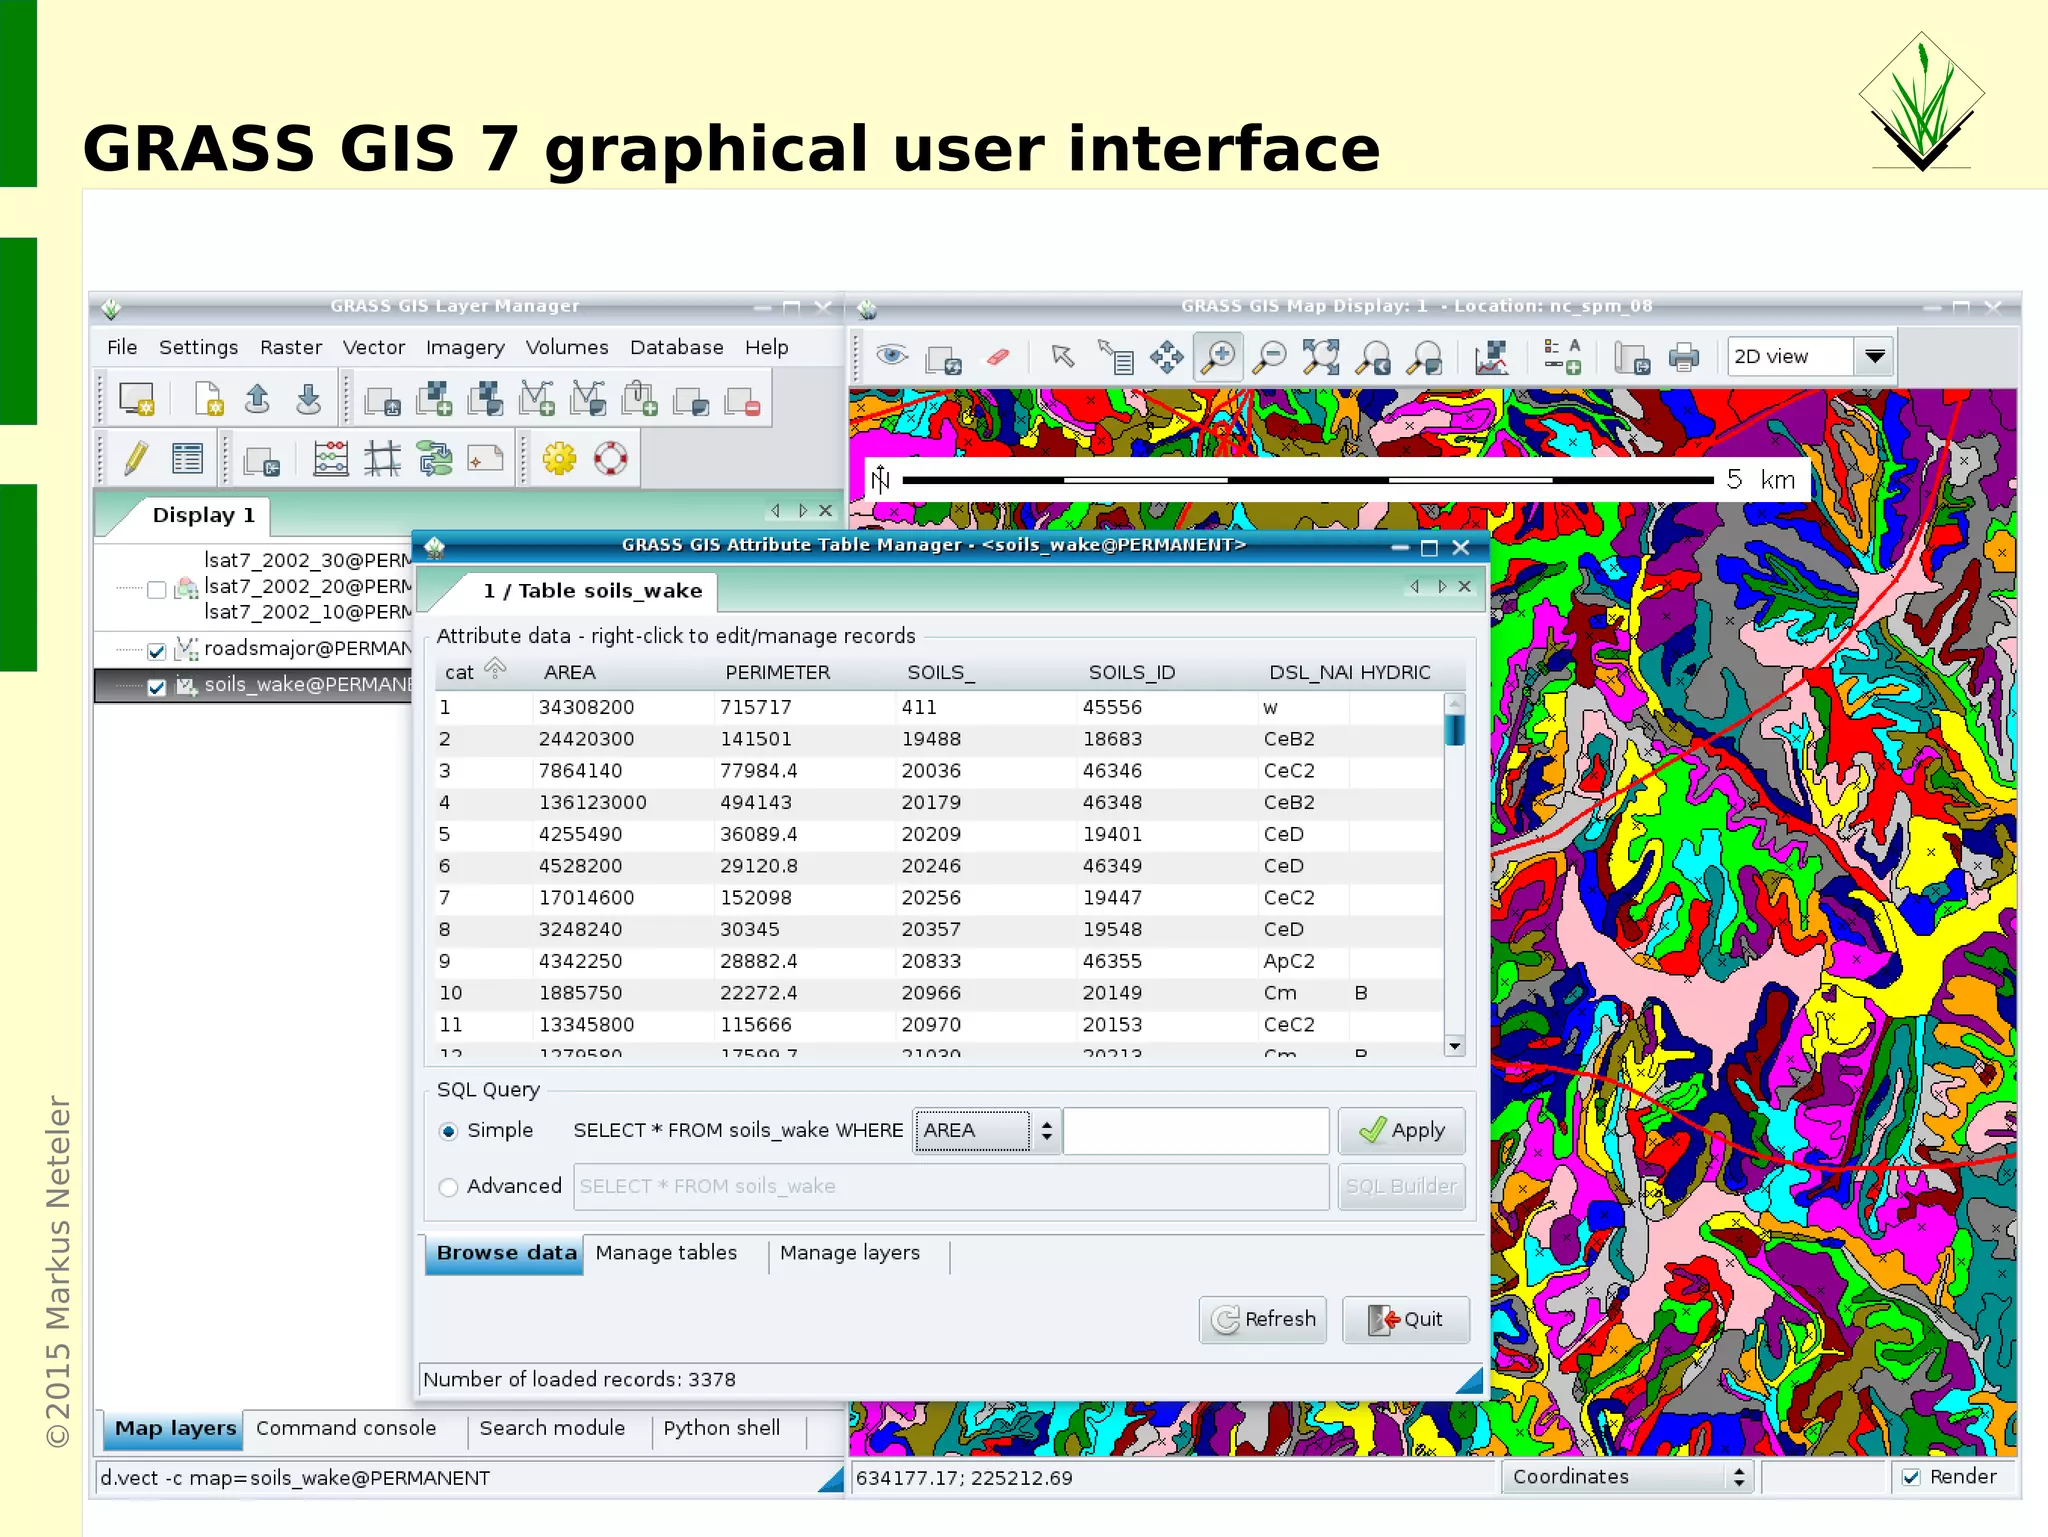
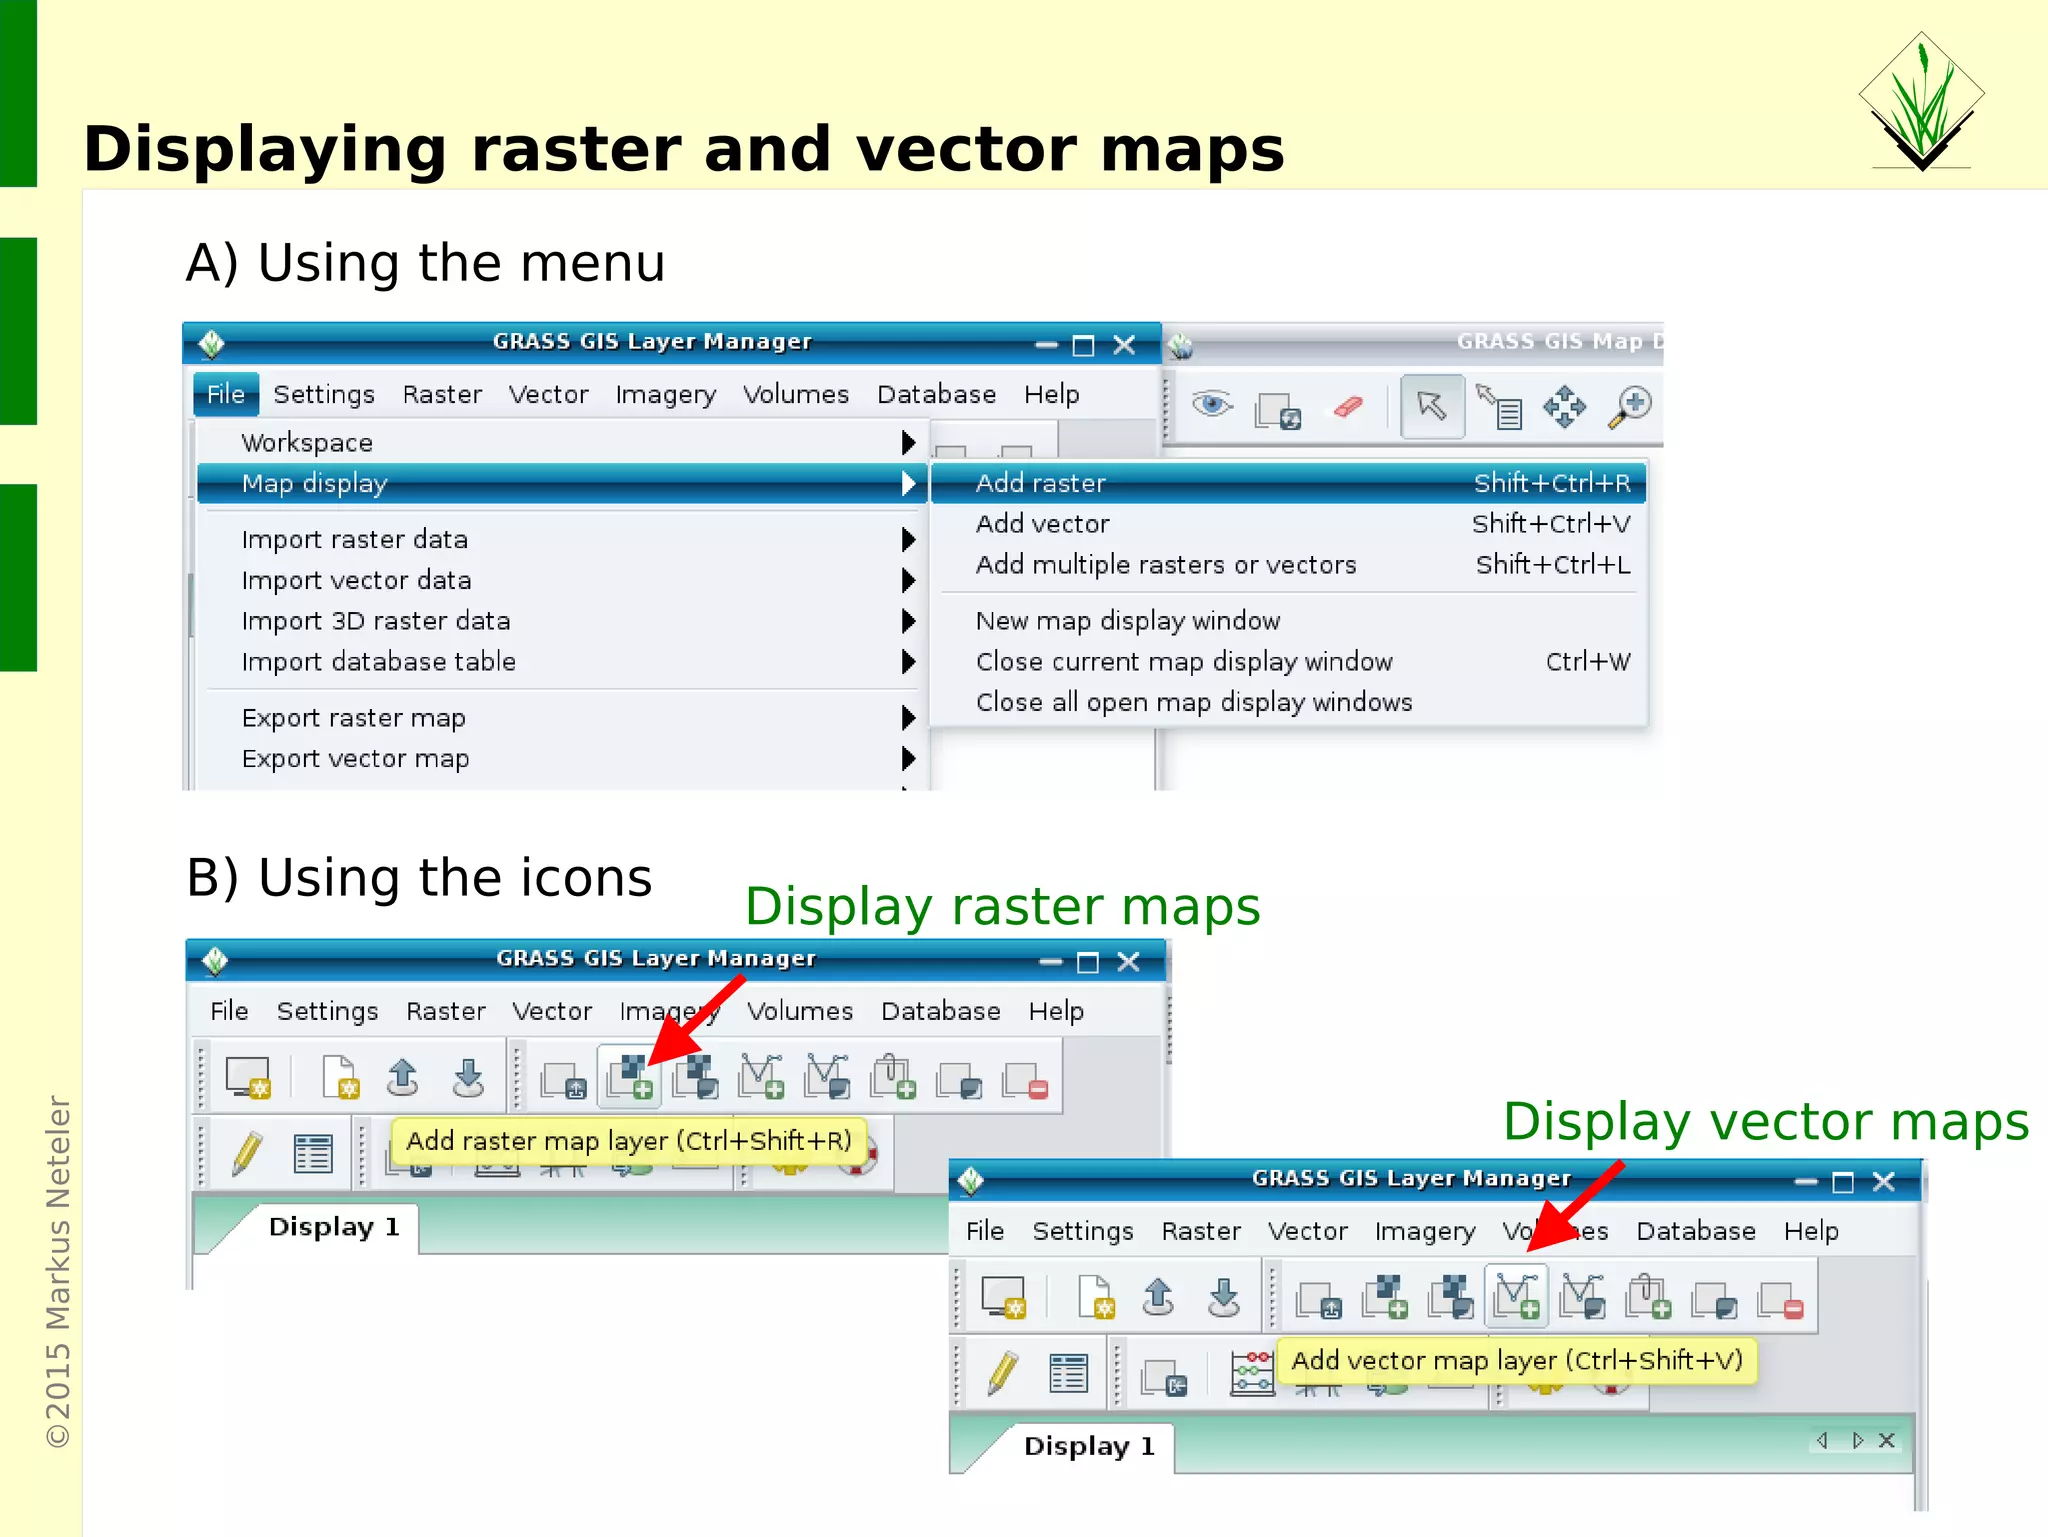
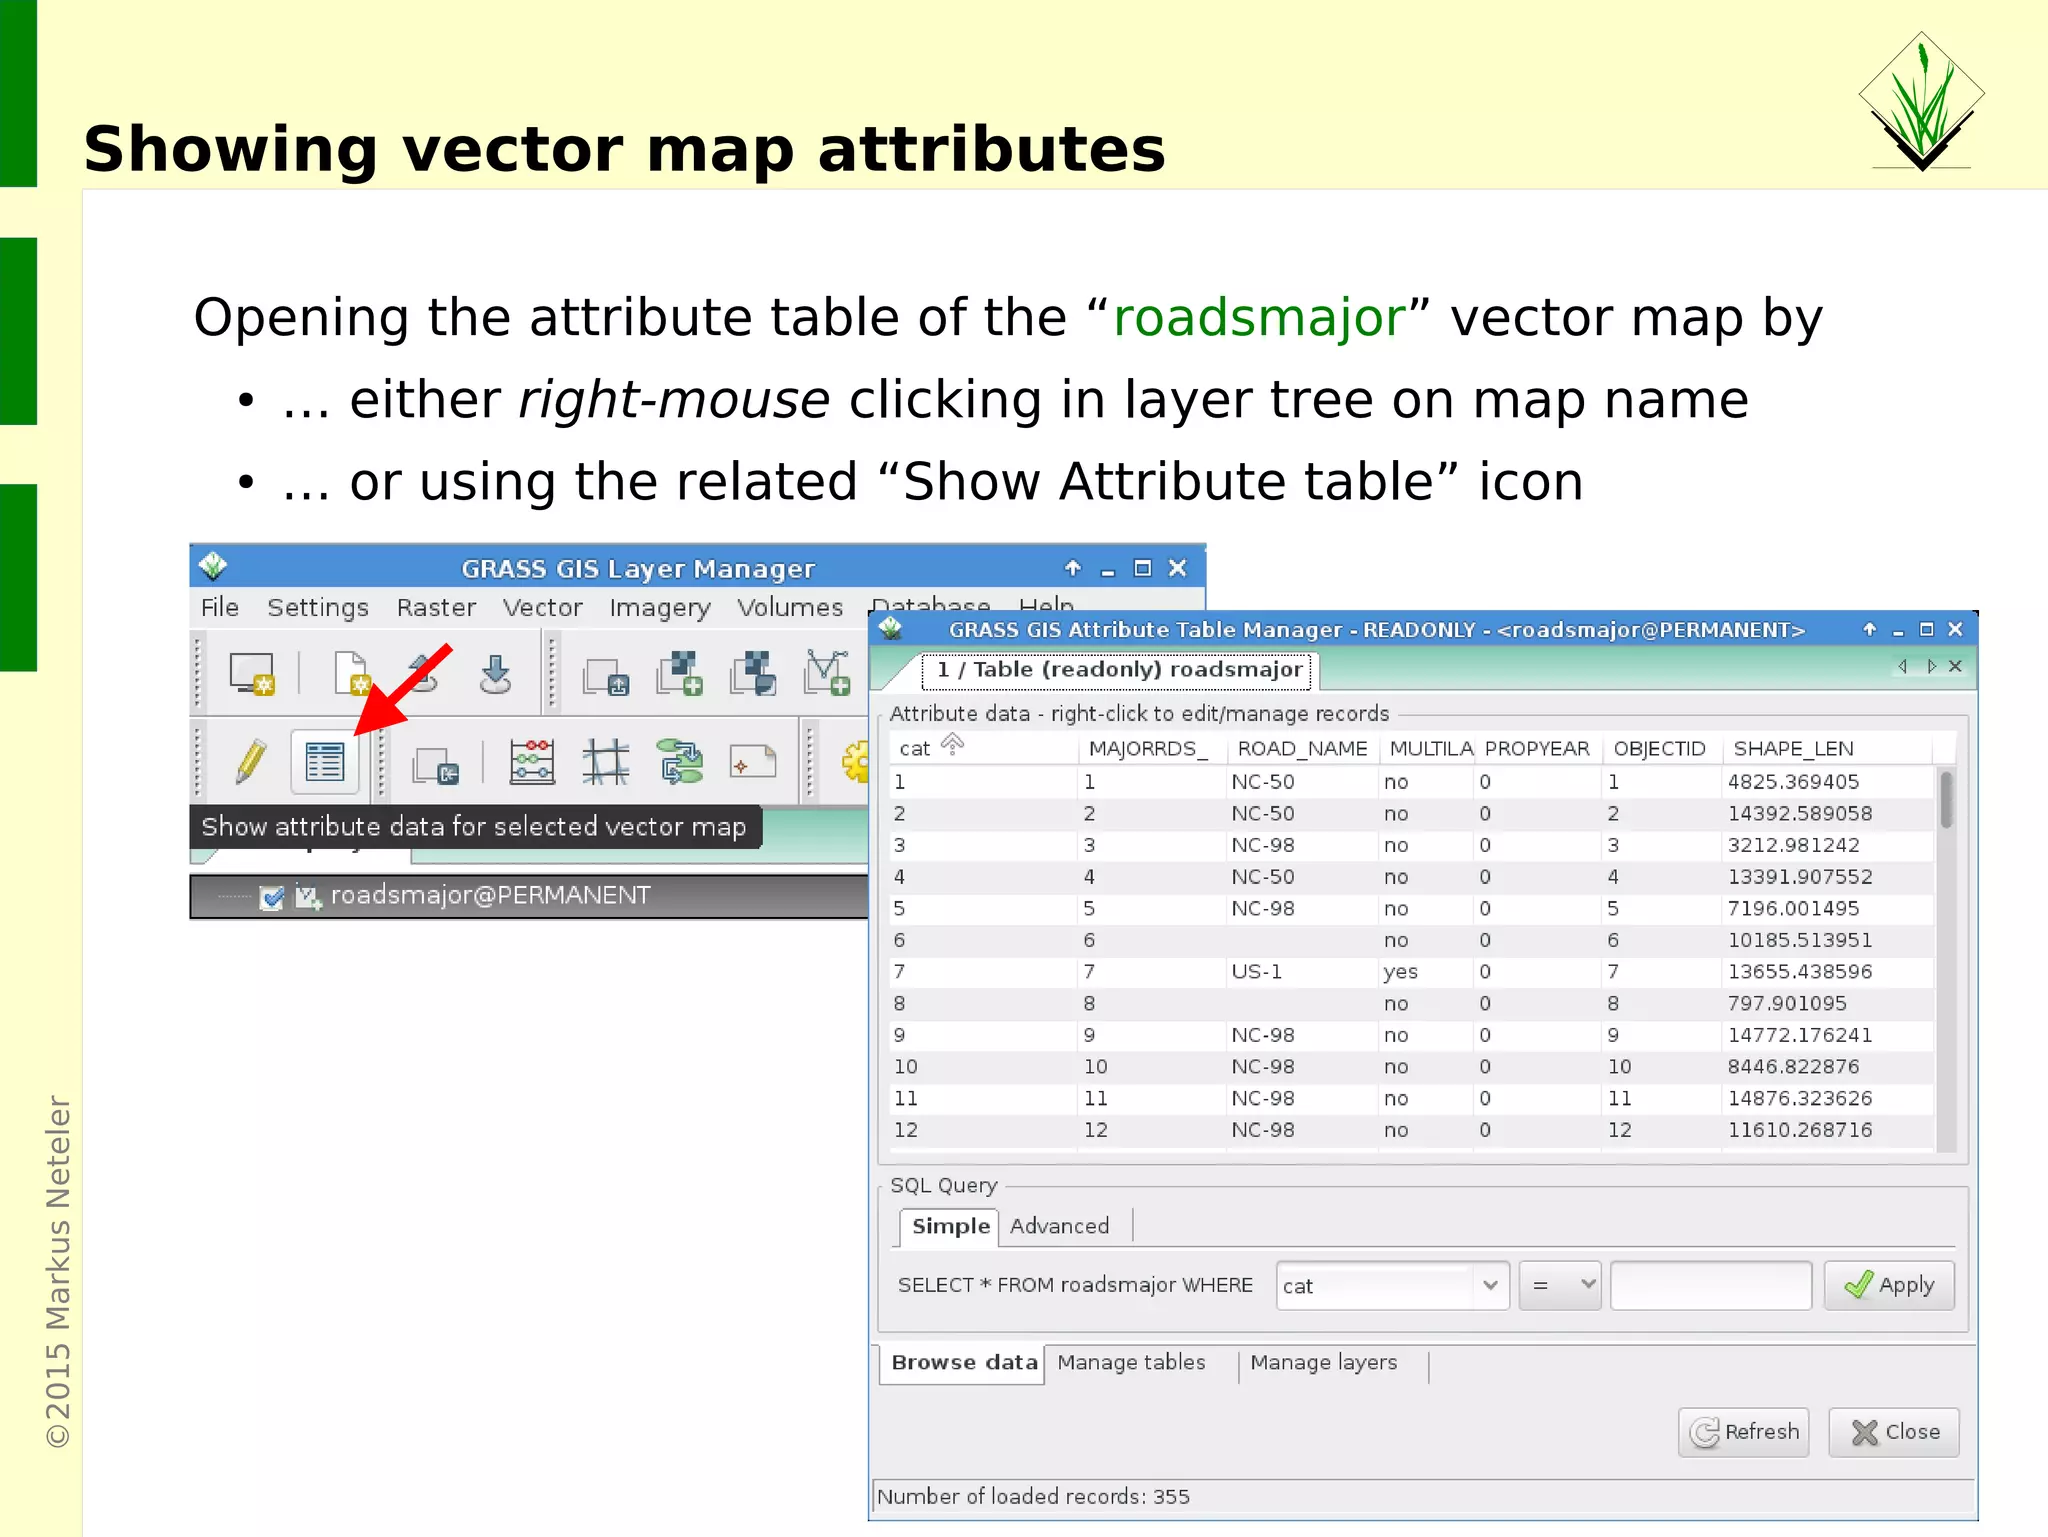
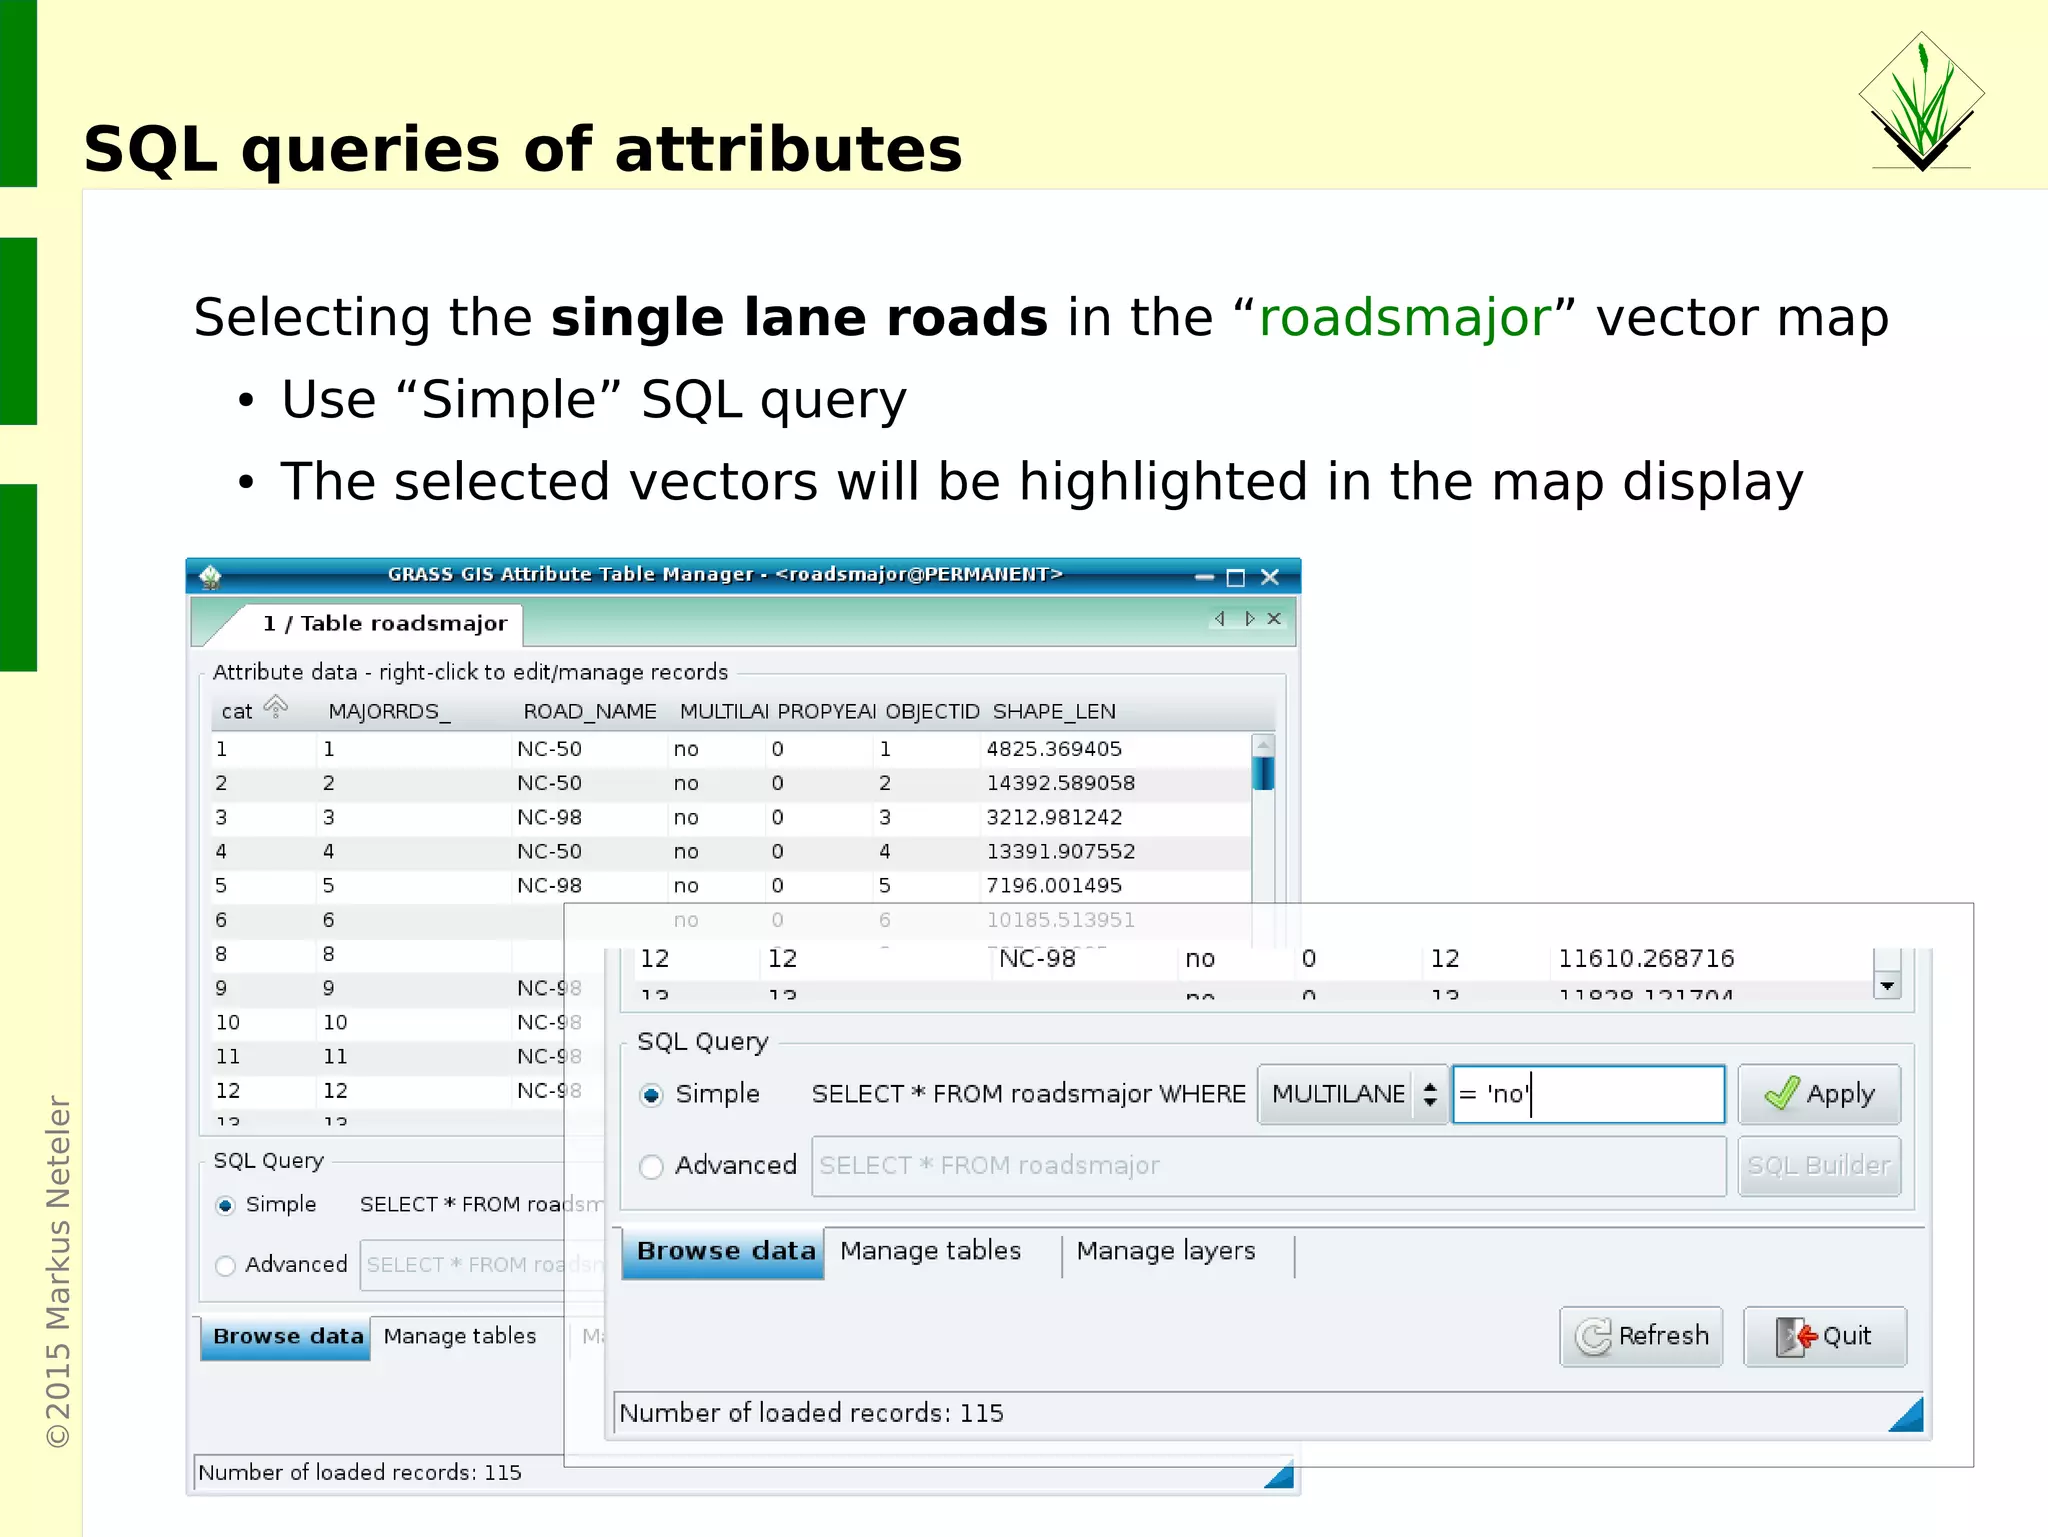
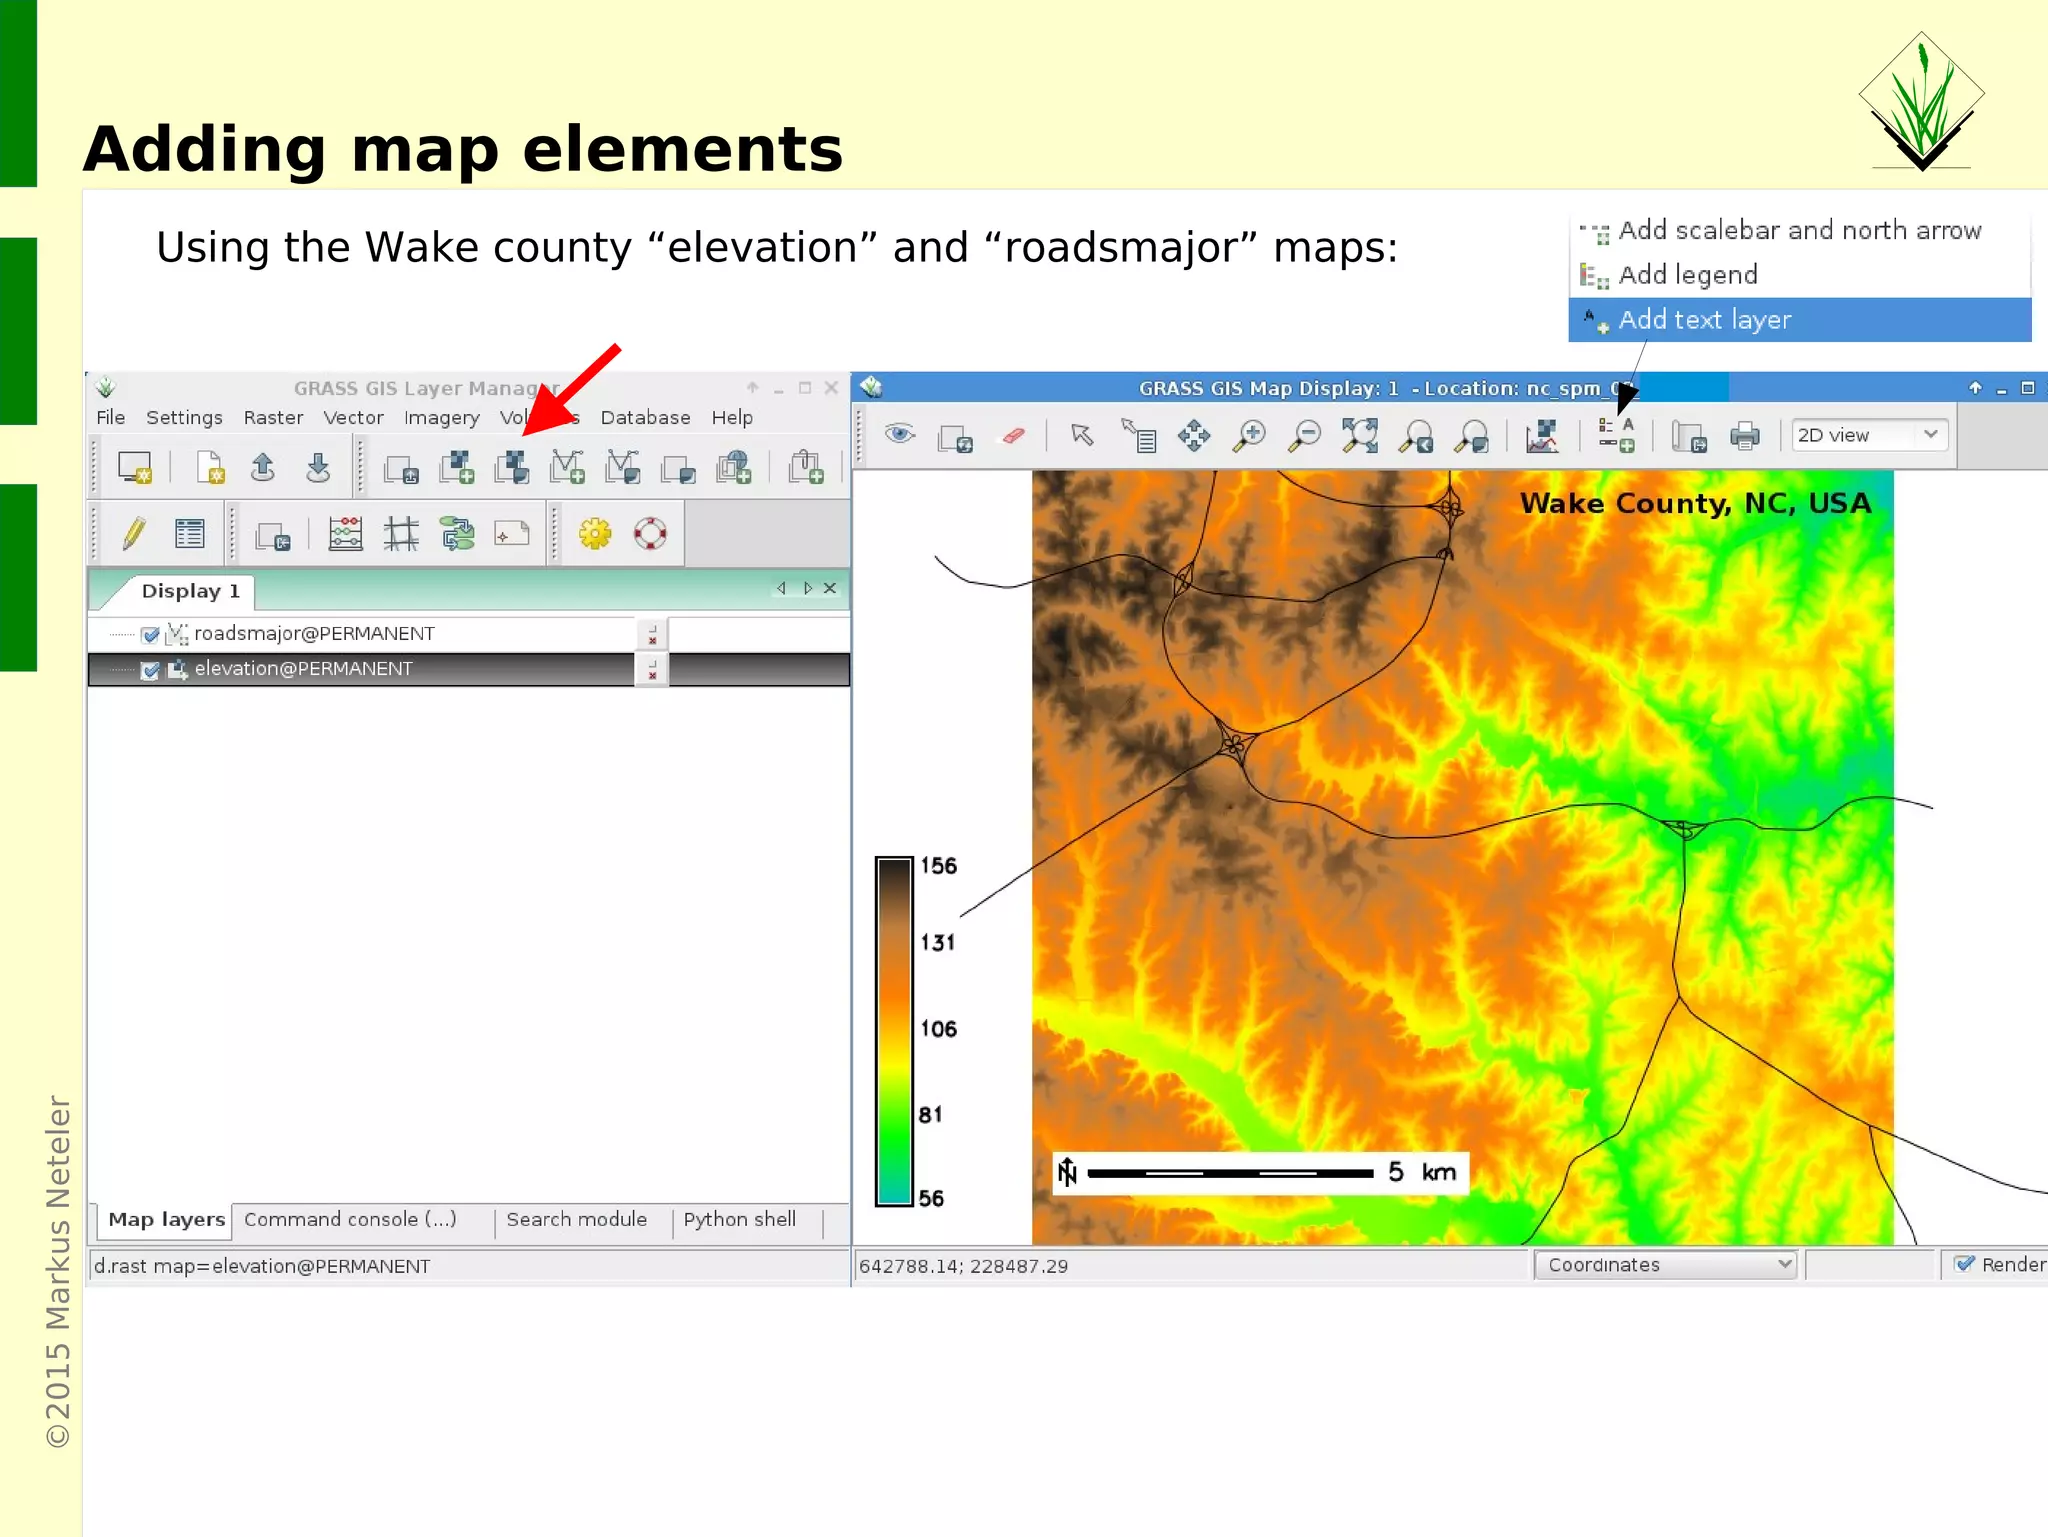
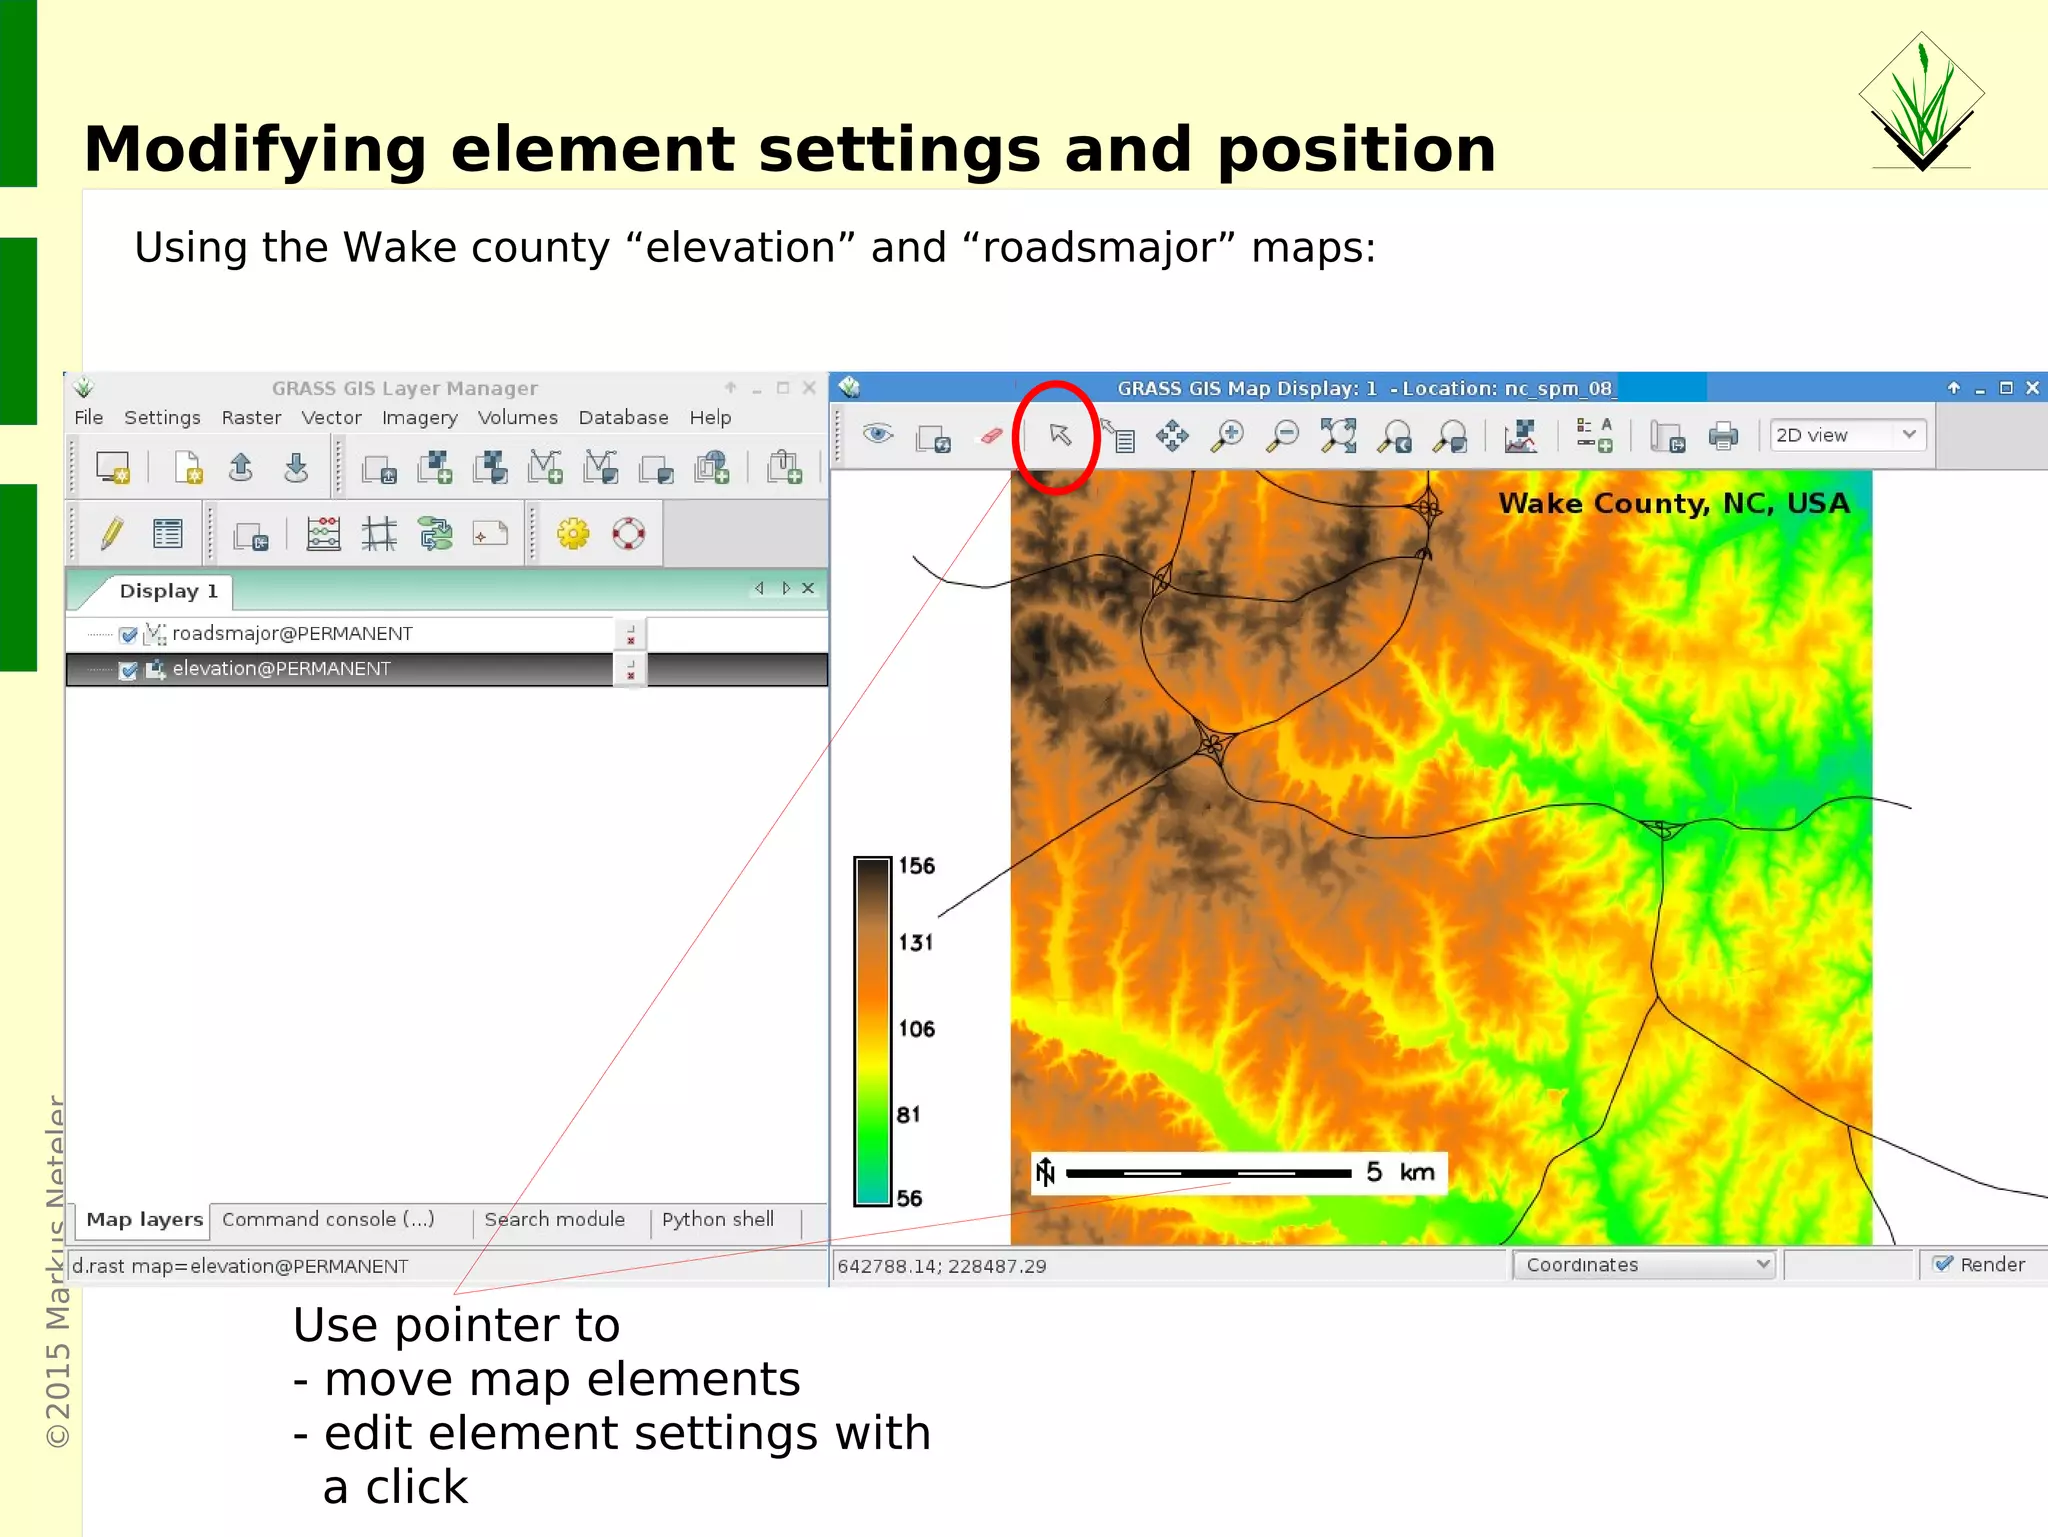
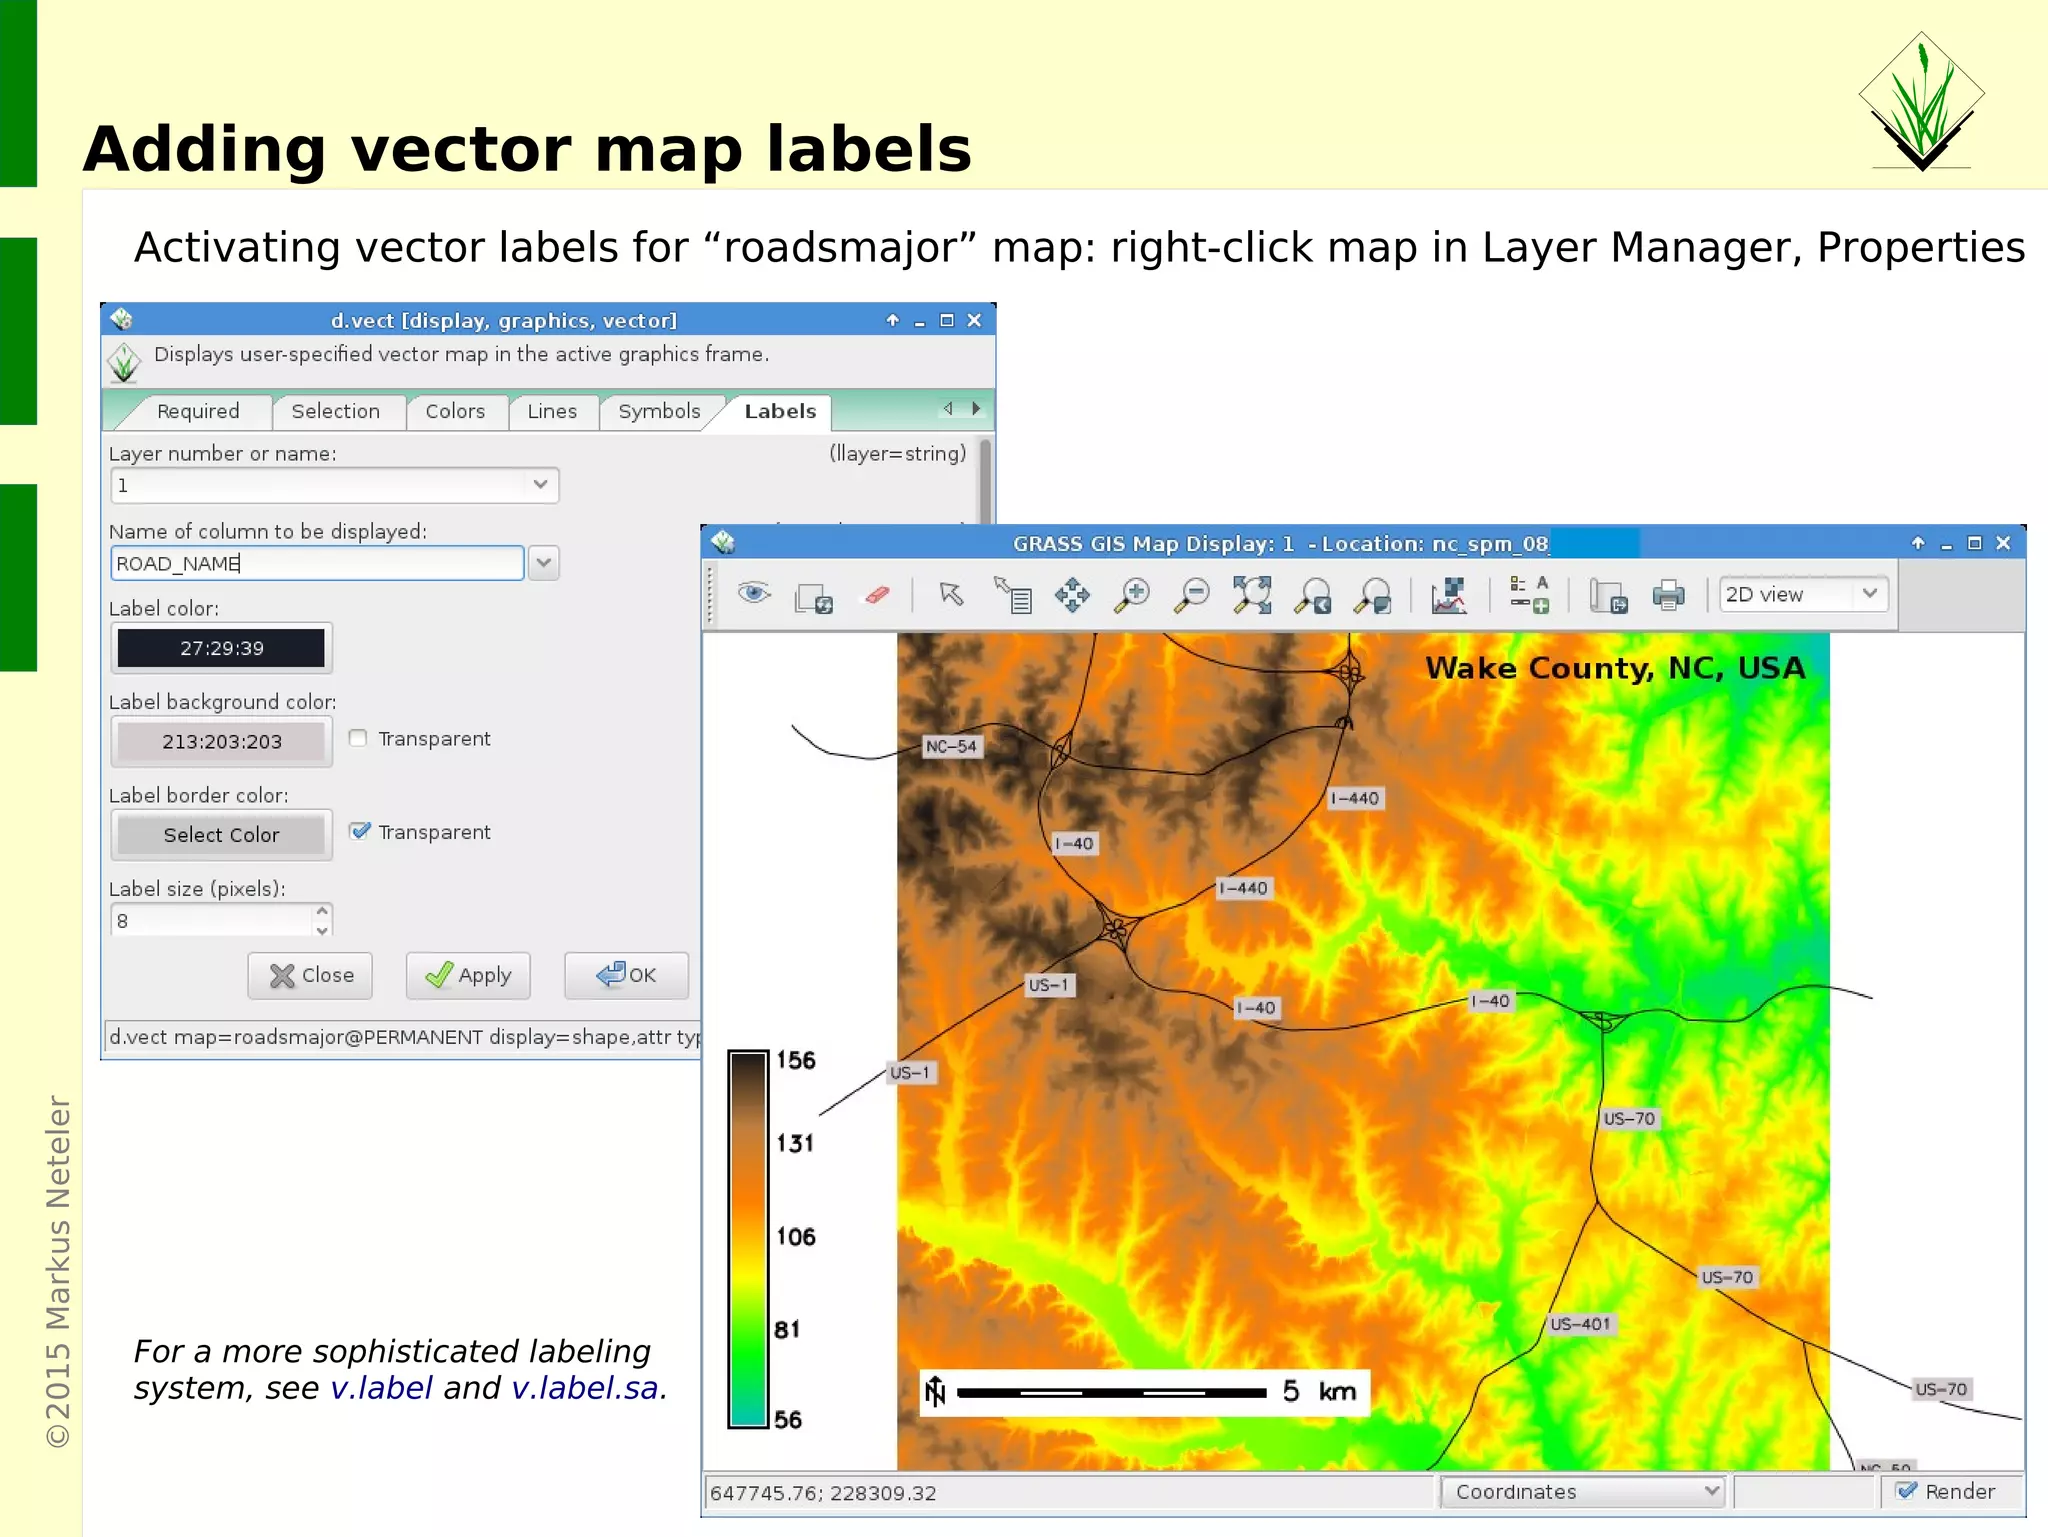
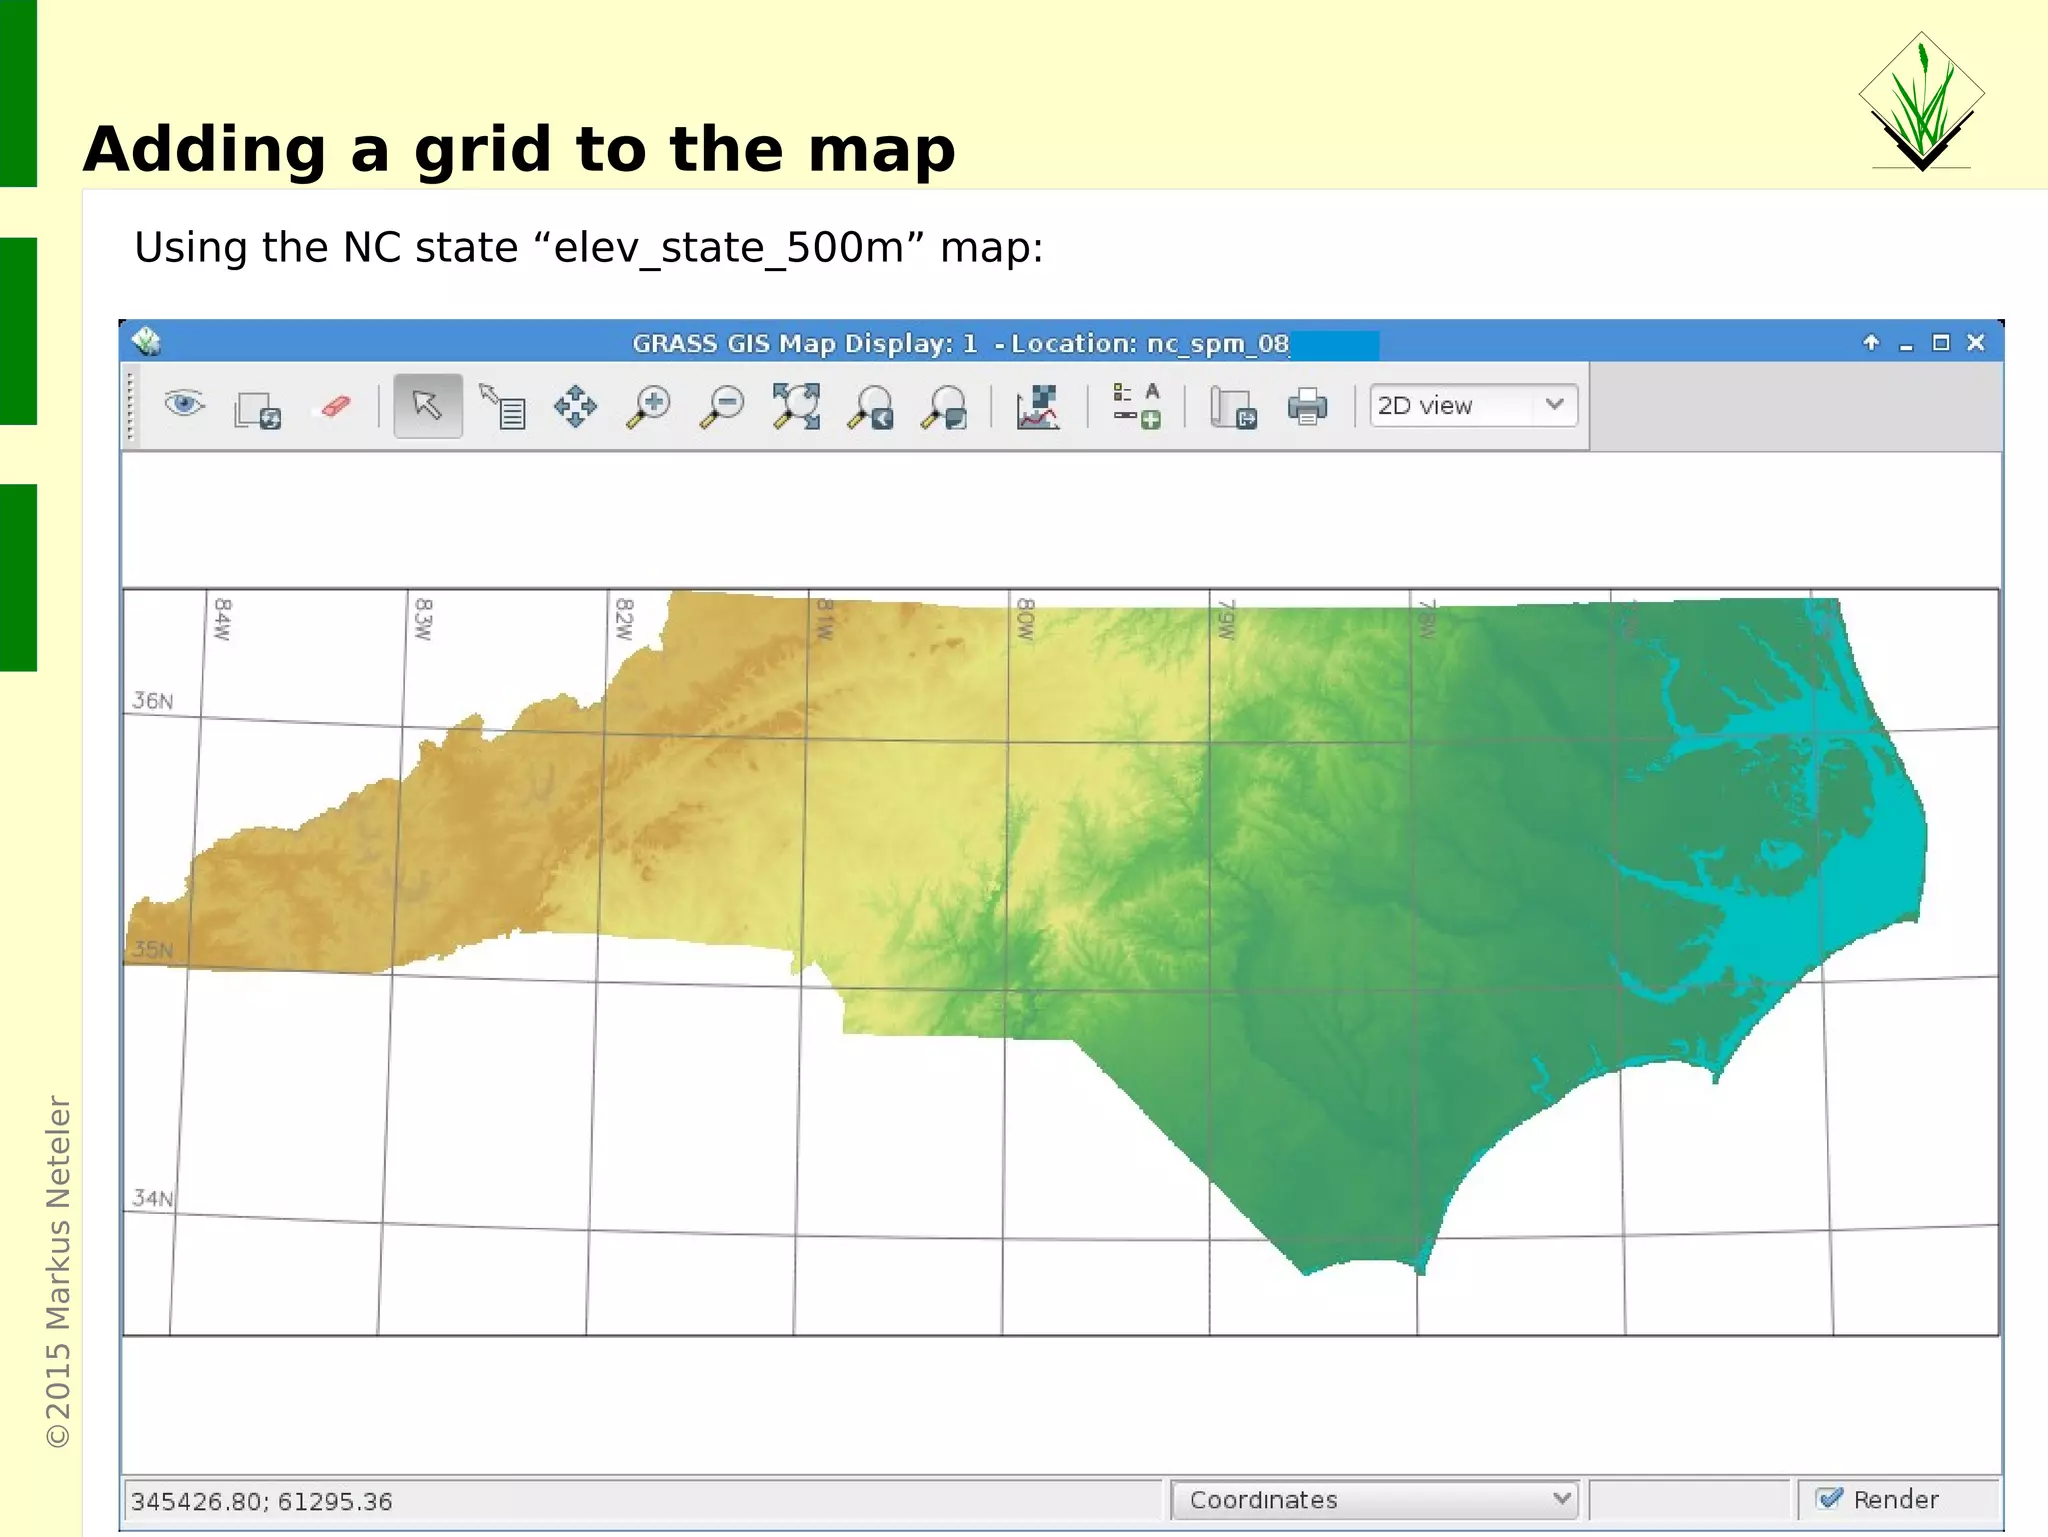
Explore GRASS GIS 7 graphical user interface, map displaying options, attribute table access, and SQL queries for vector maps.
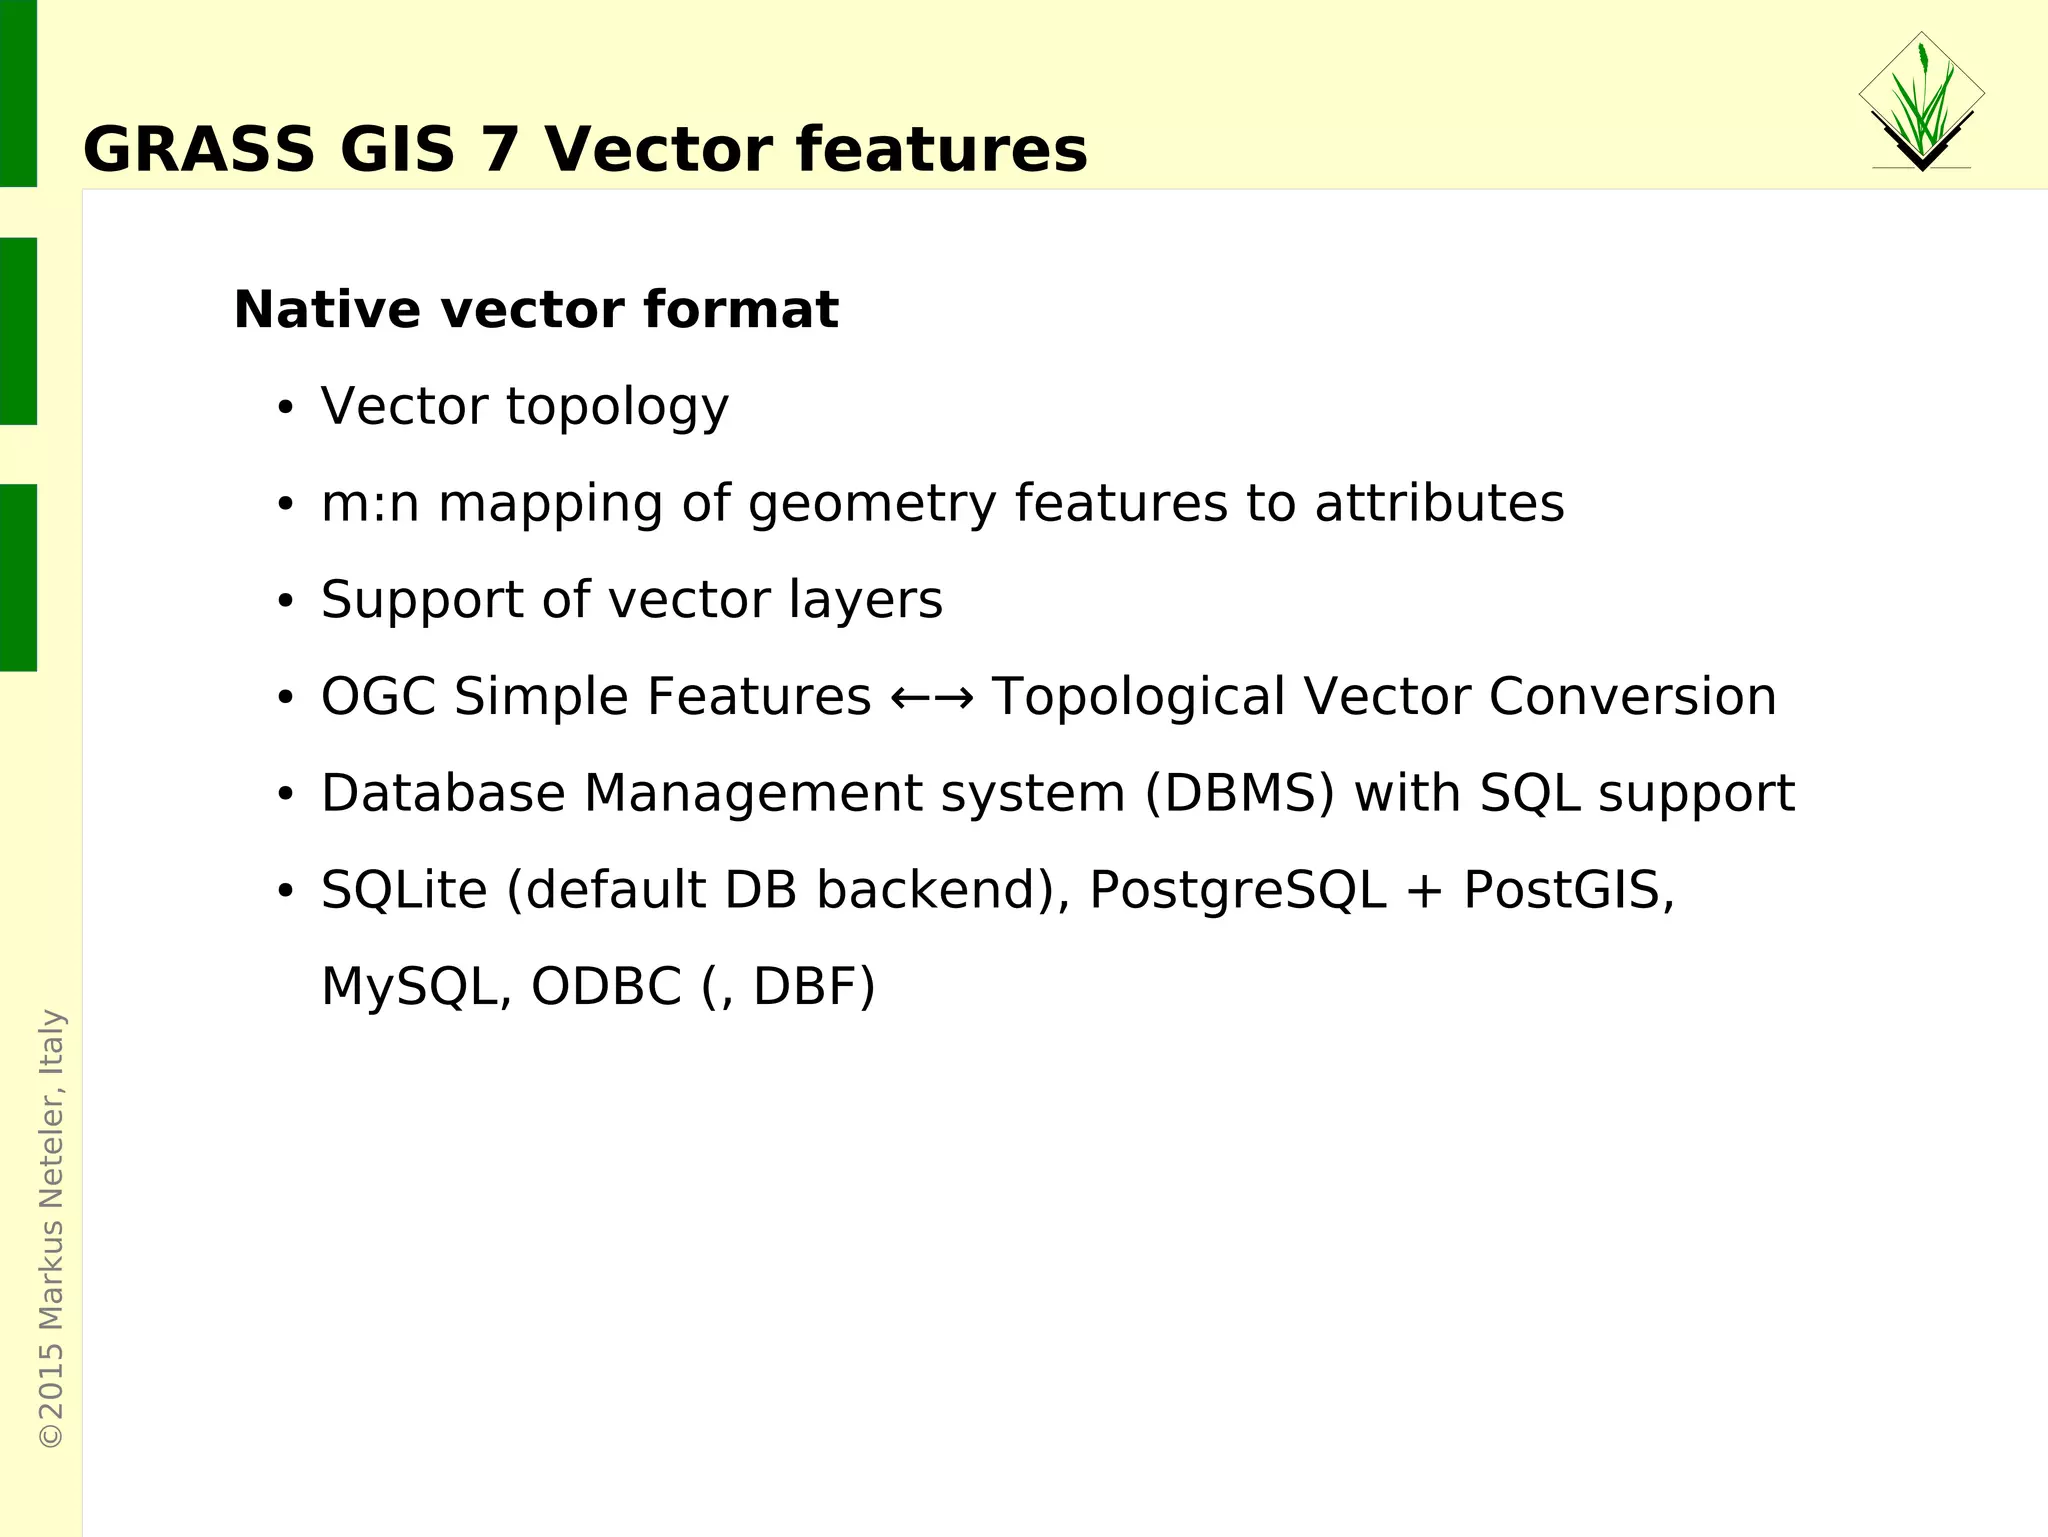
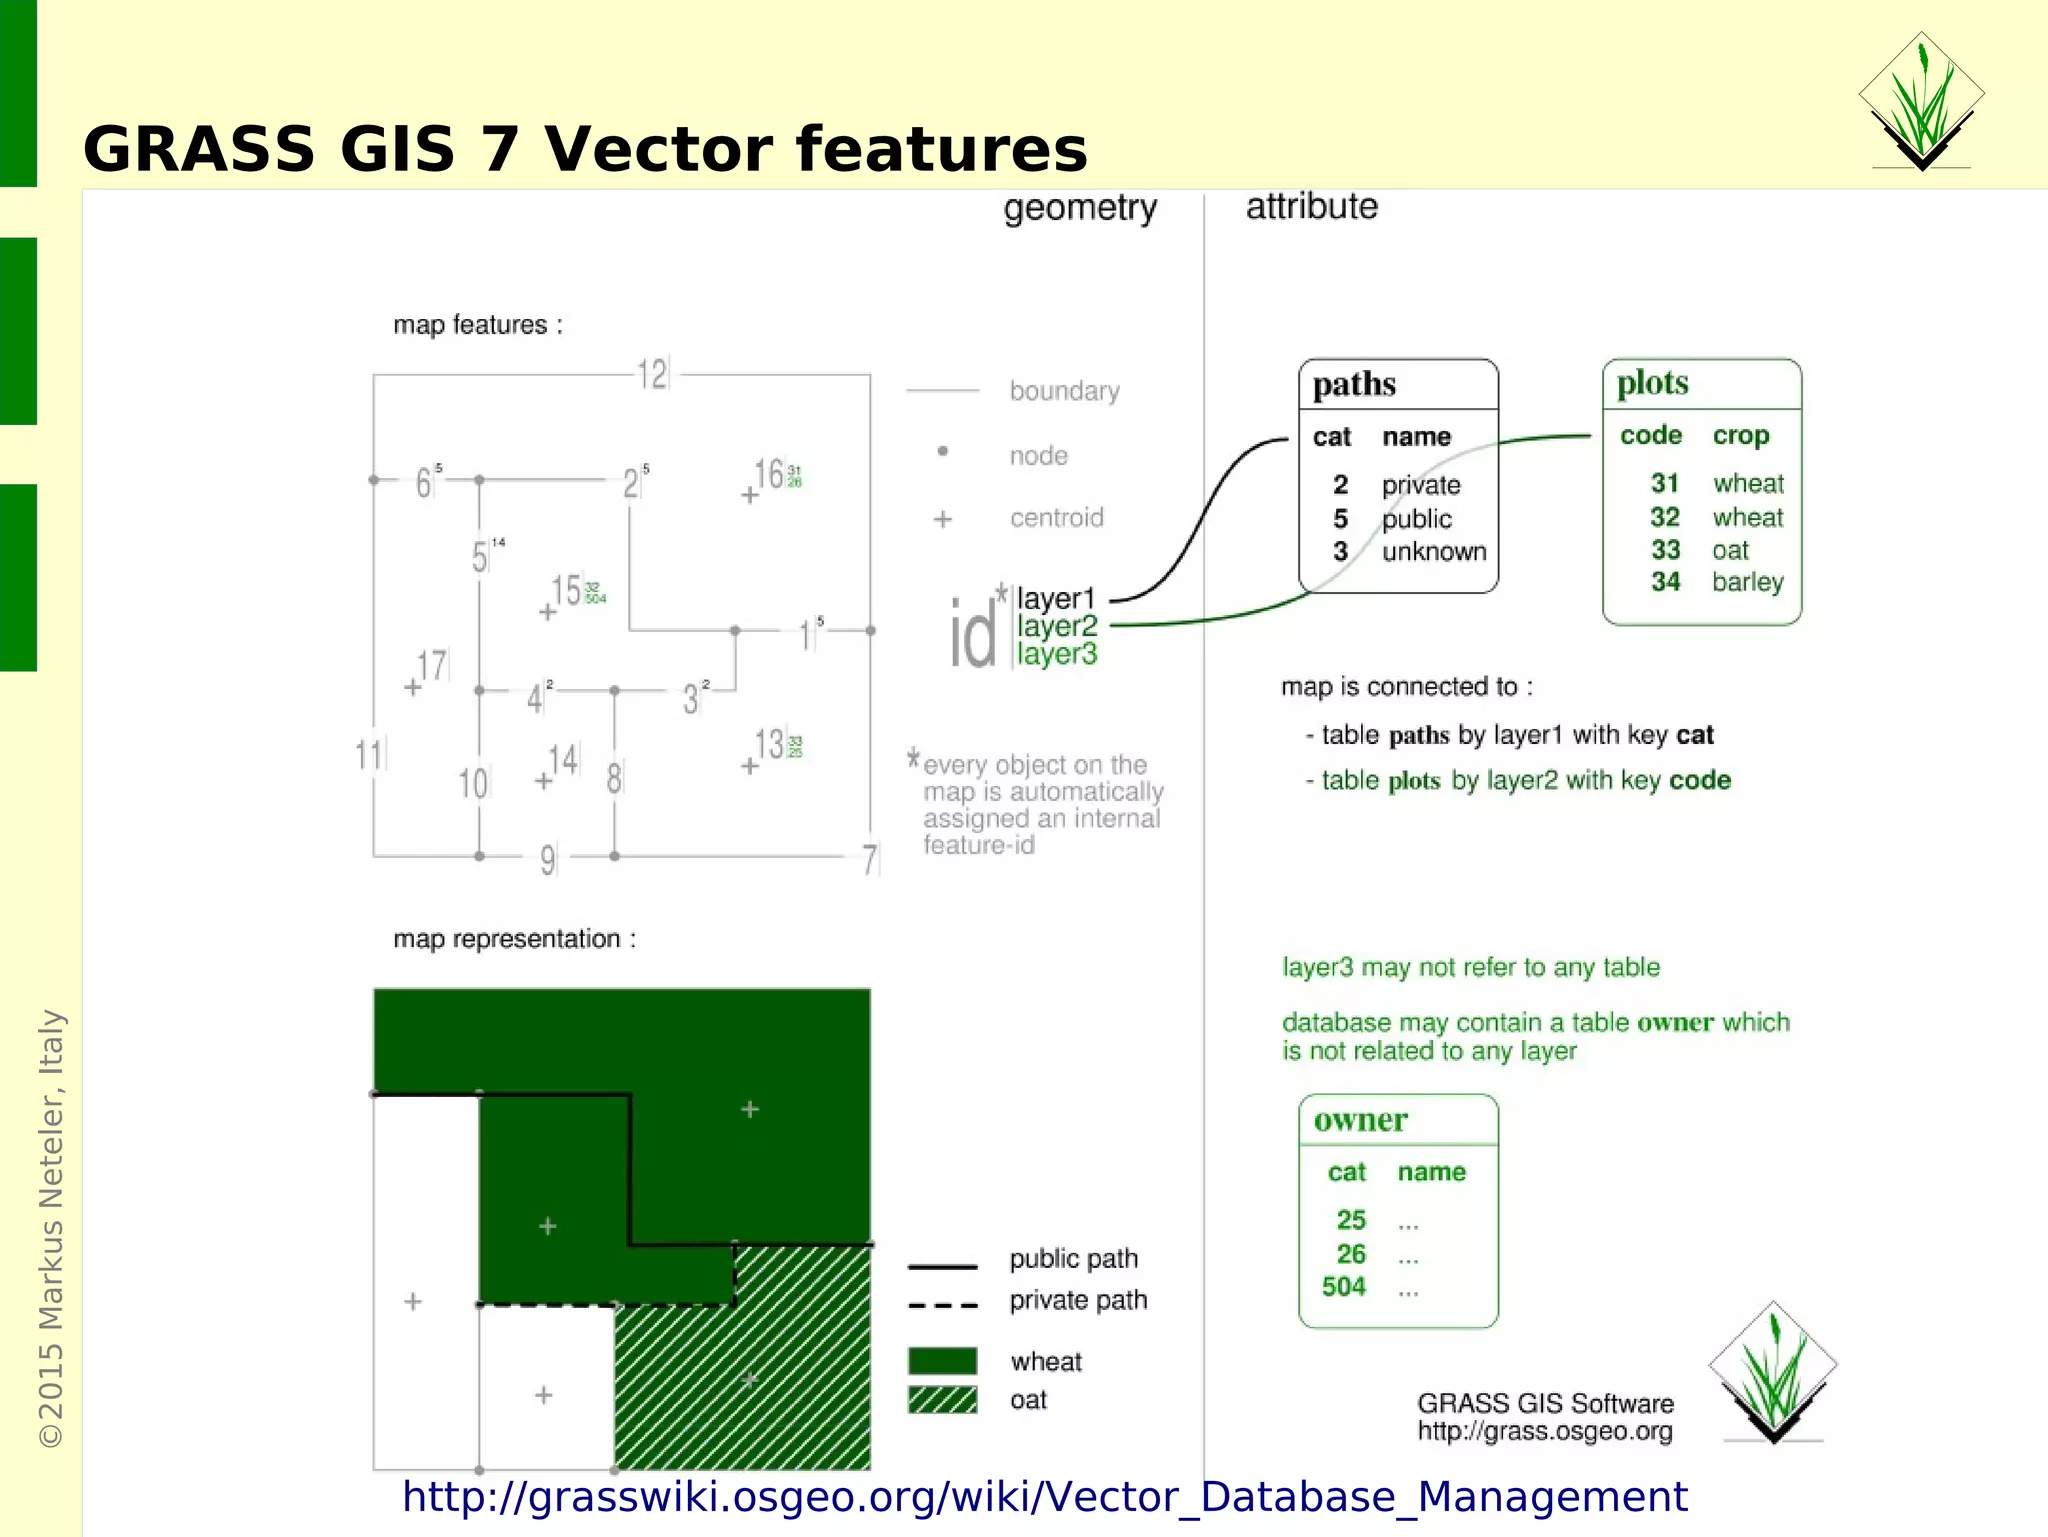
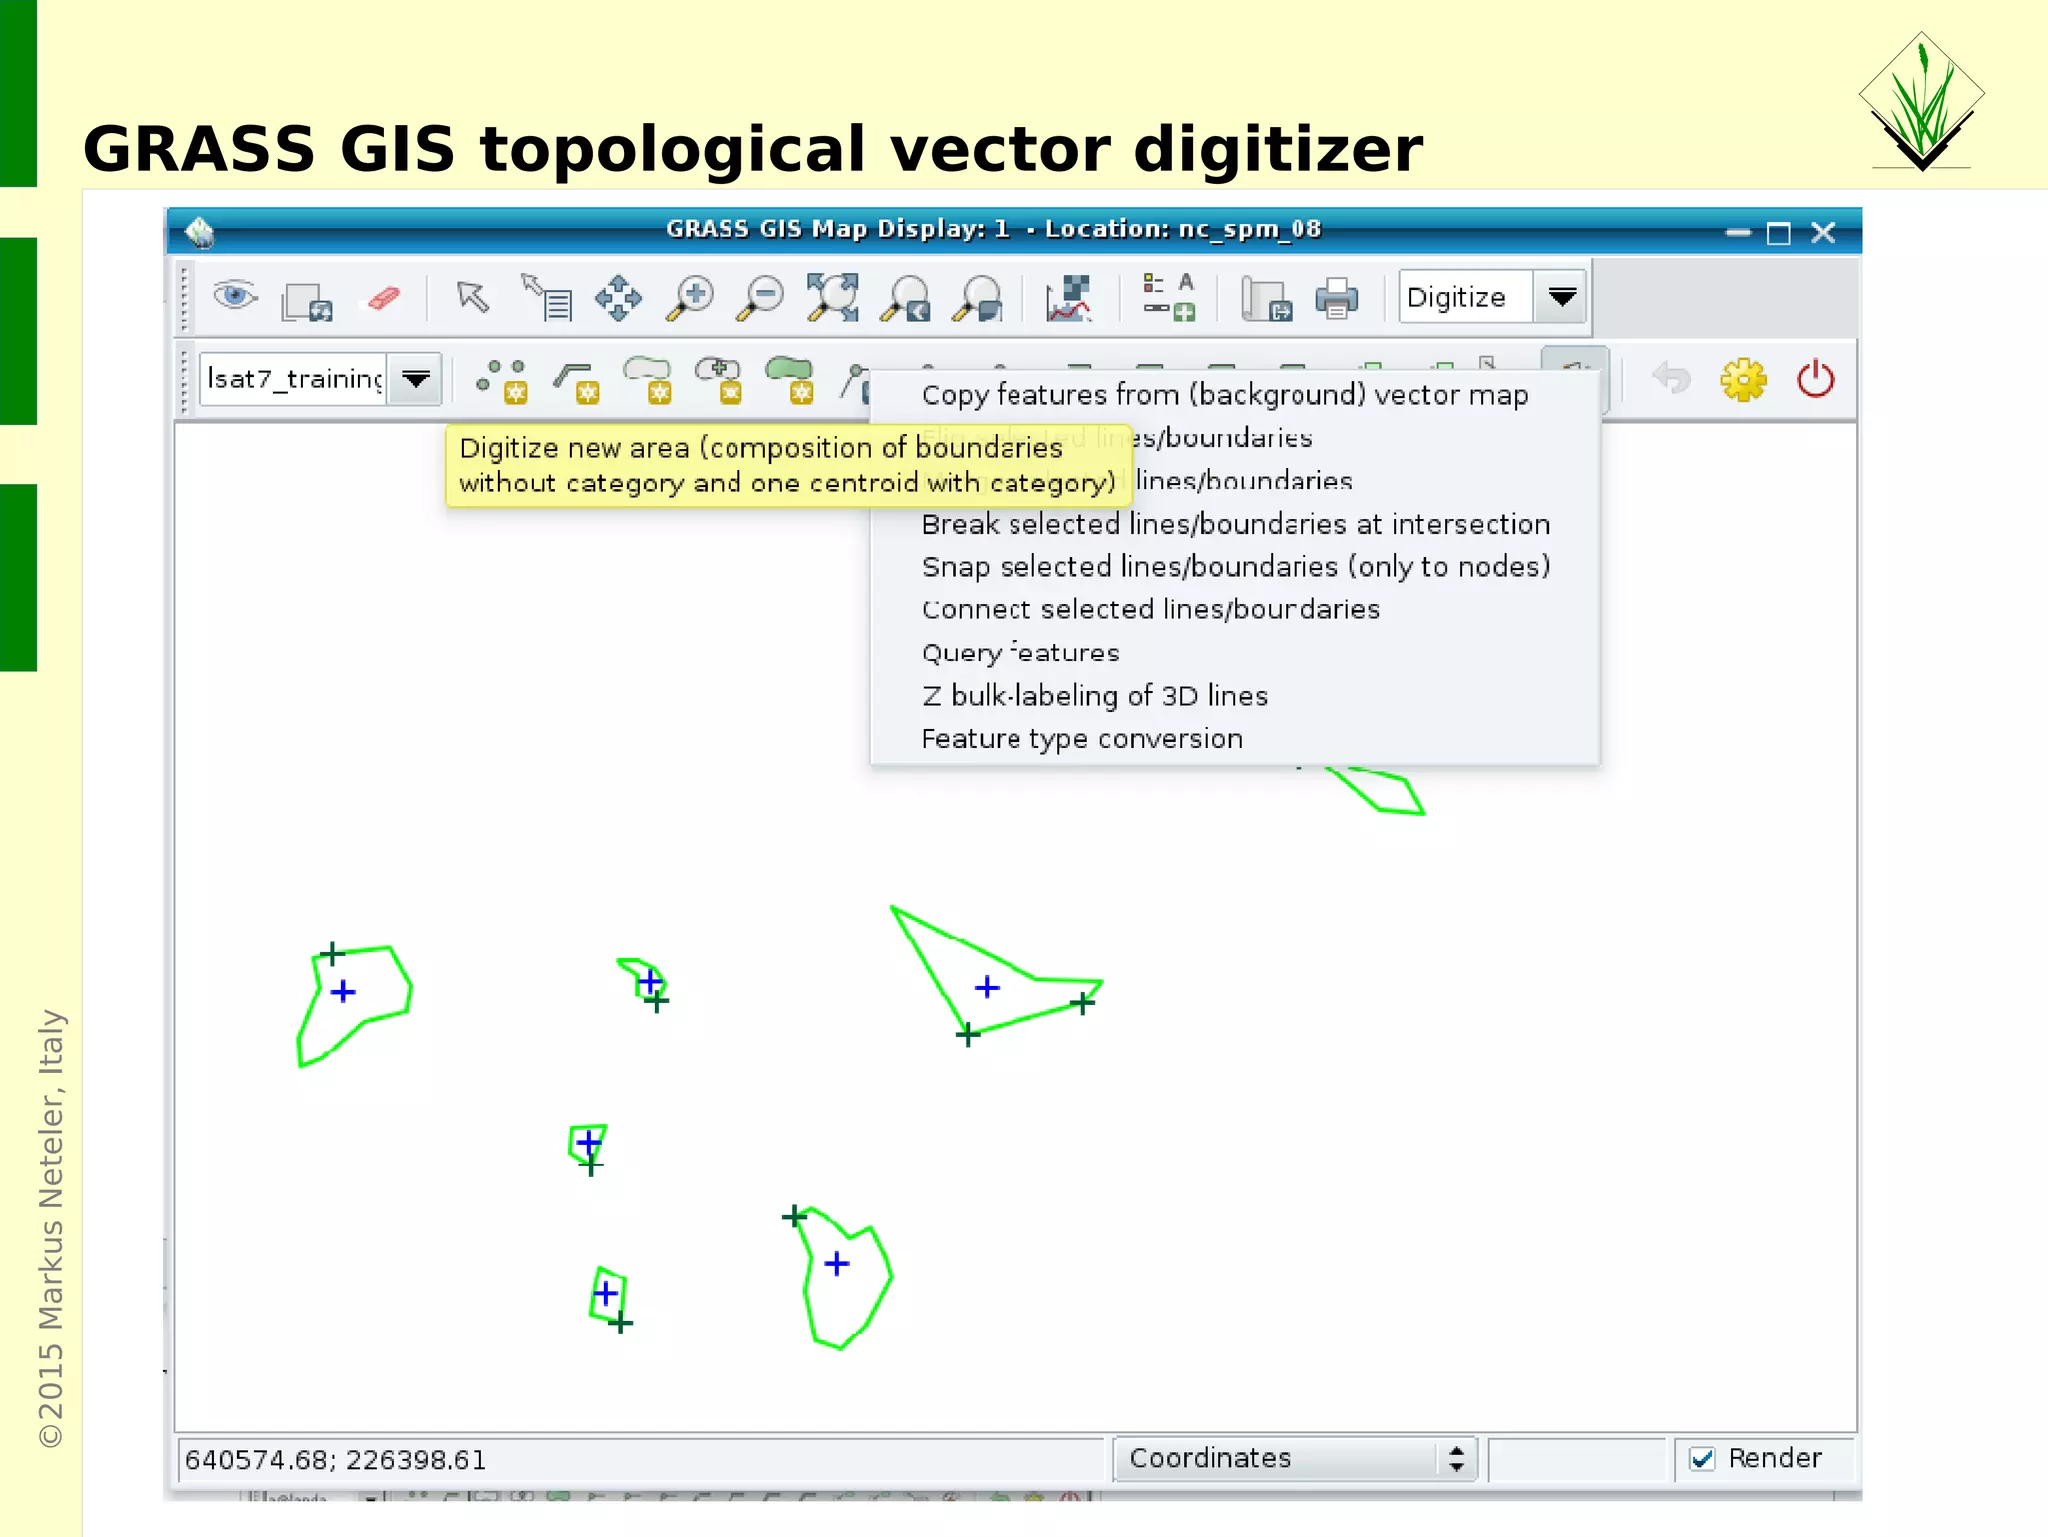
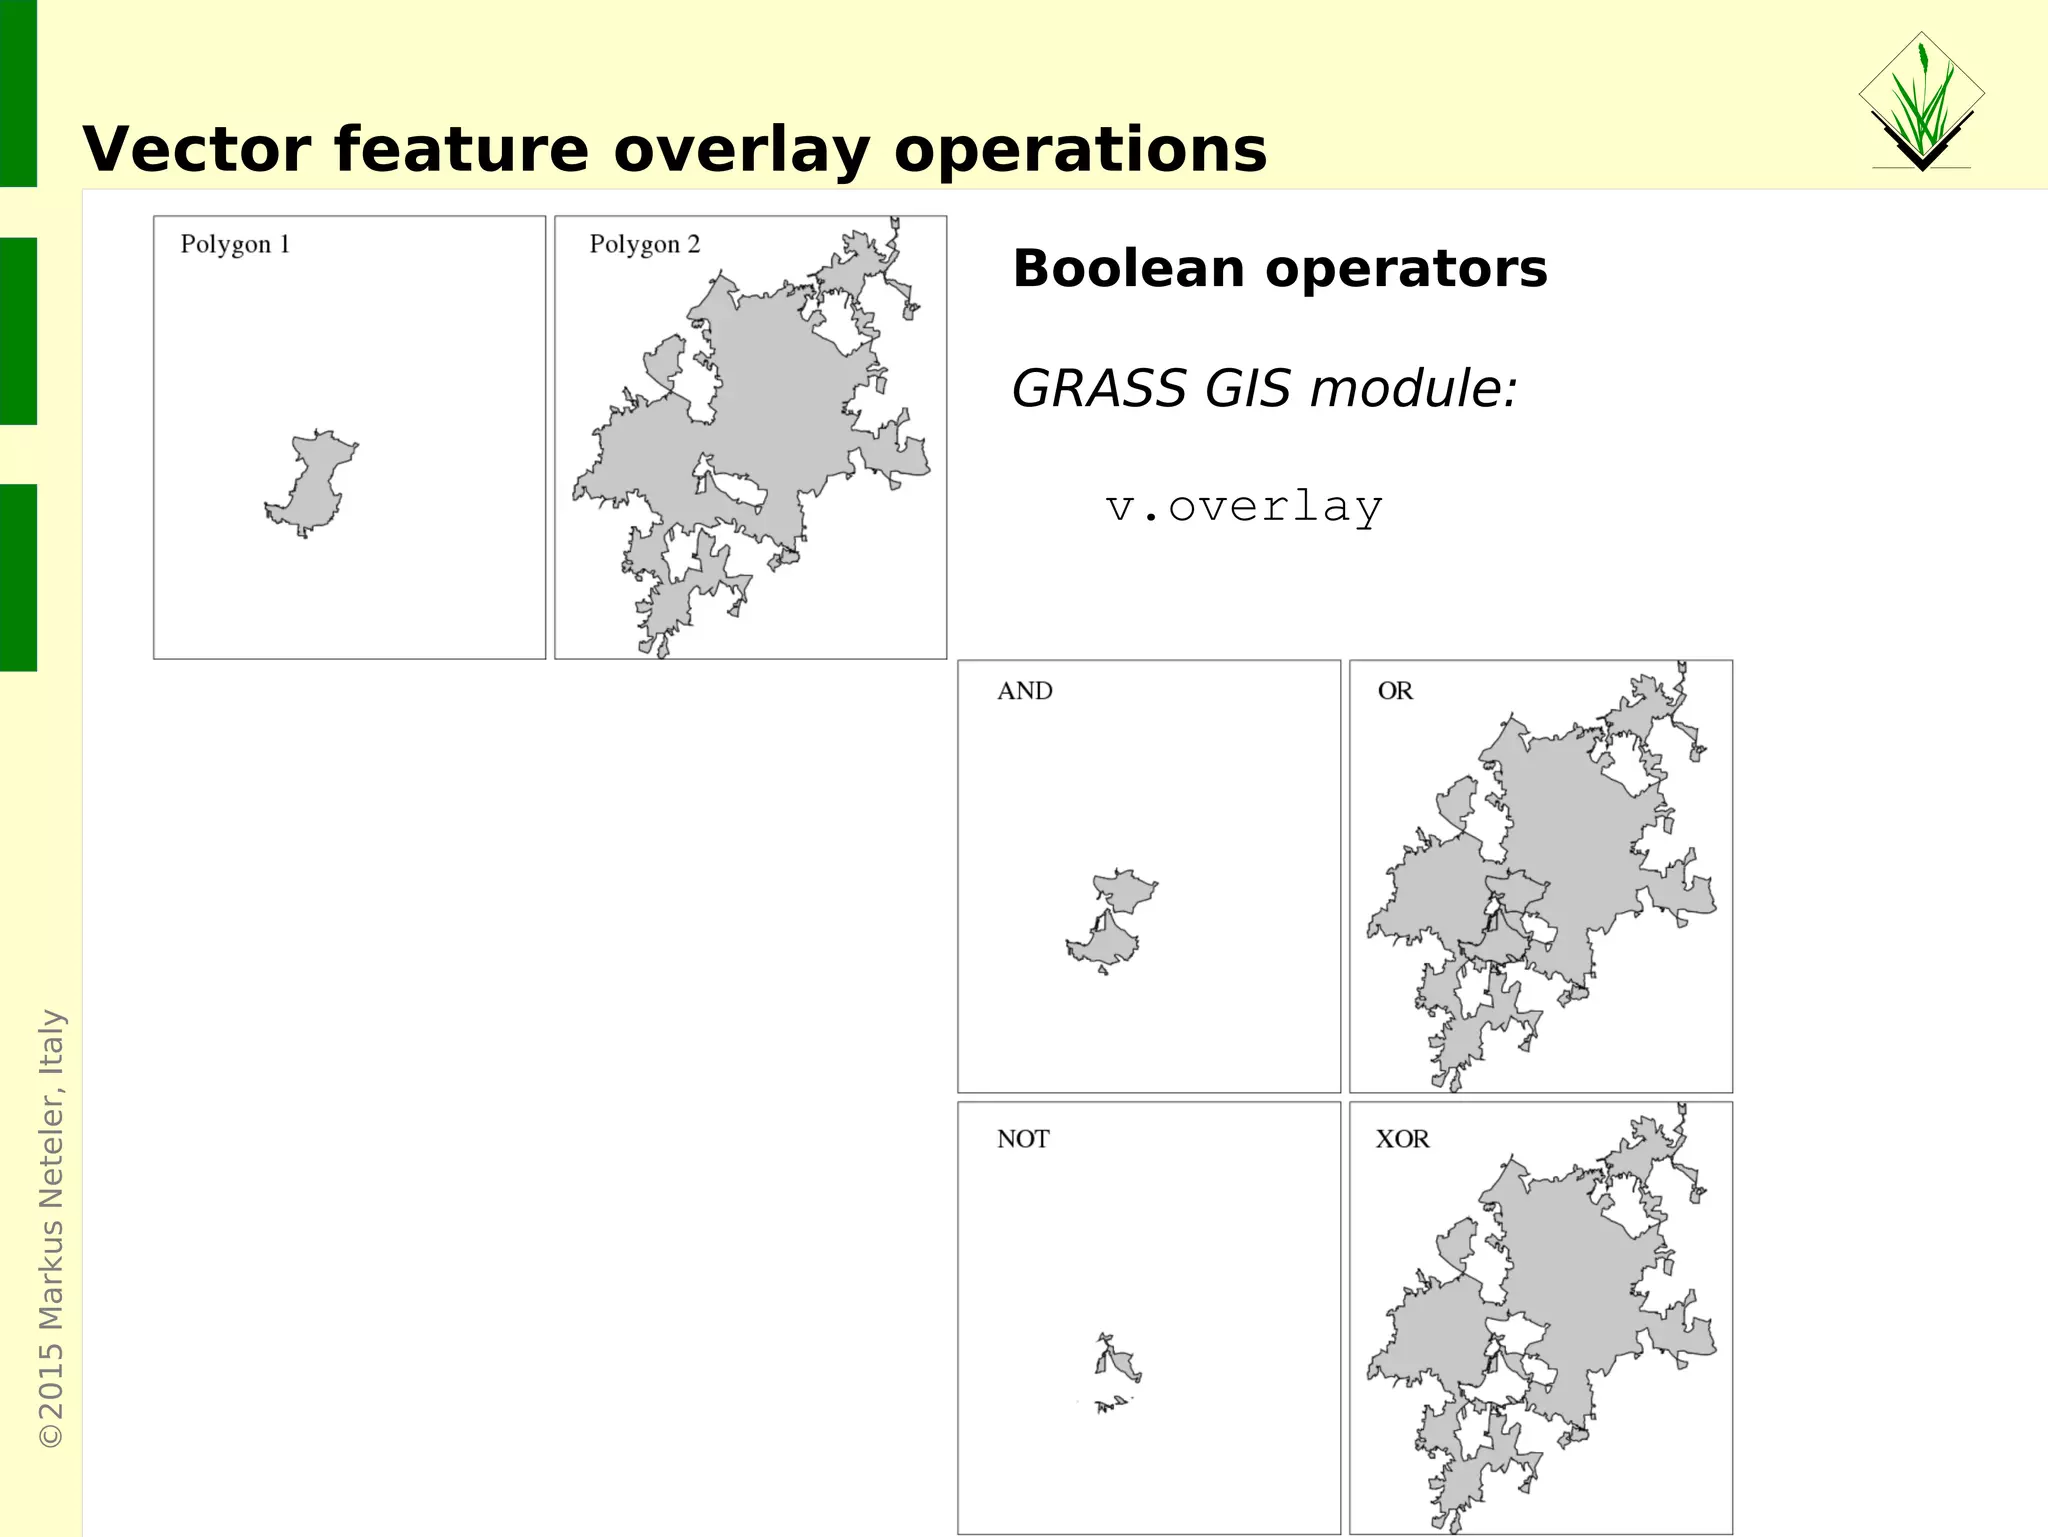
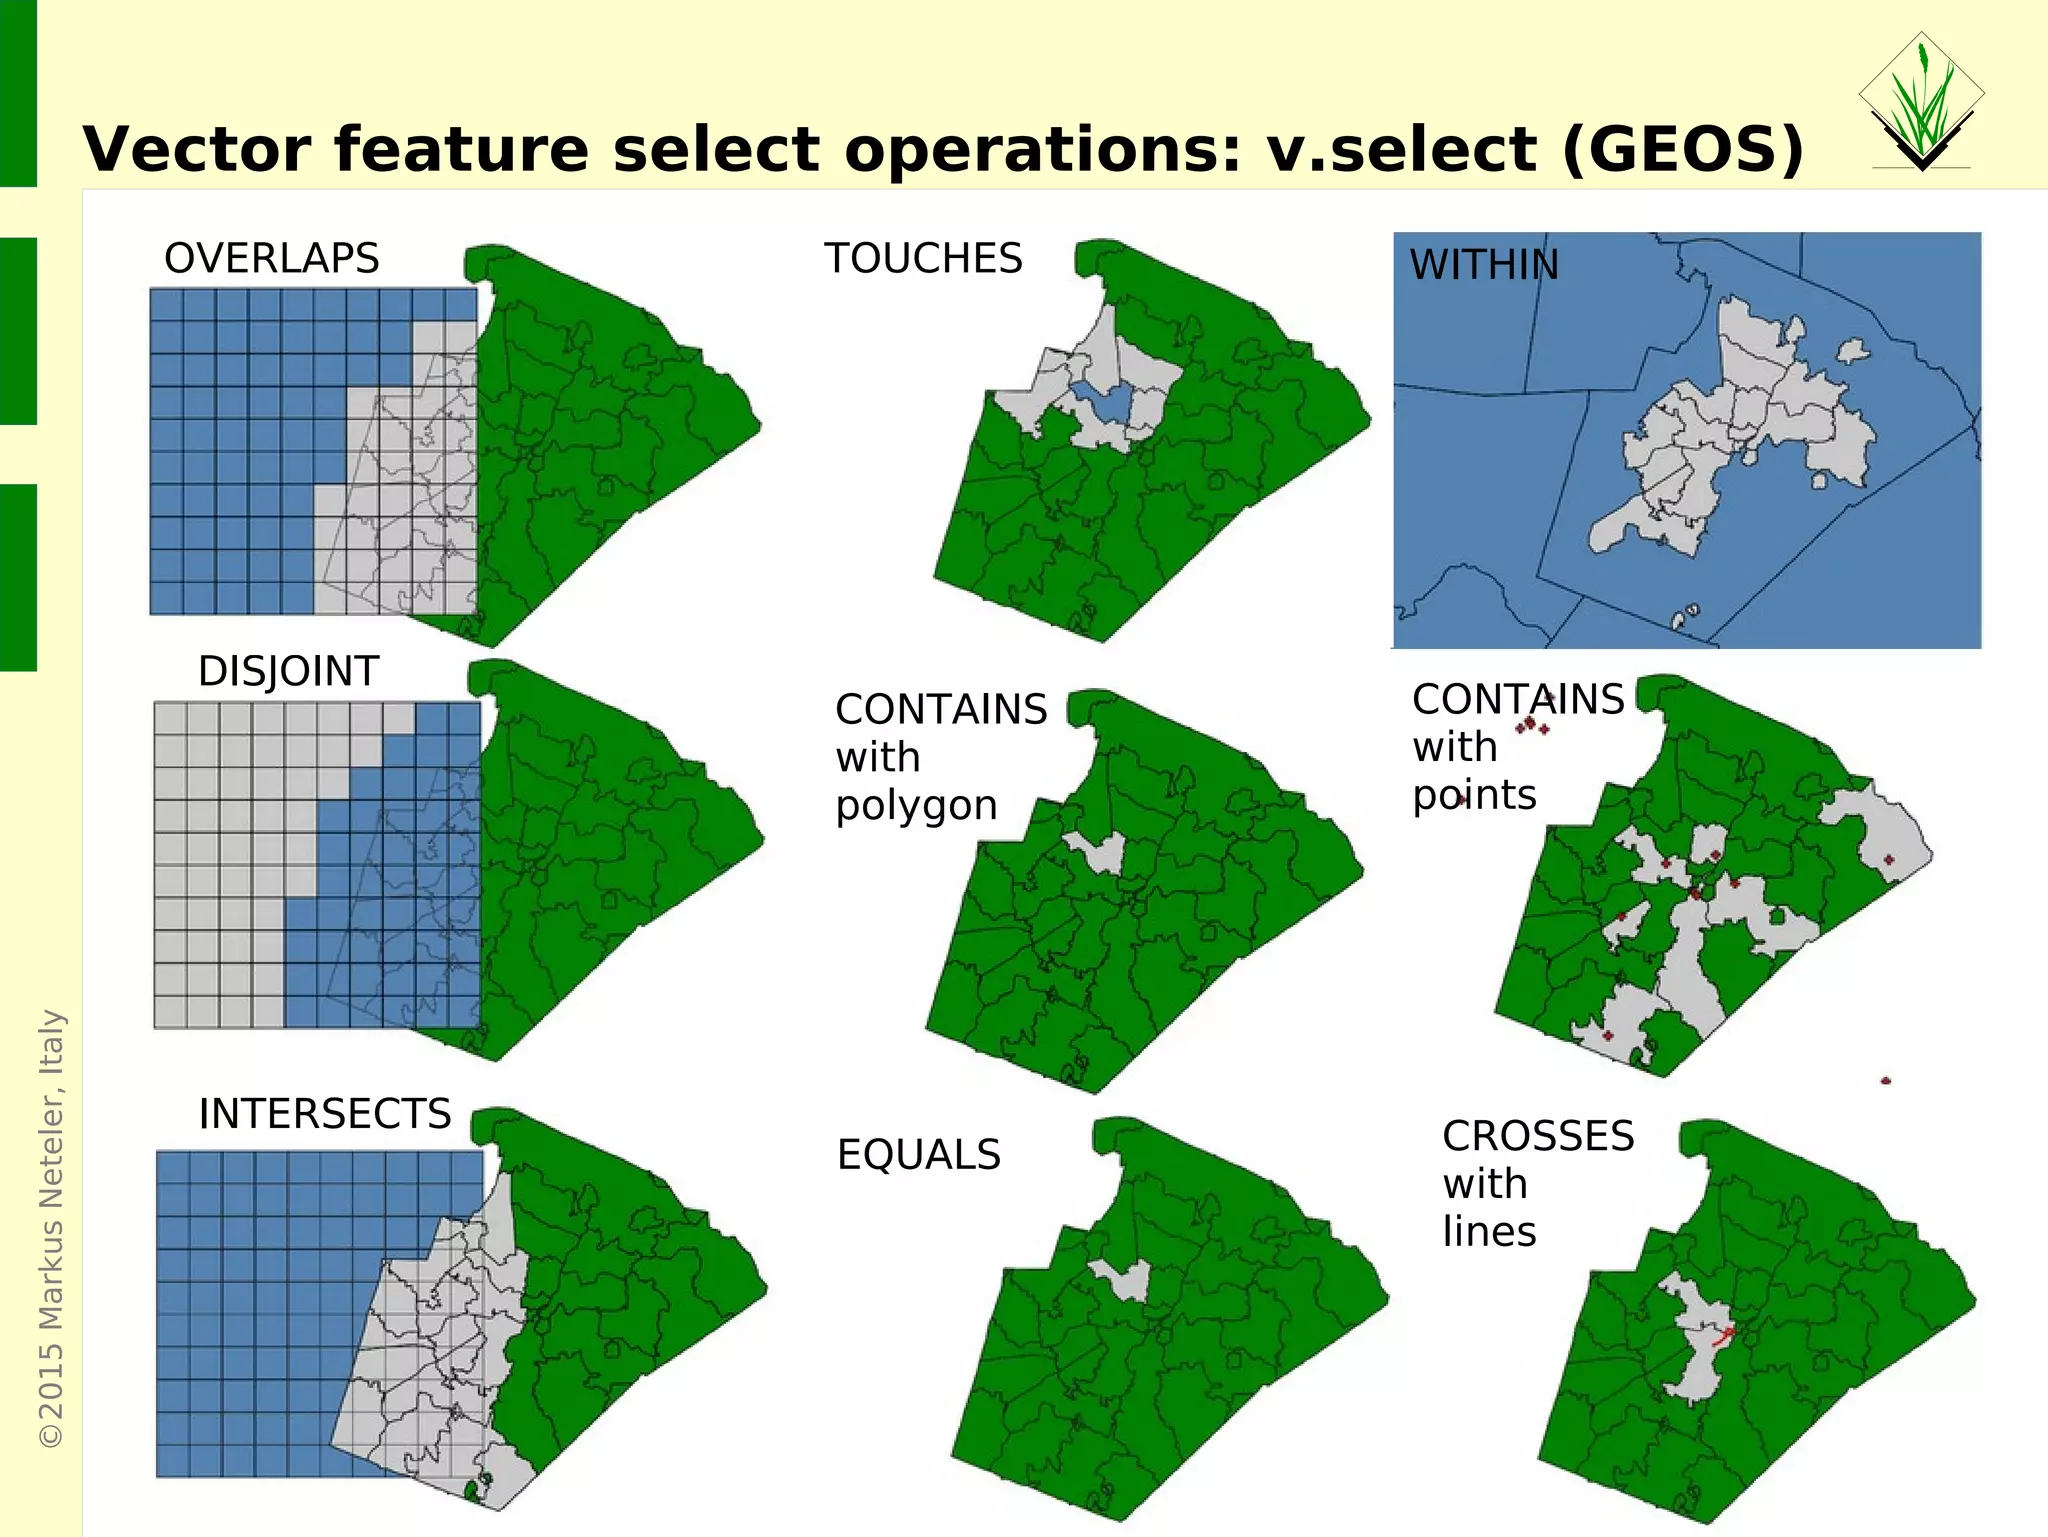
Overview of vector features, including topology, DBMS integration, and various vector processing capabilities related to hydrology.
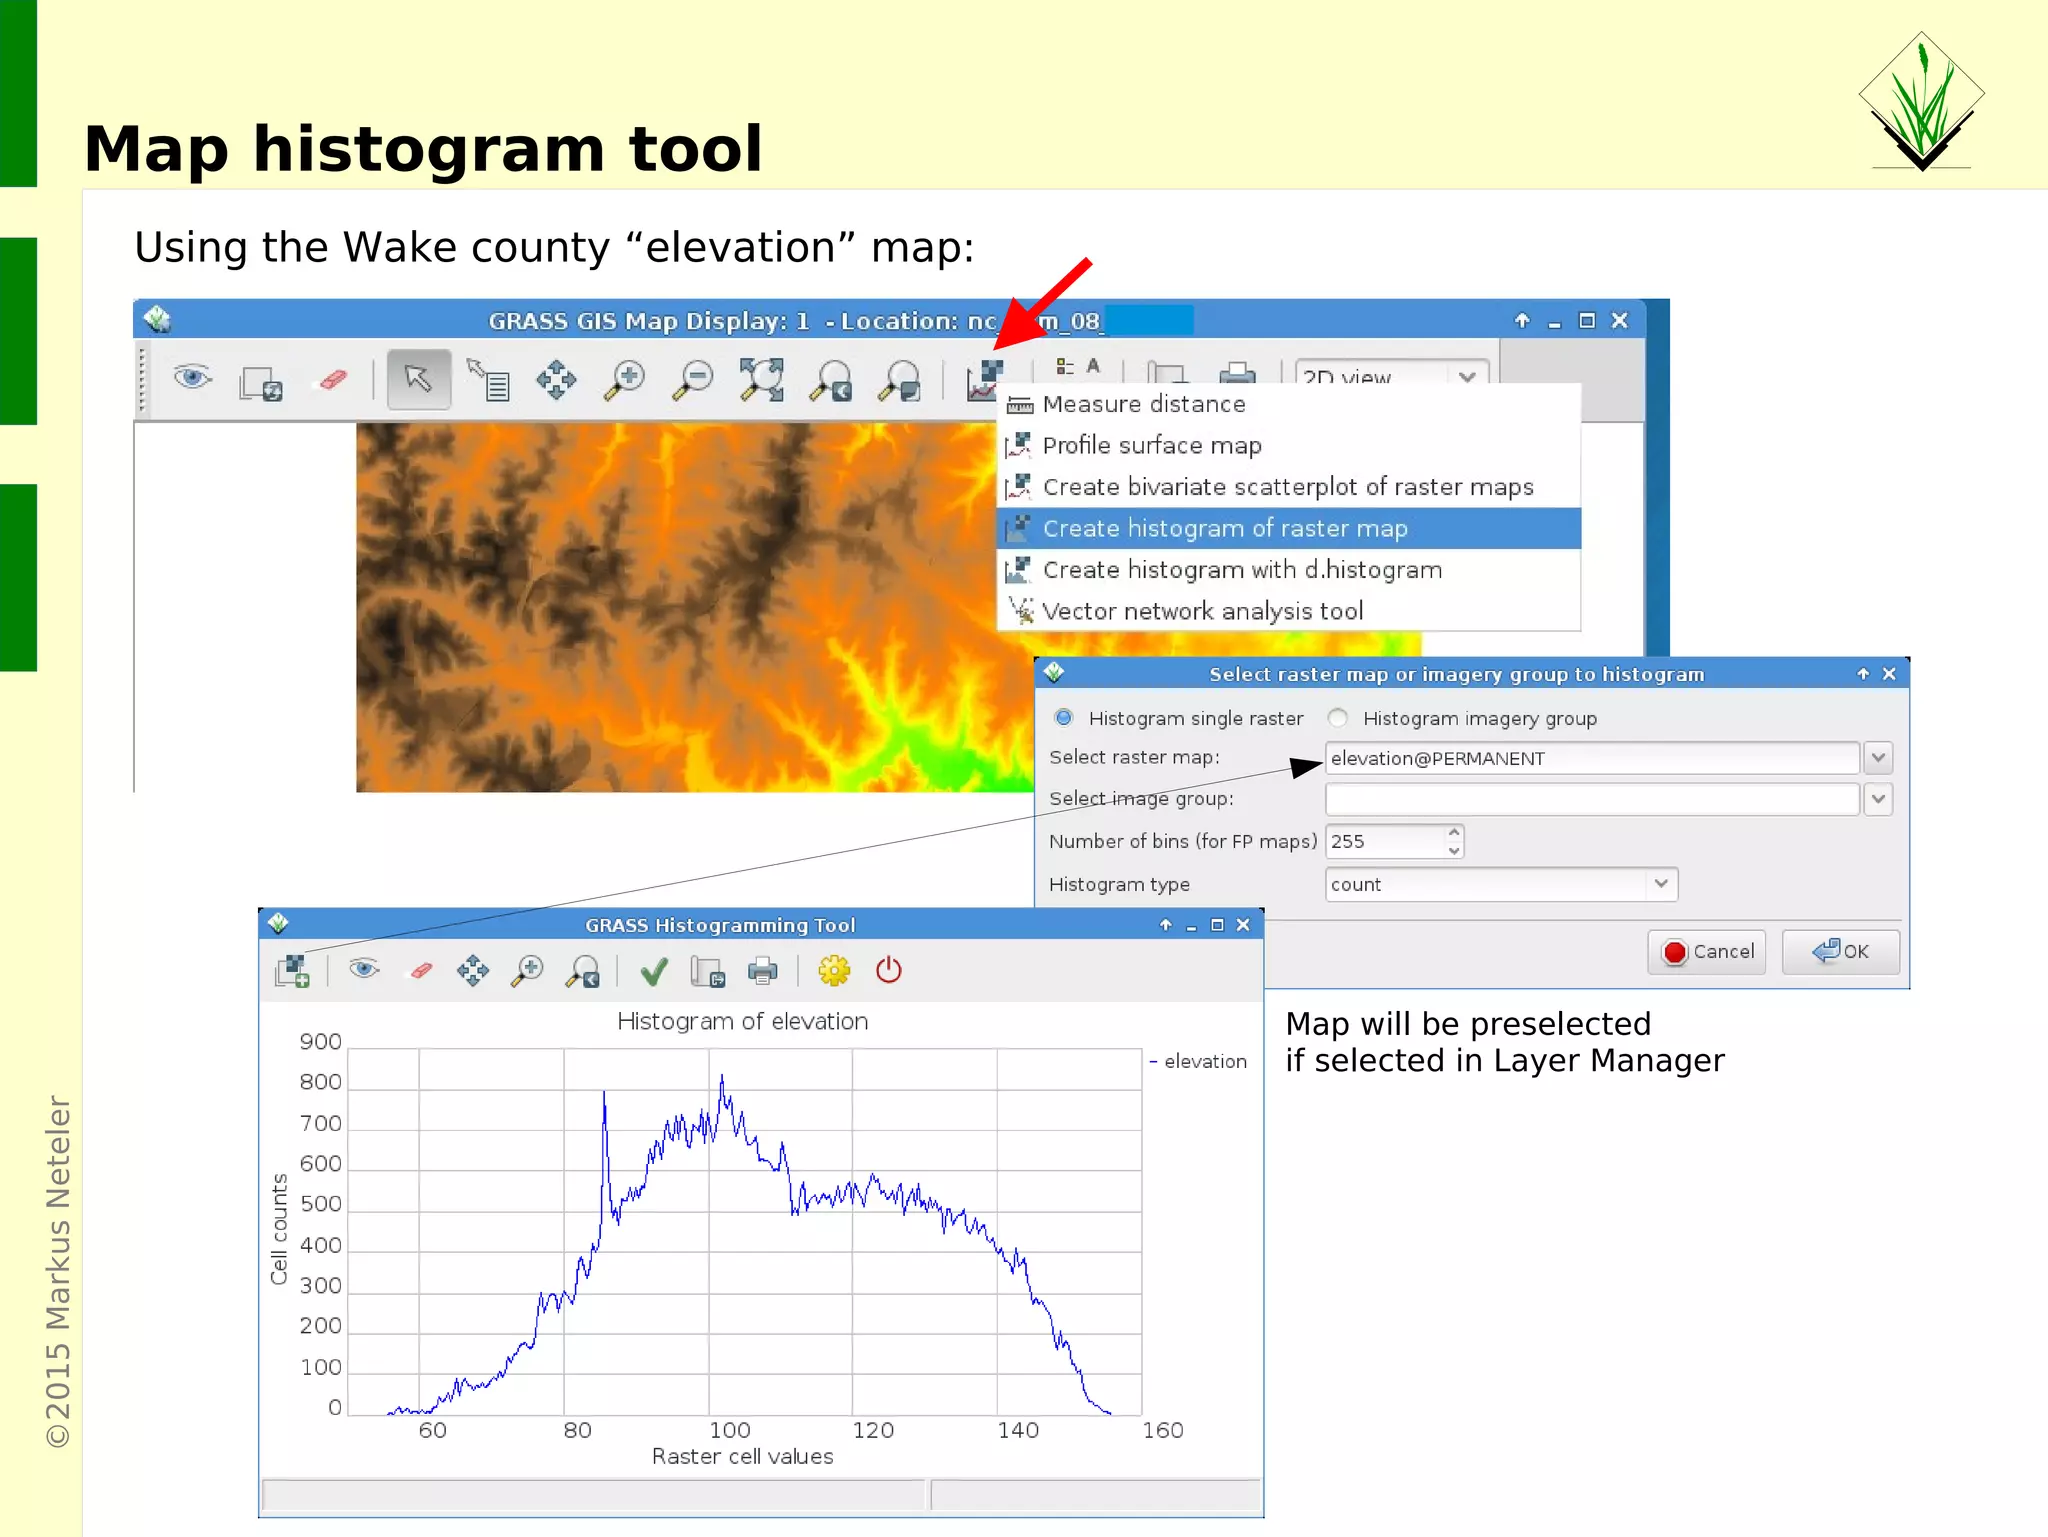
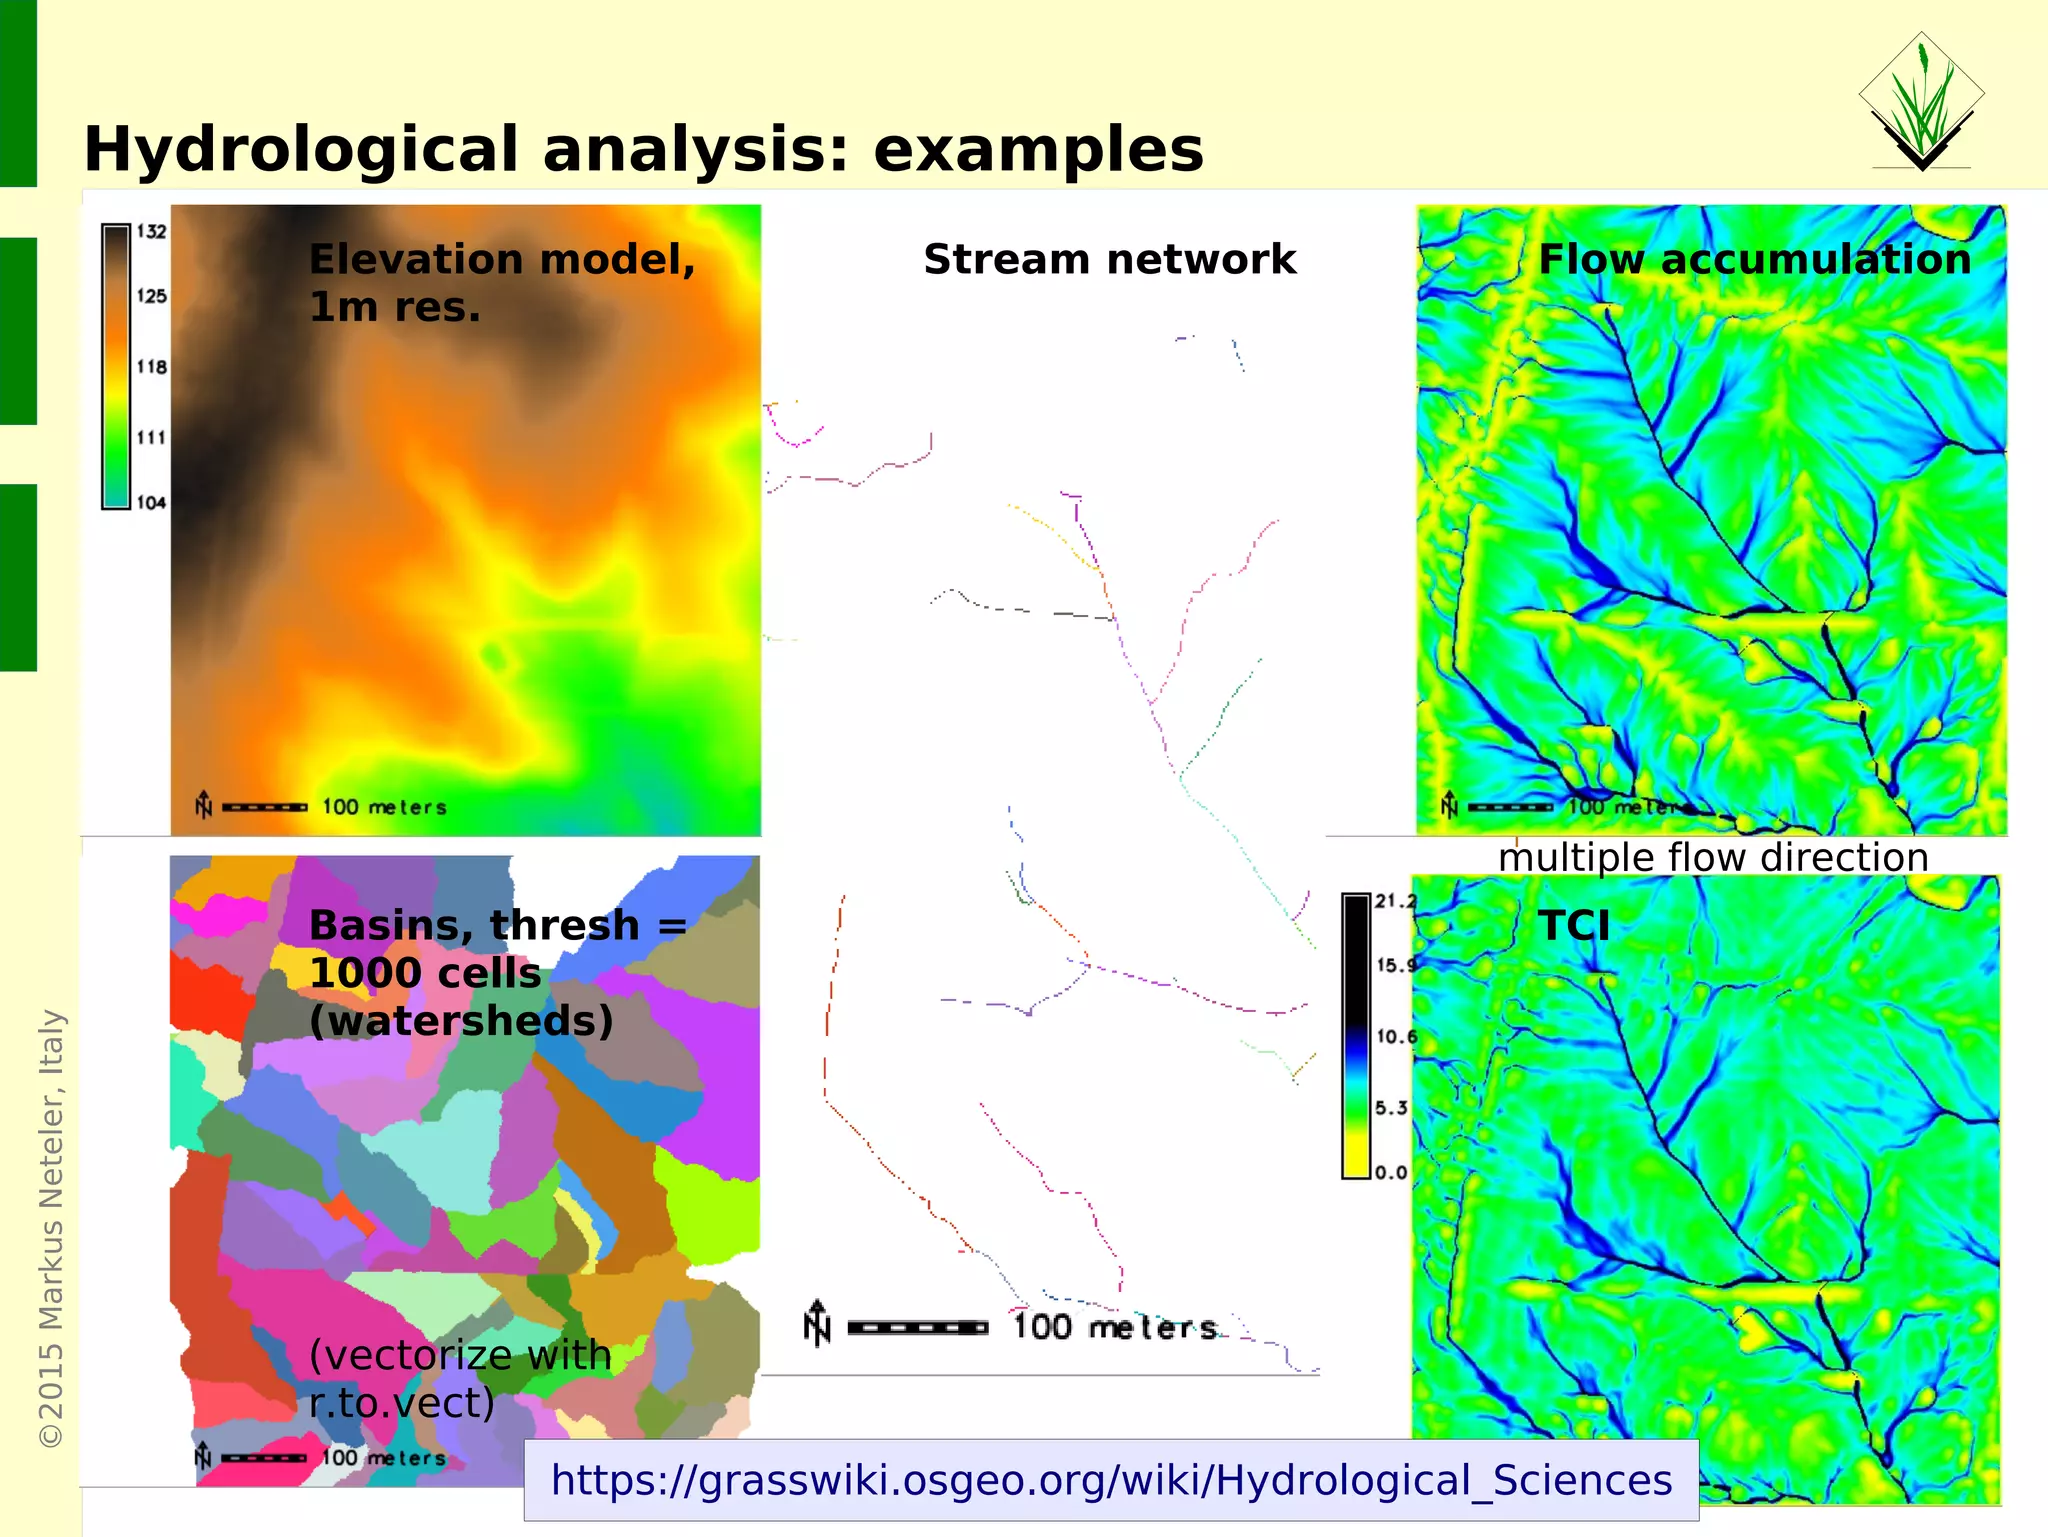
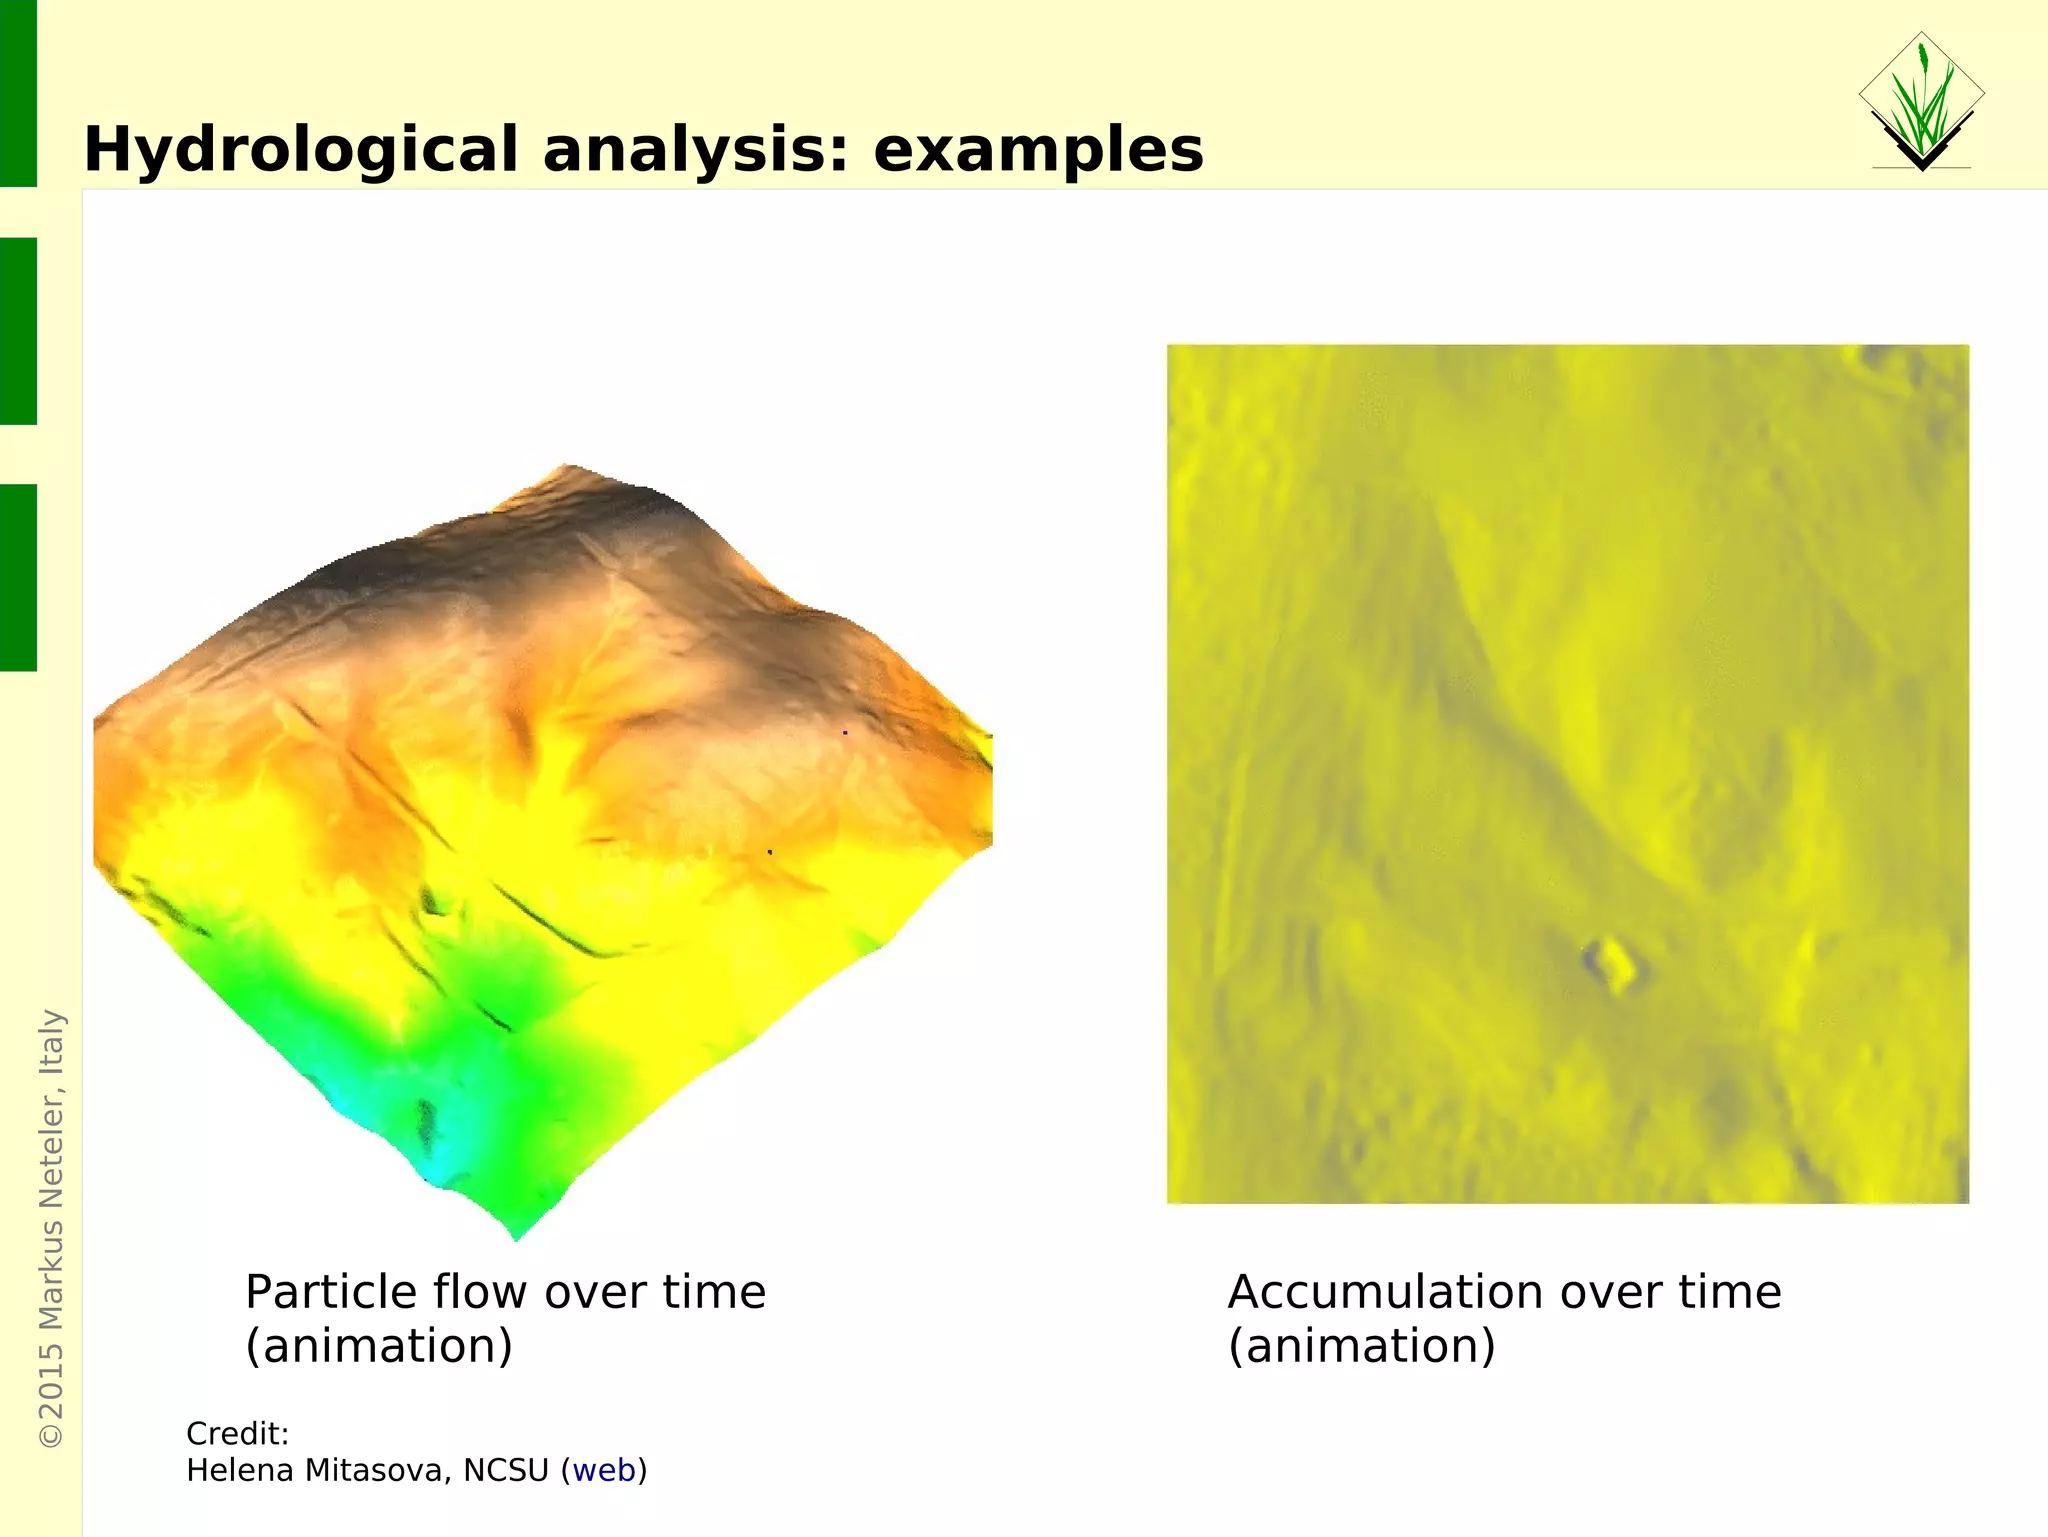
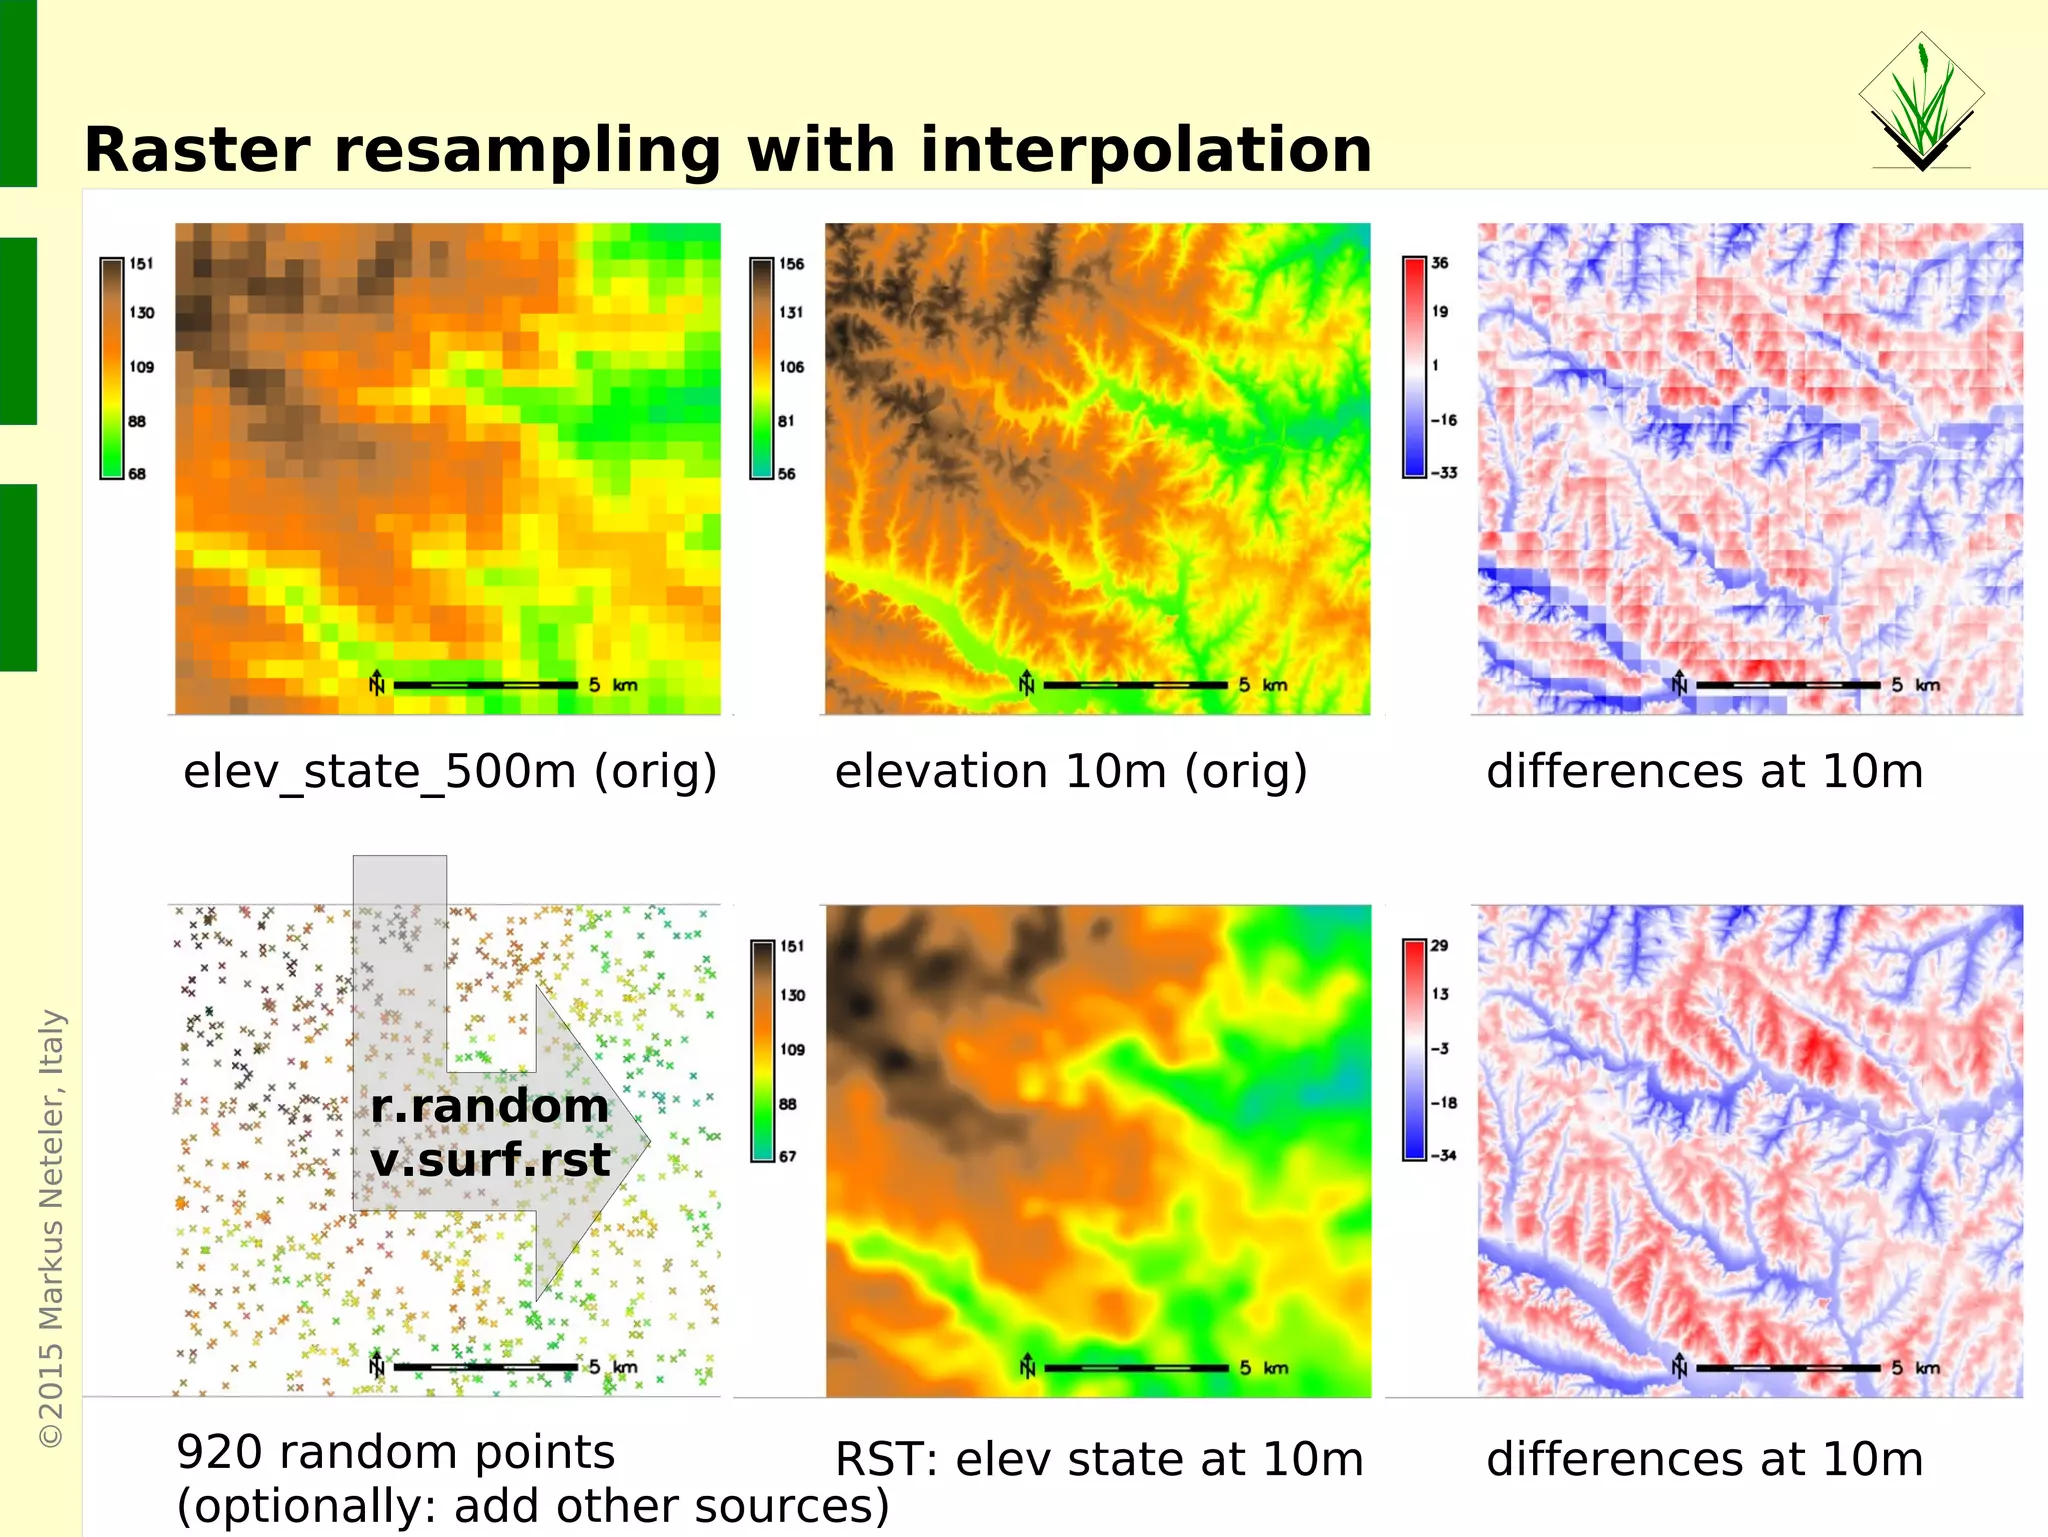
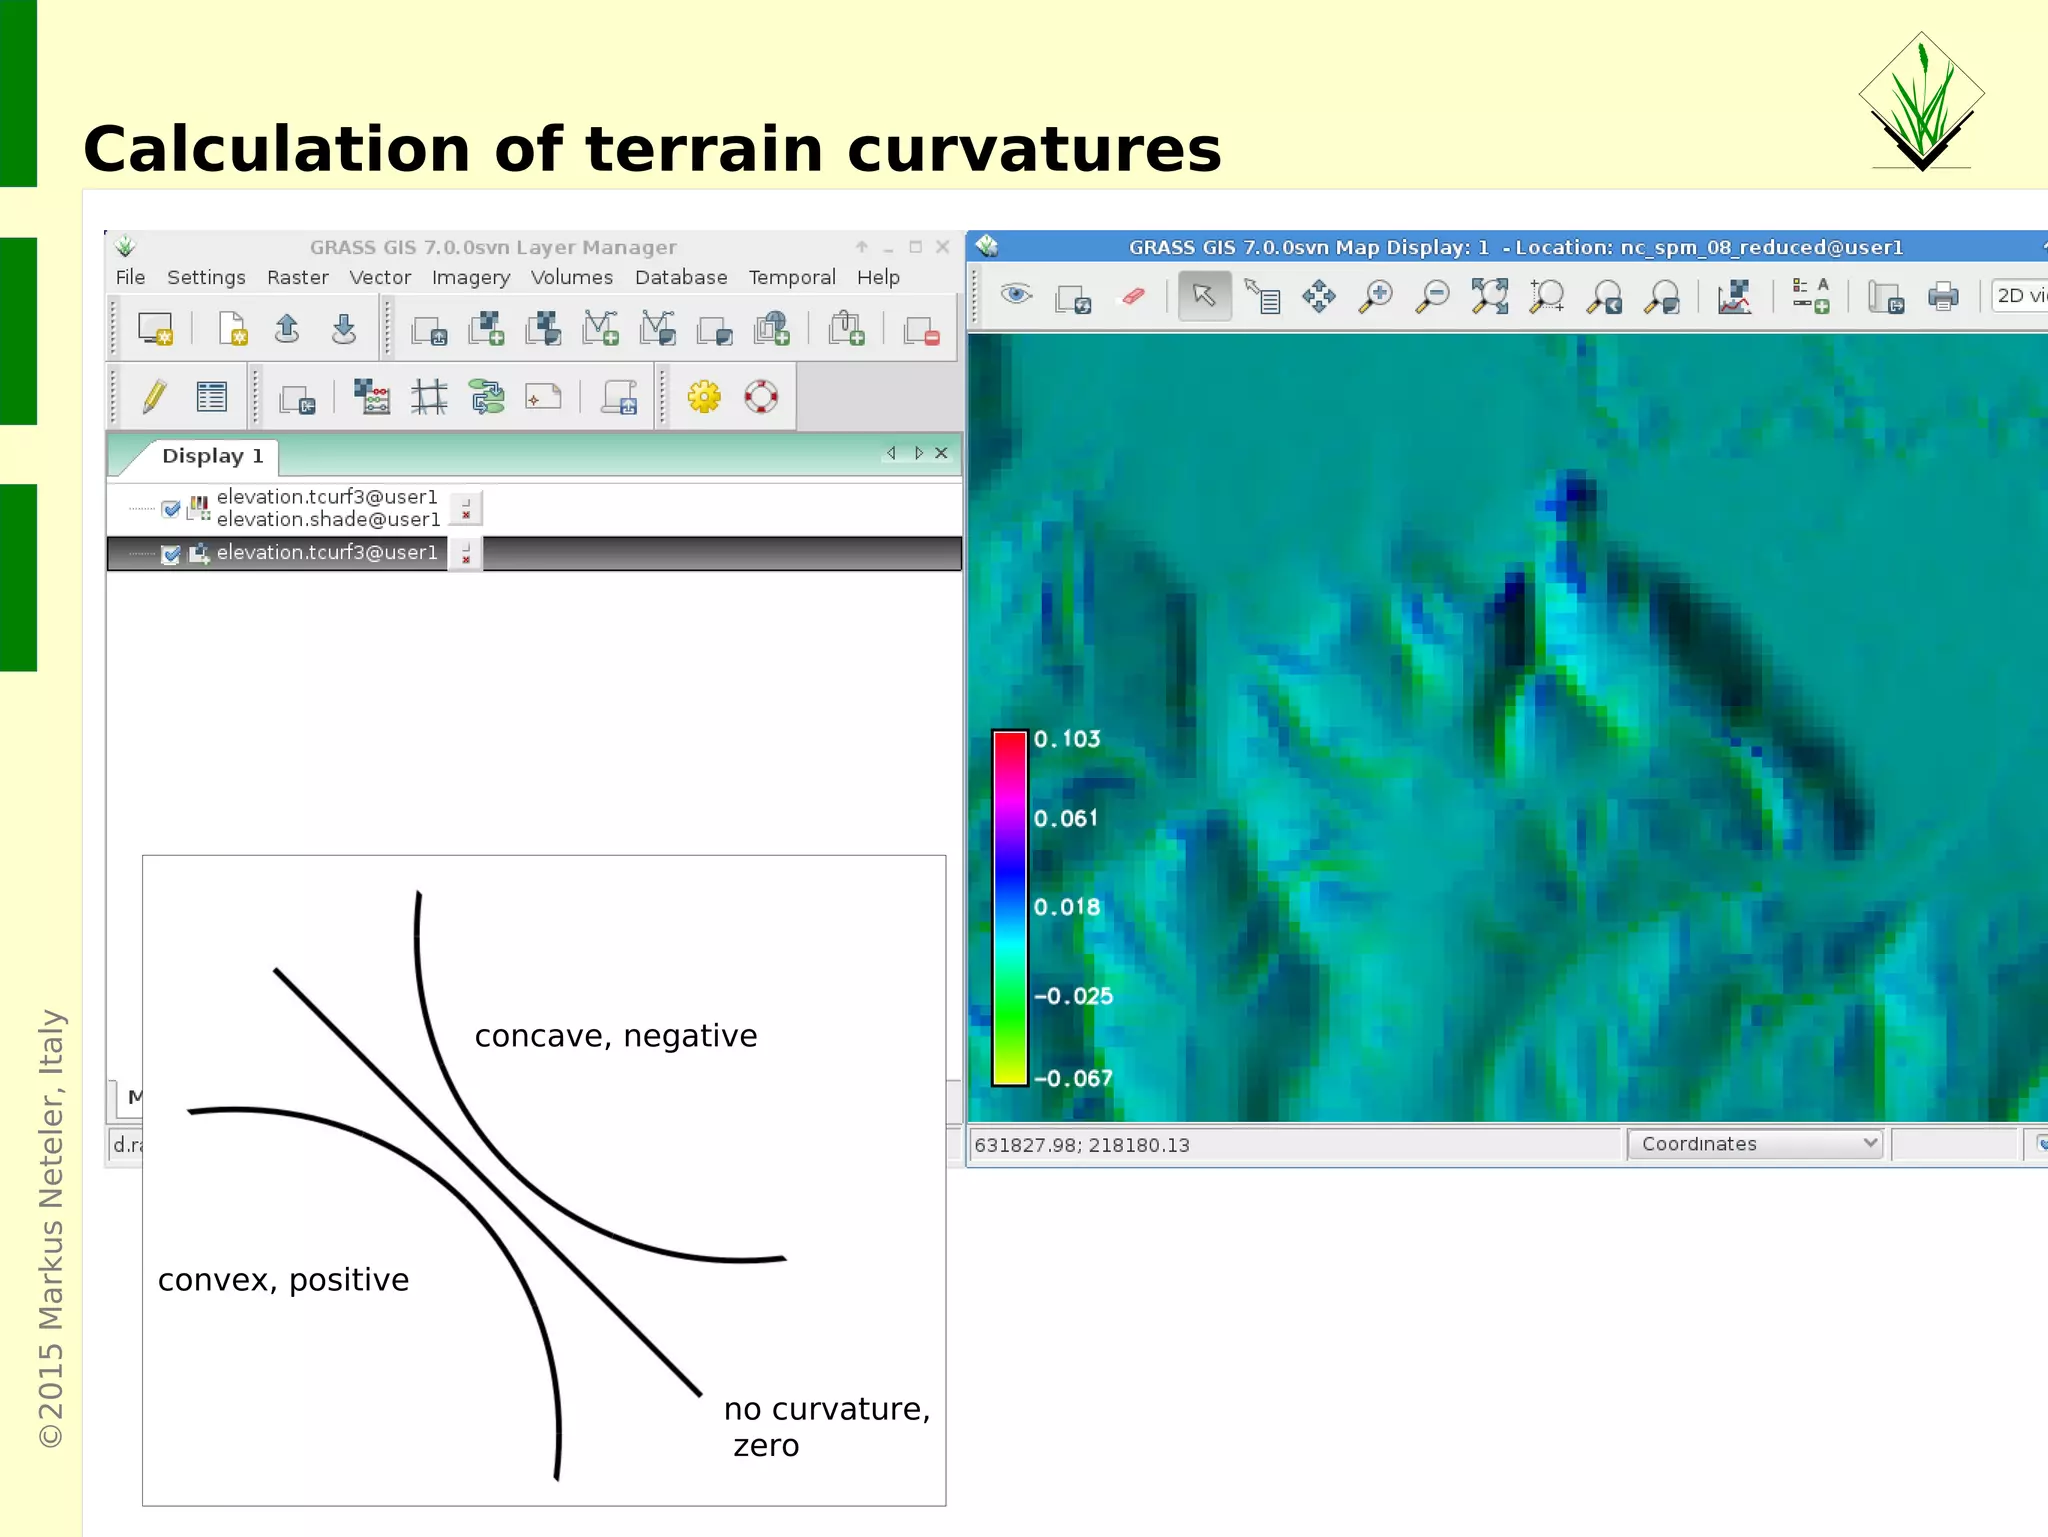
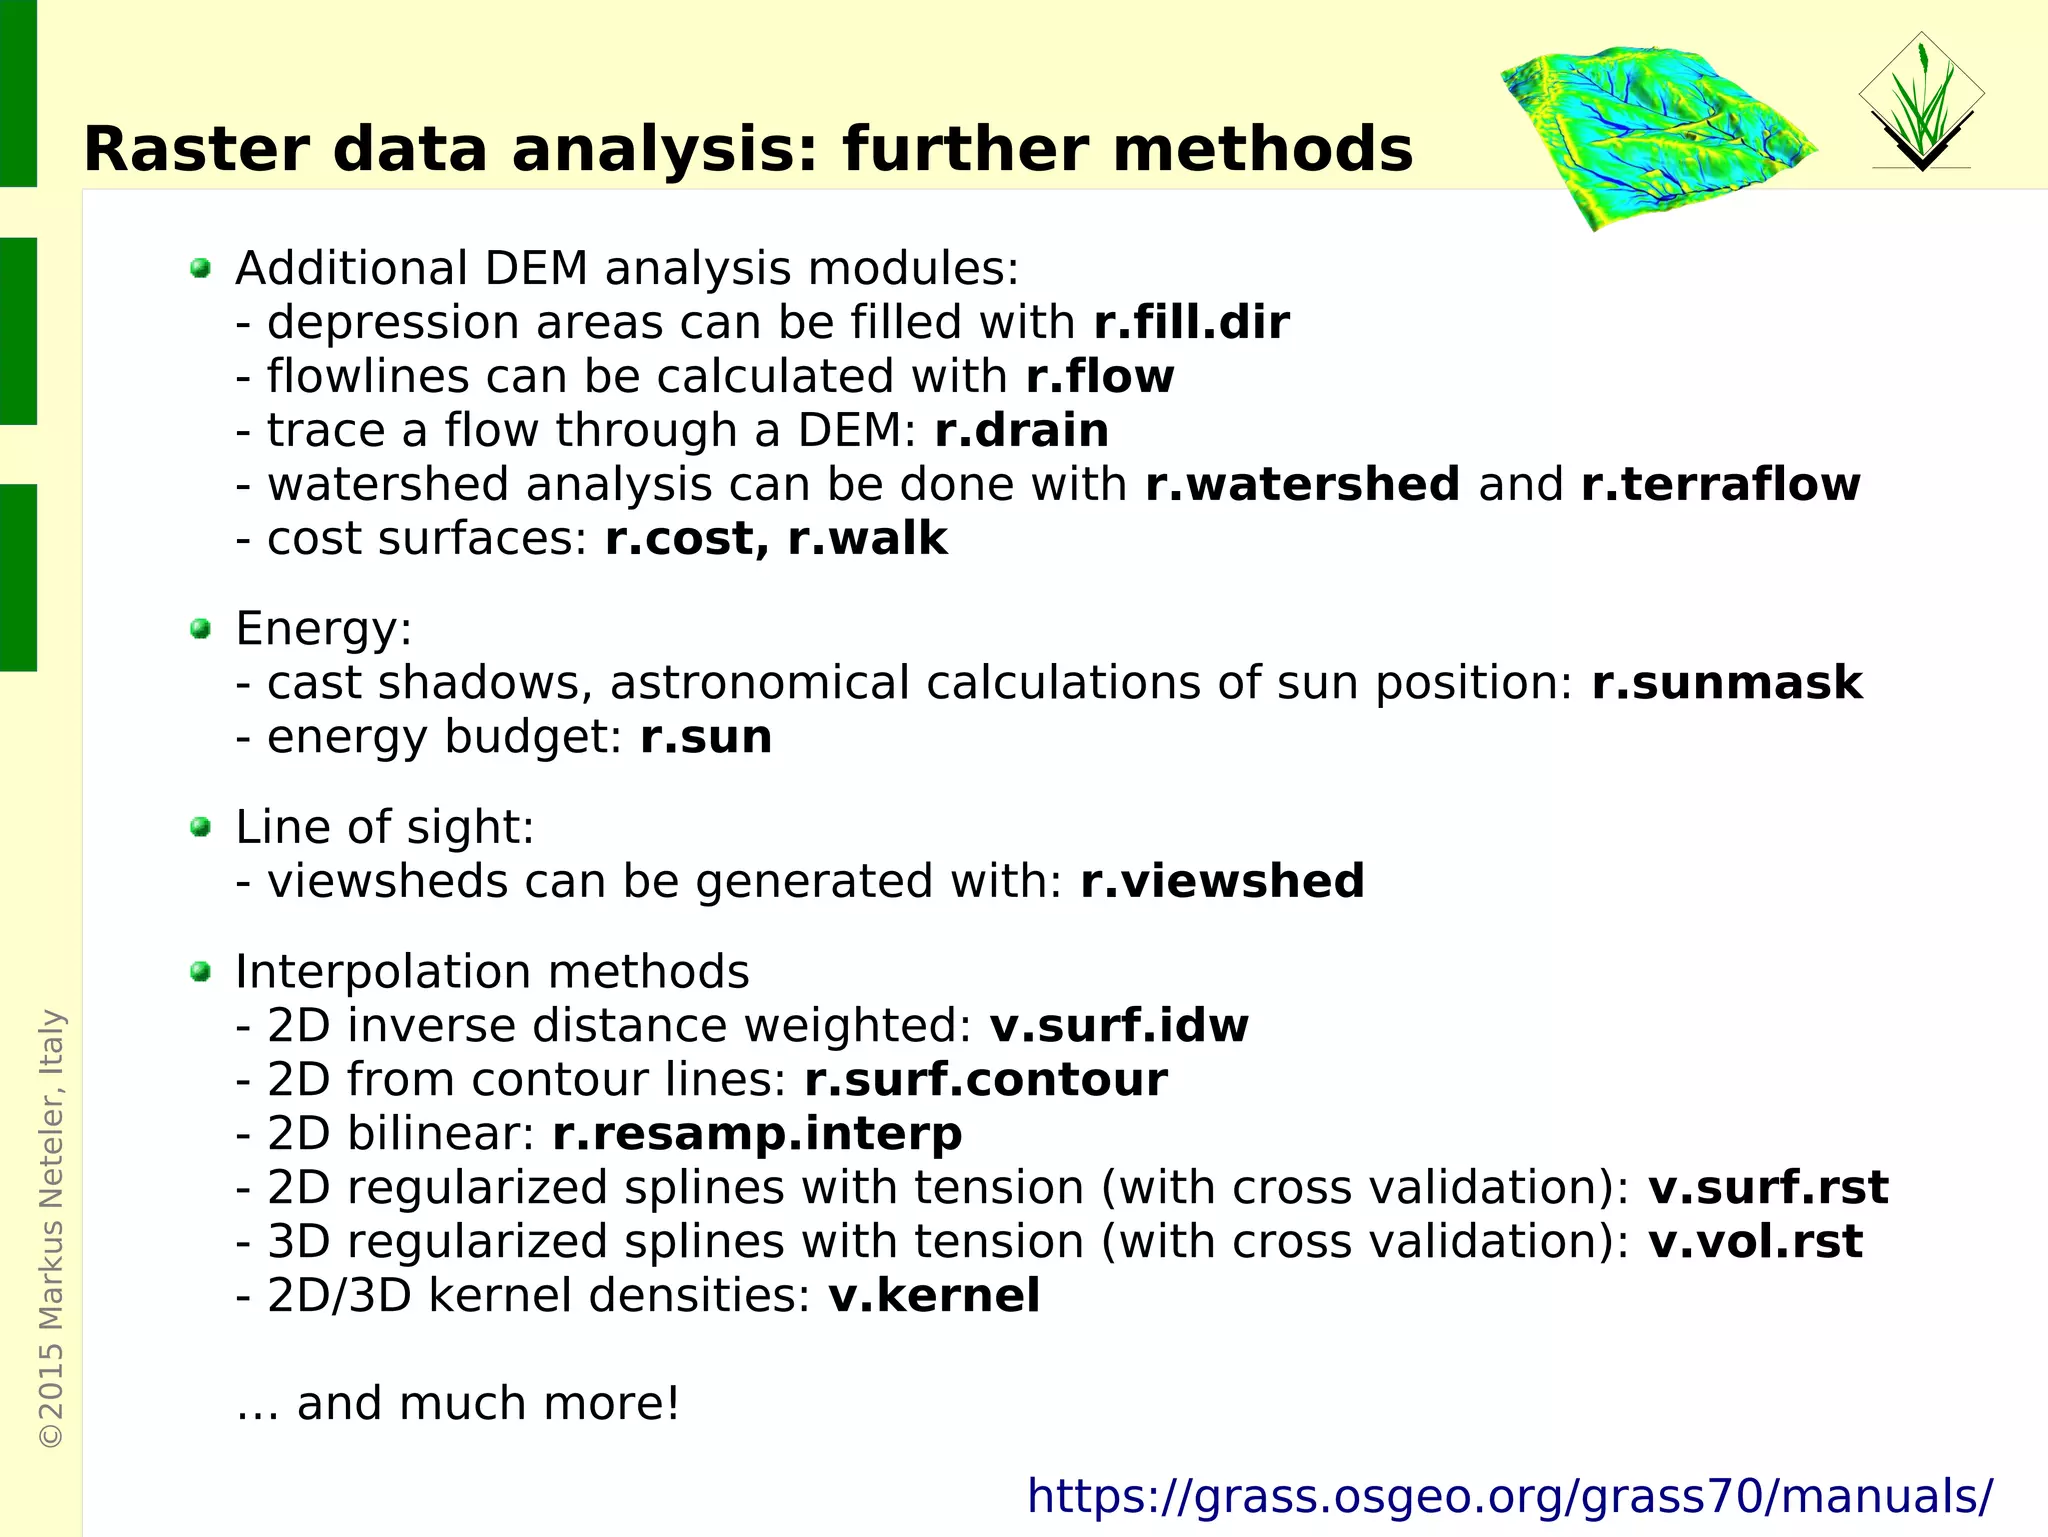
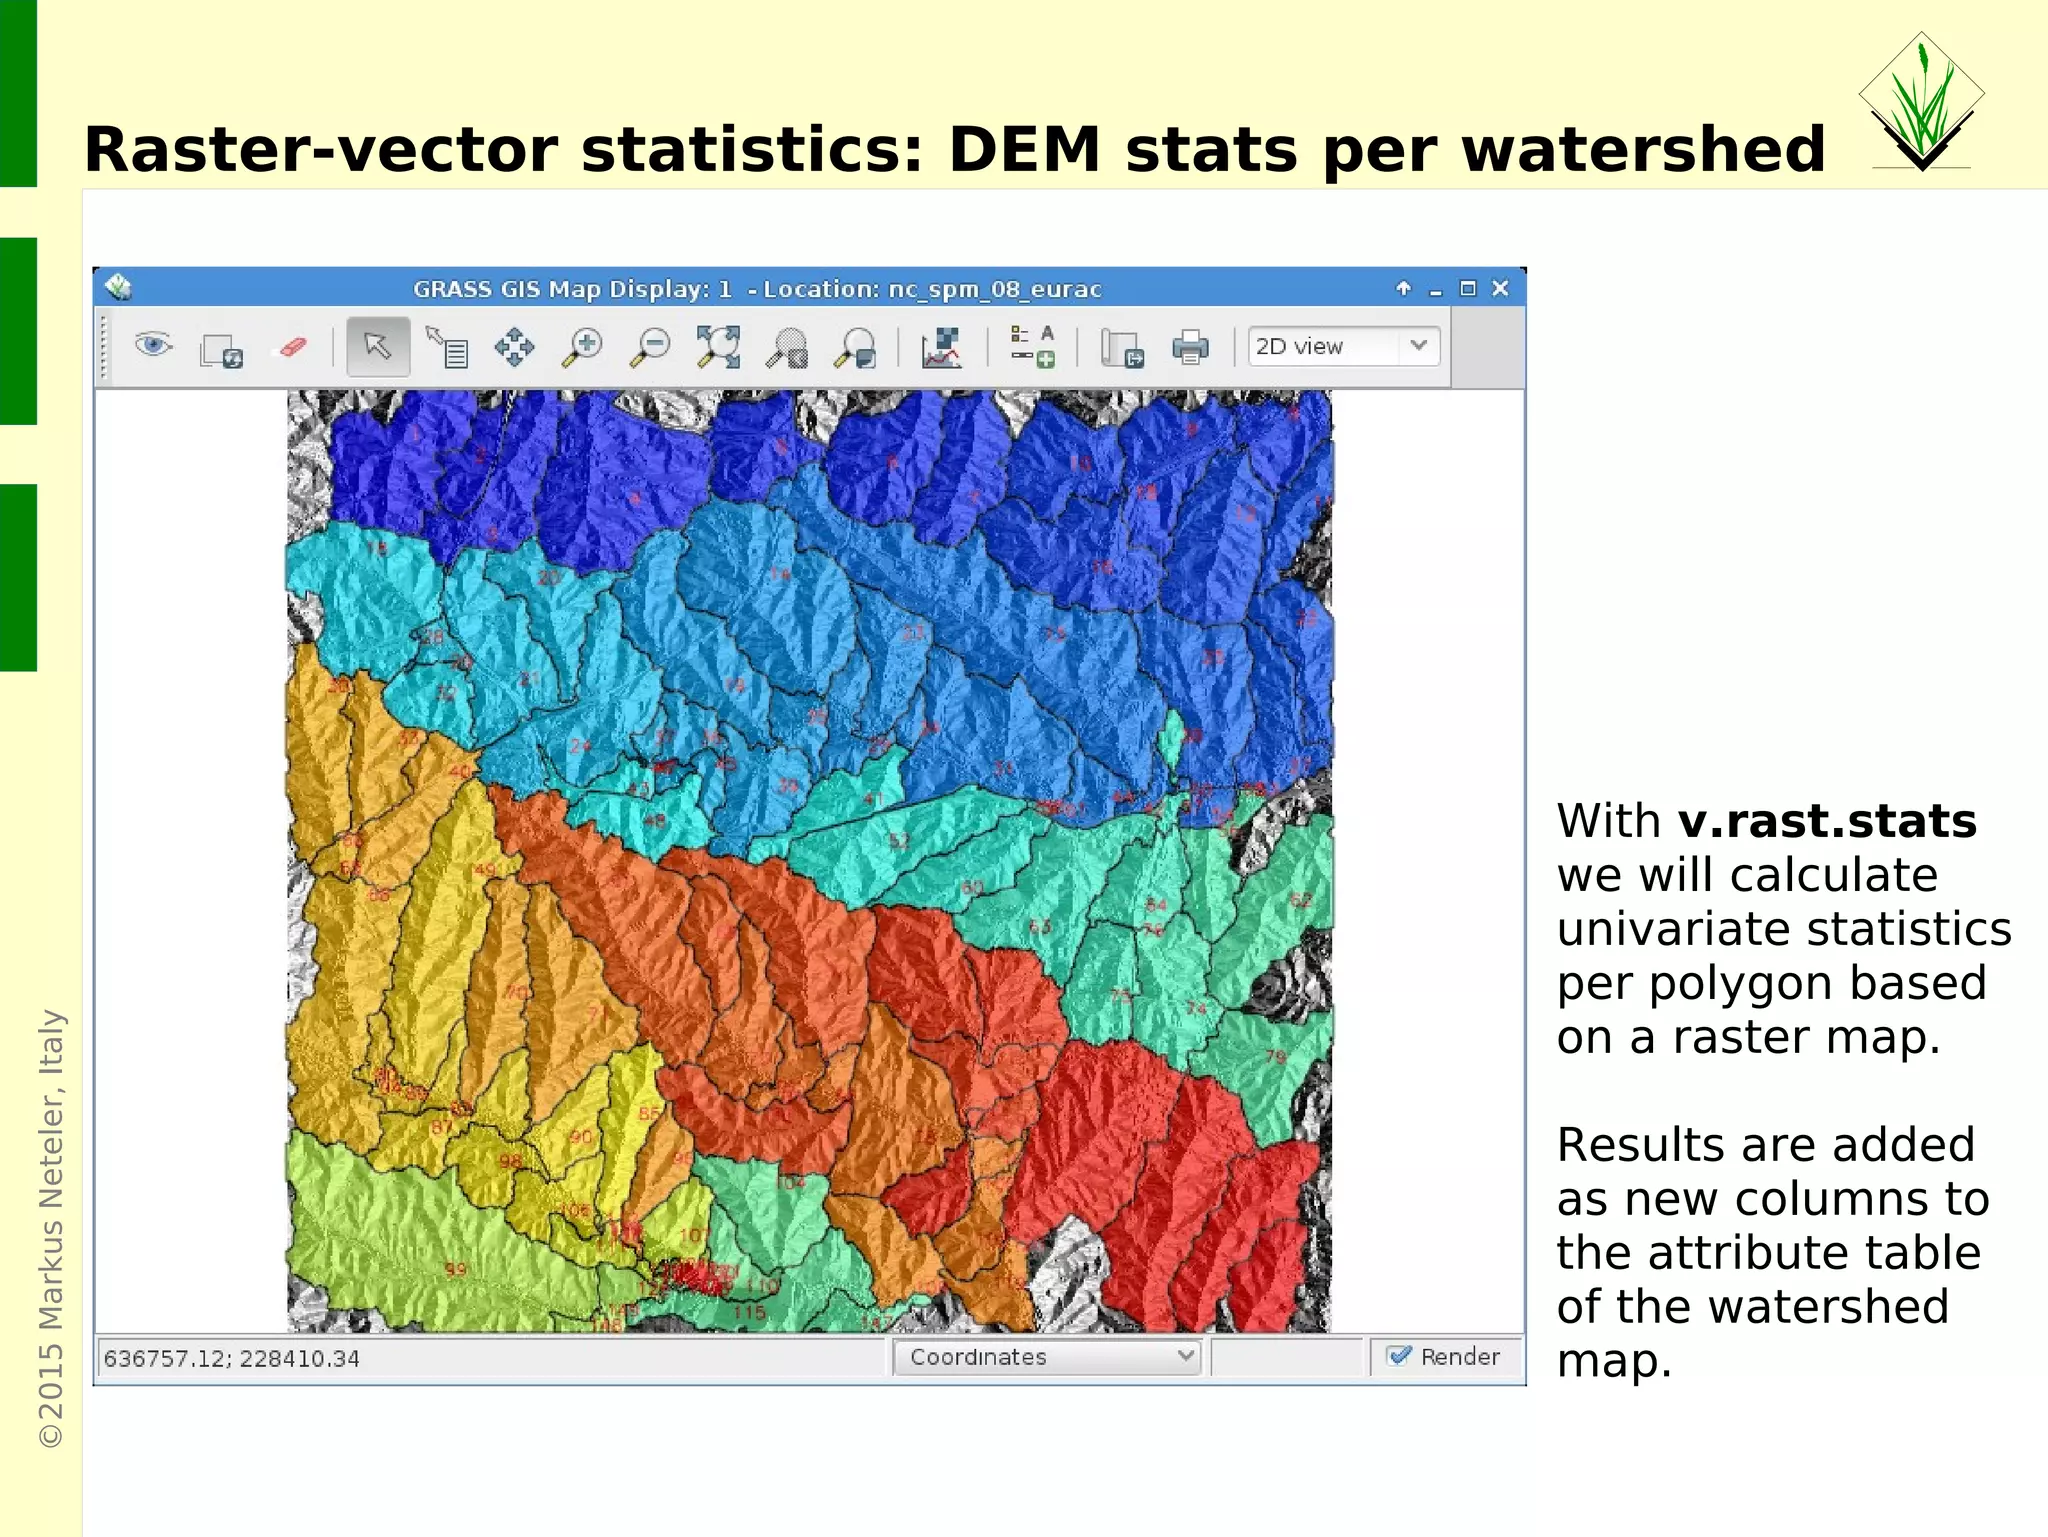
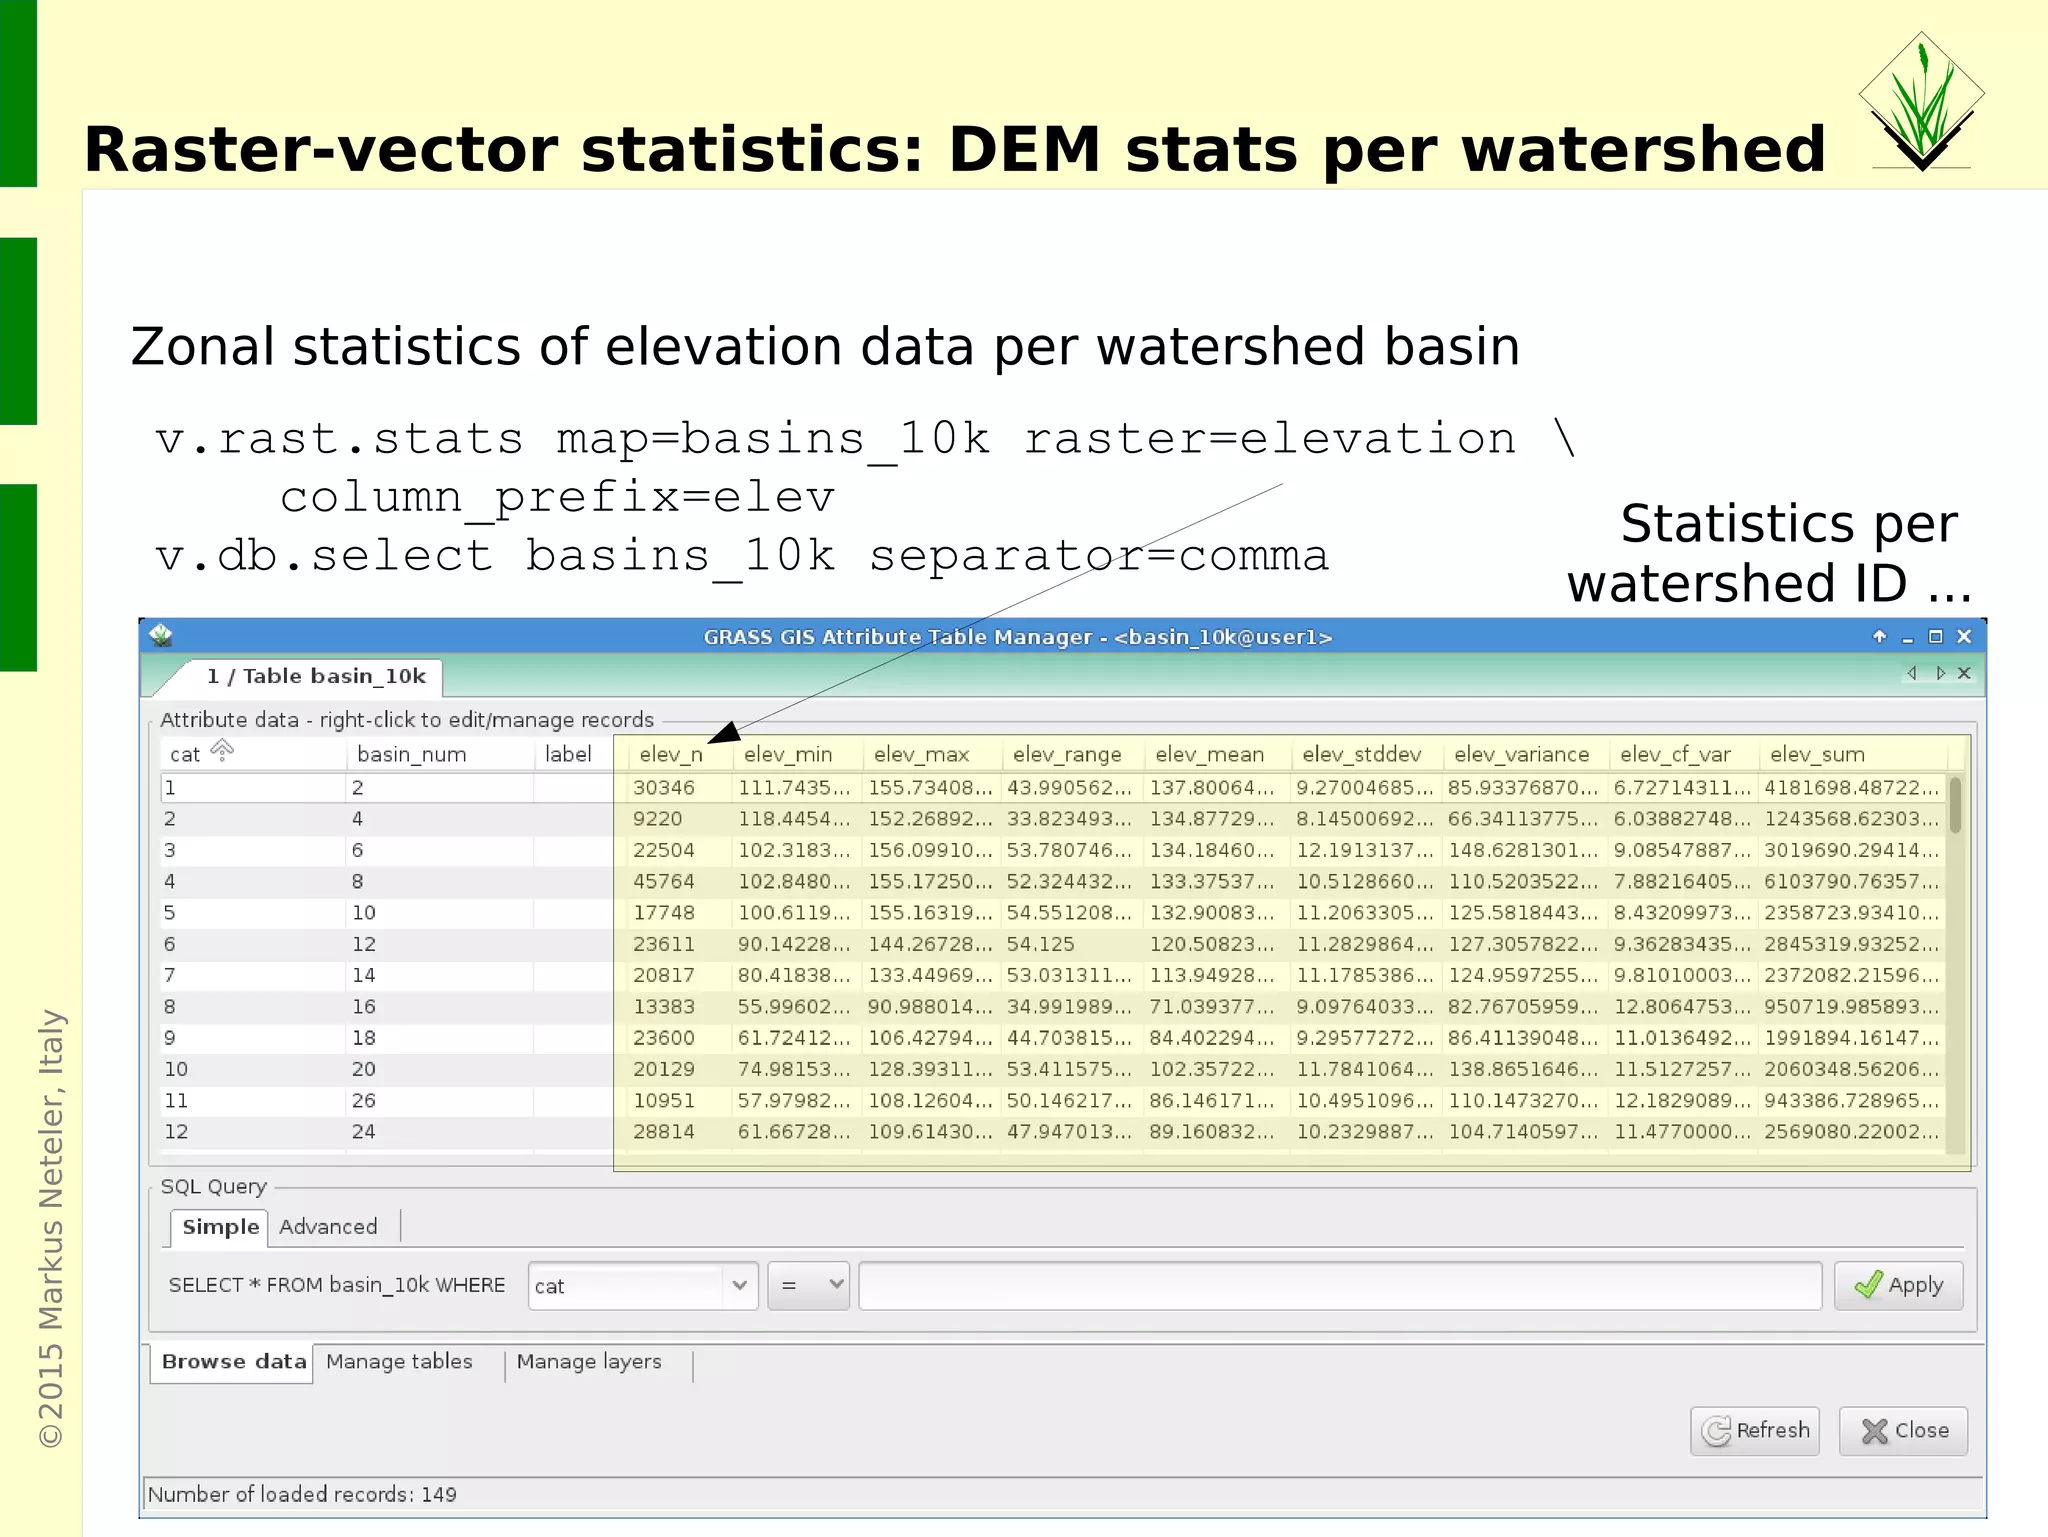
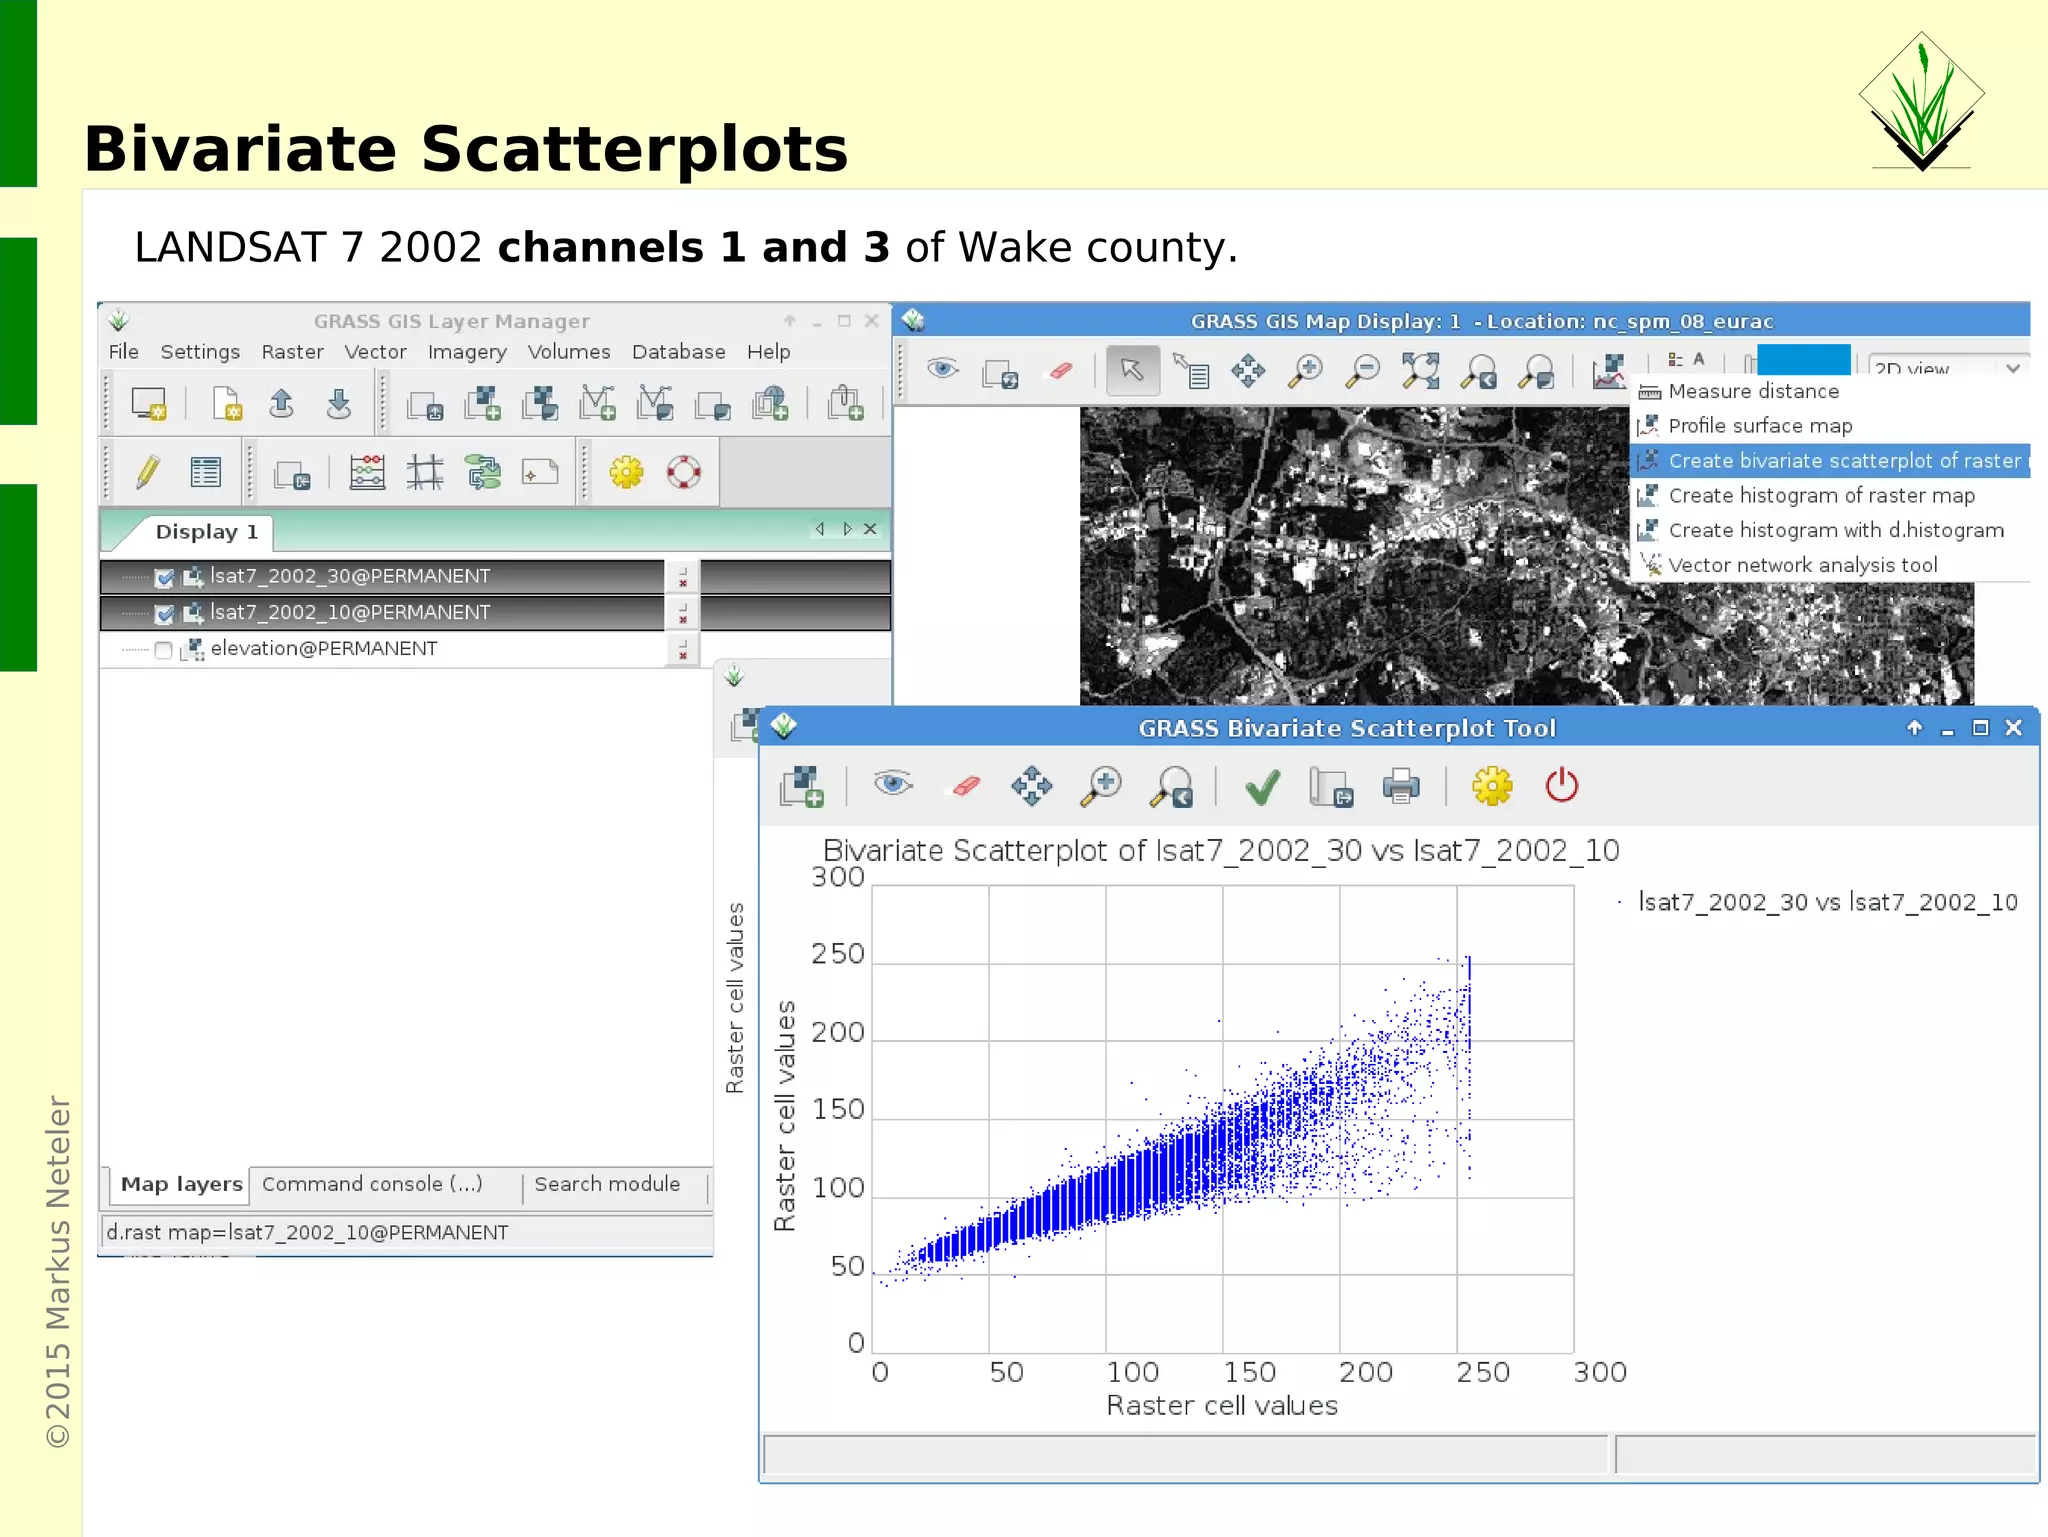
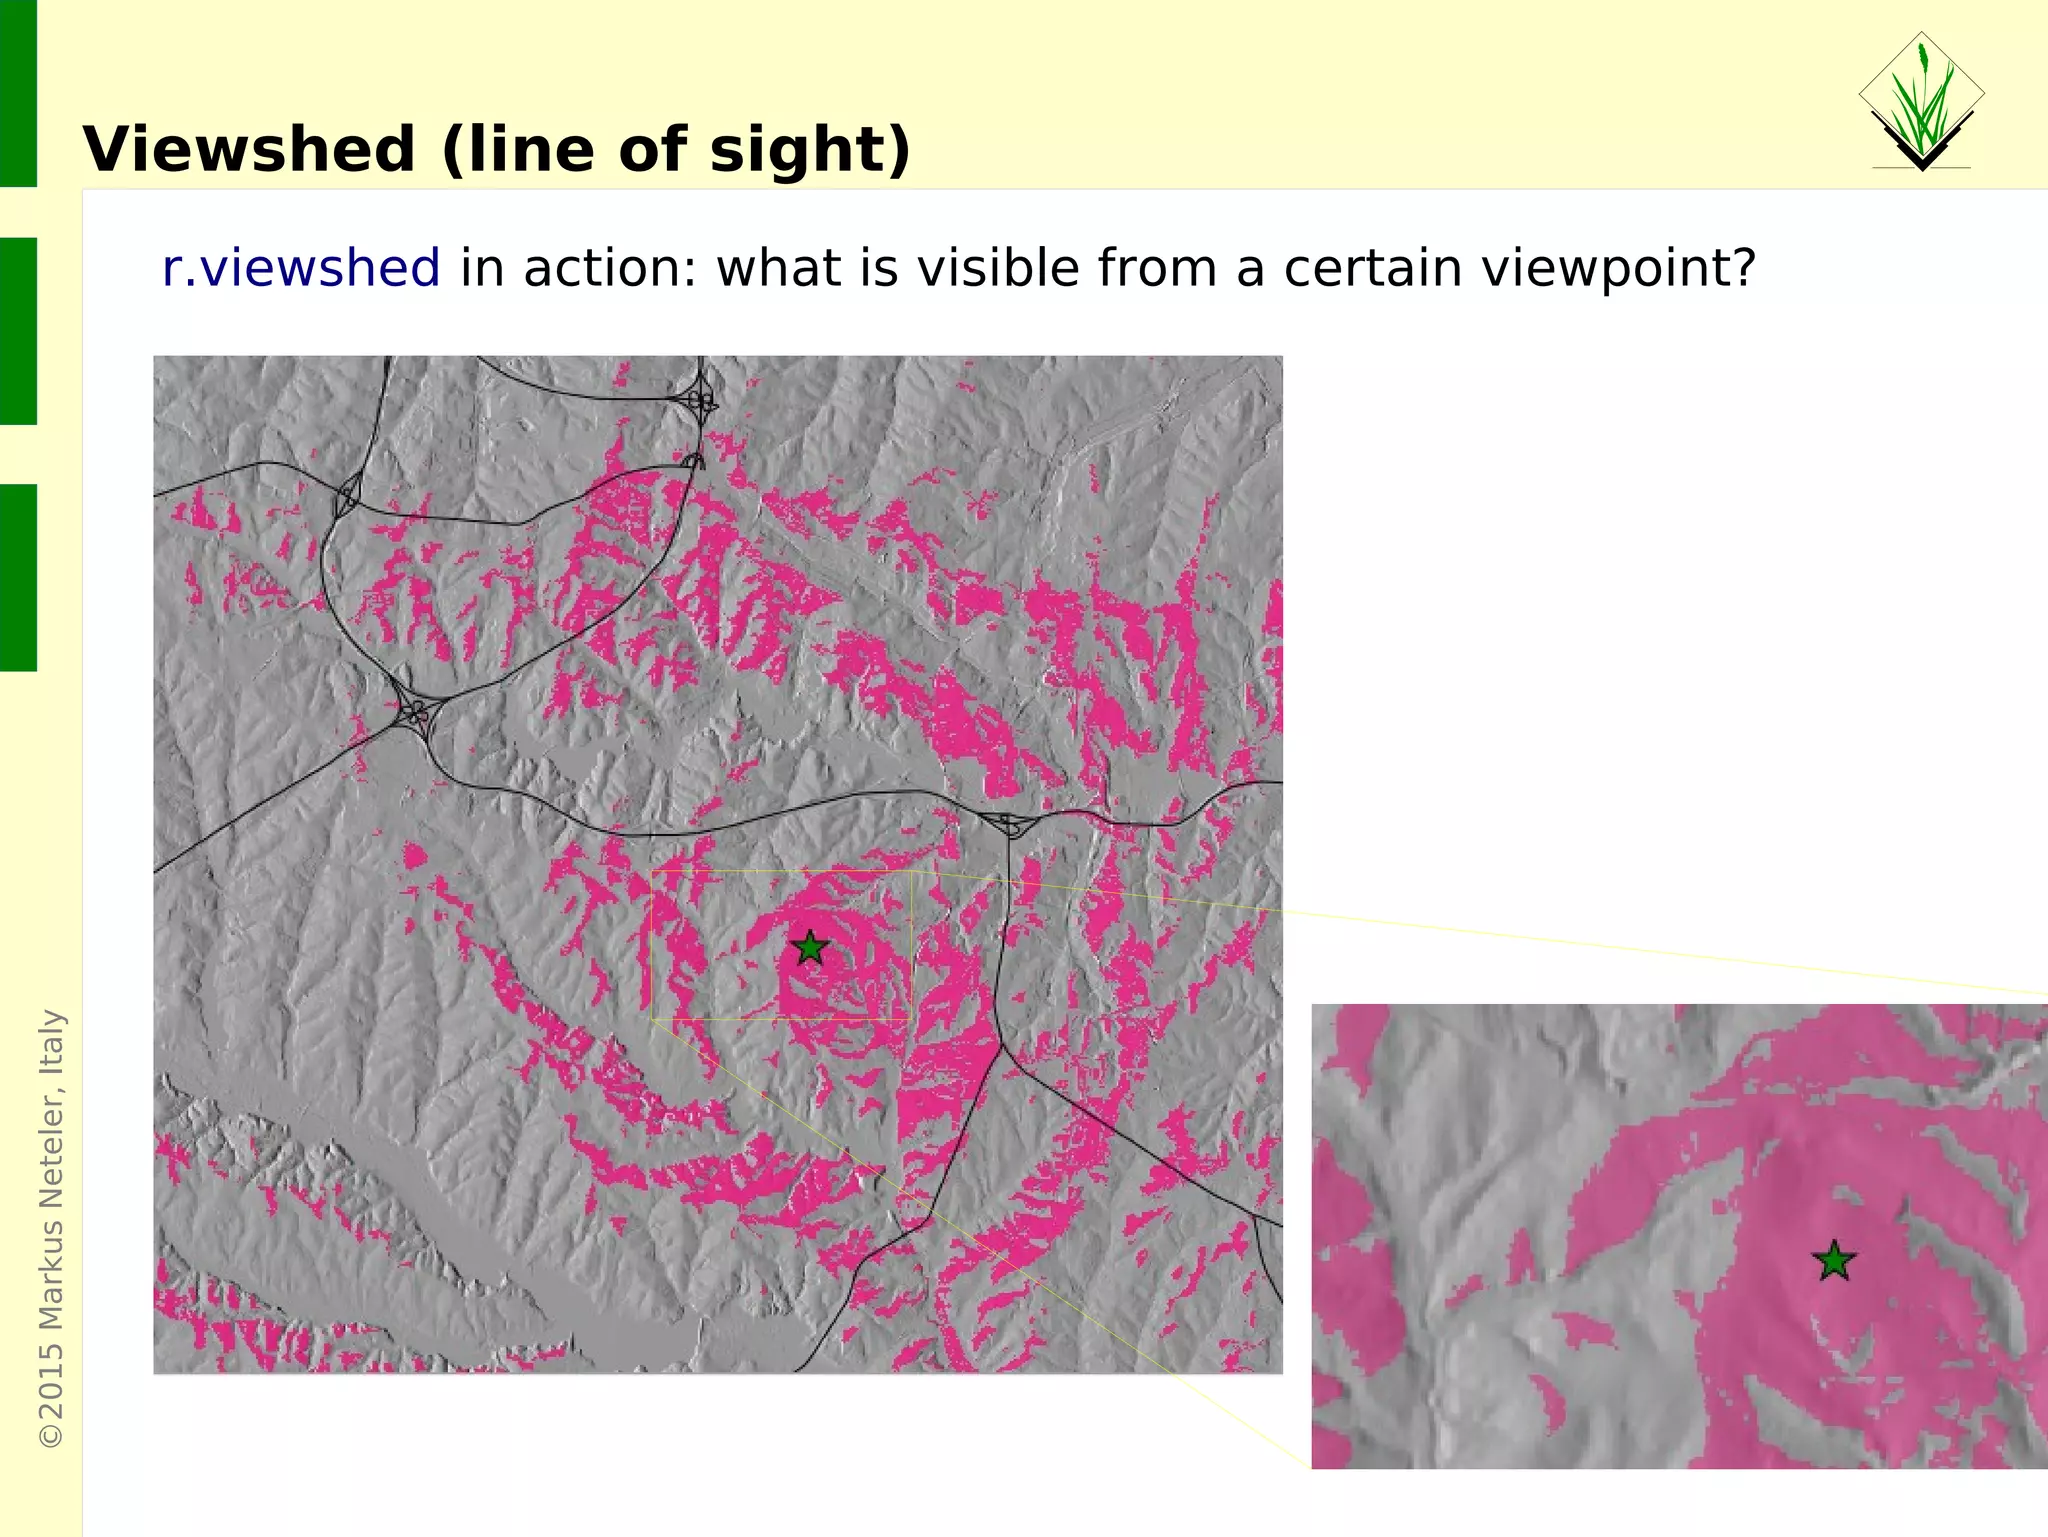
Methods for analyzing raster data, including terrain analysis and statistics computation via v.rast.stats for watershed analysis.
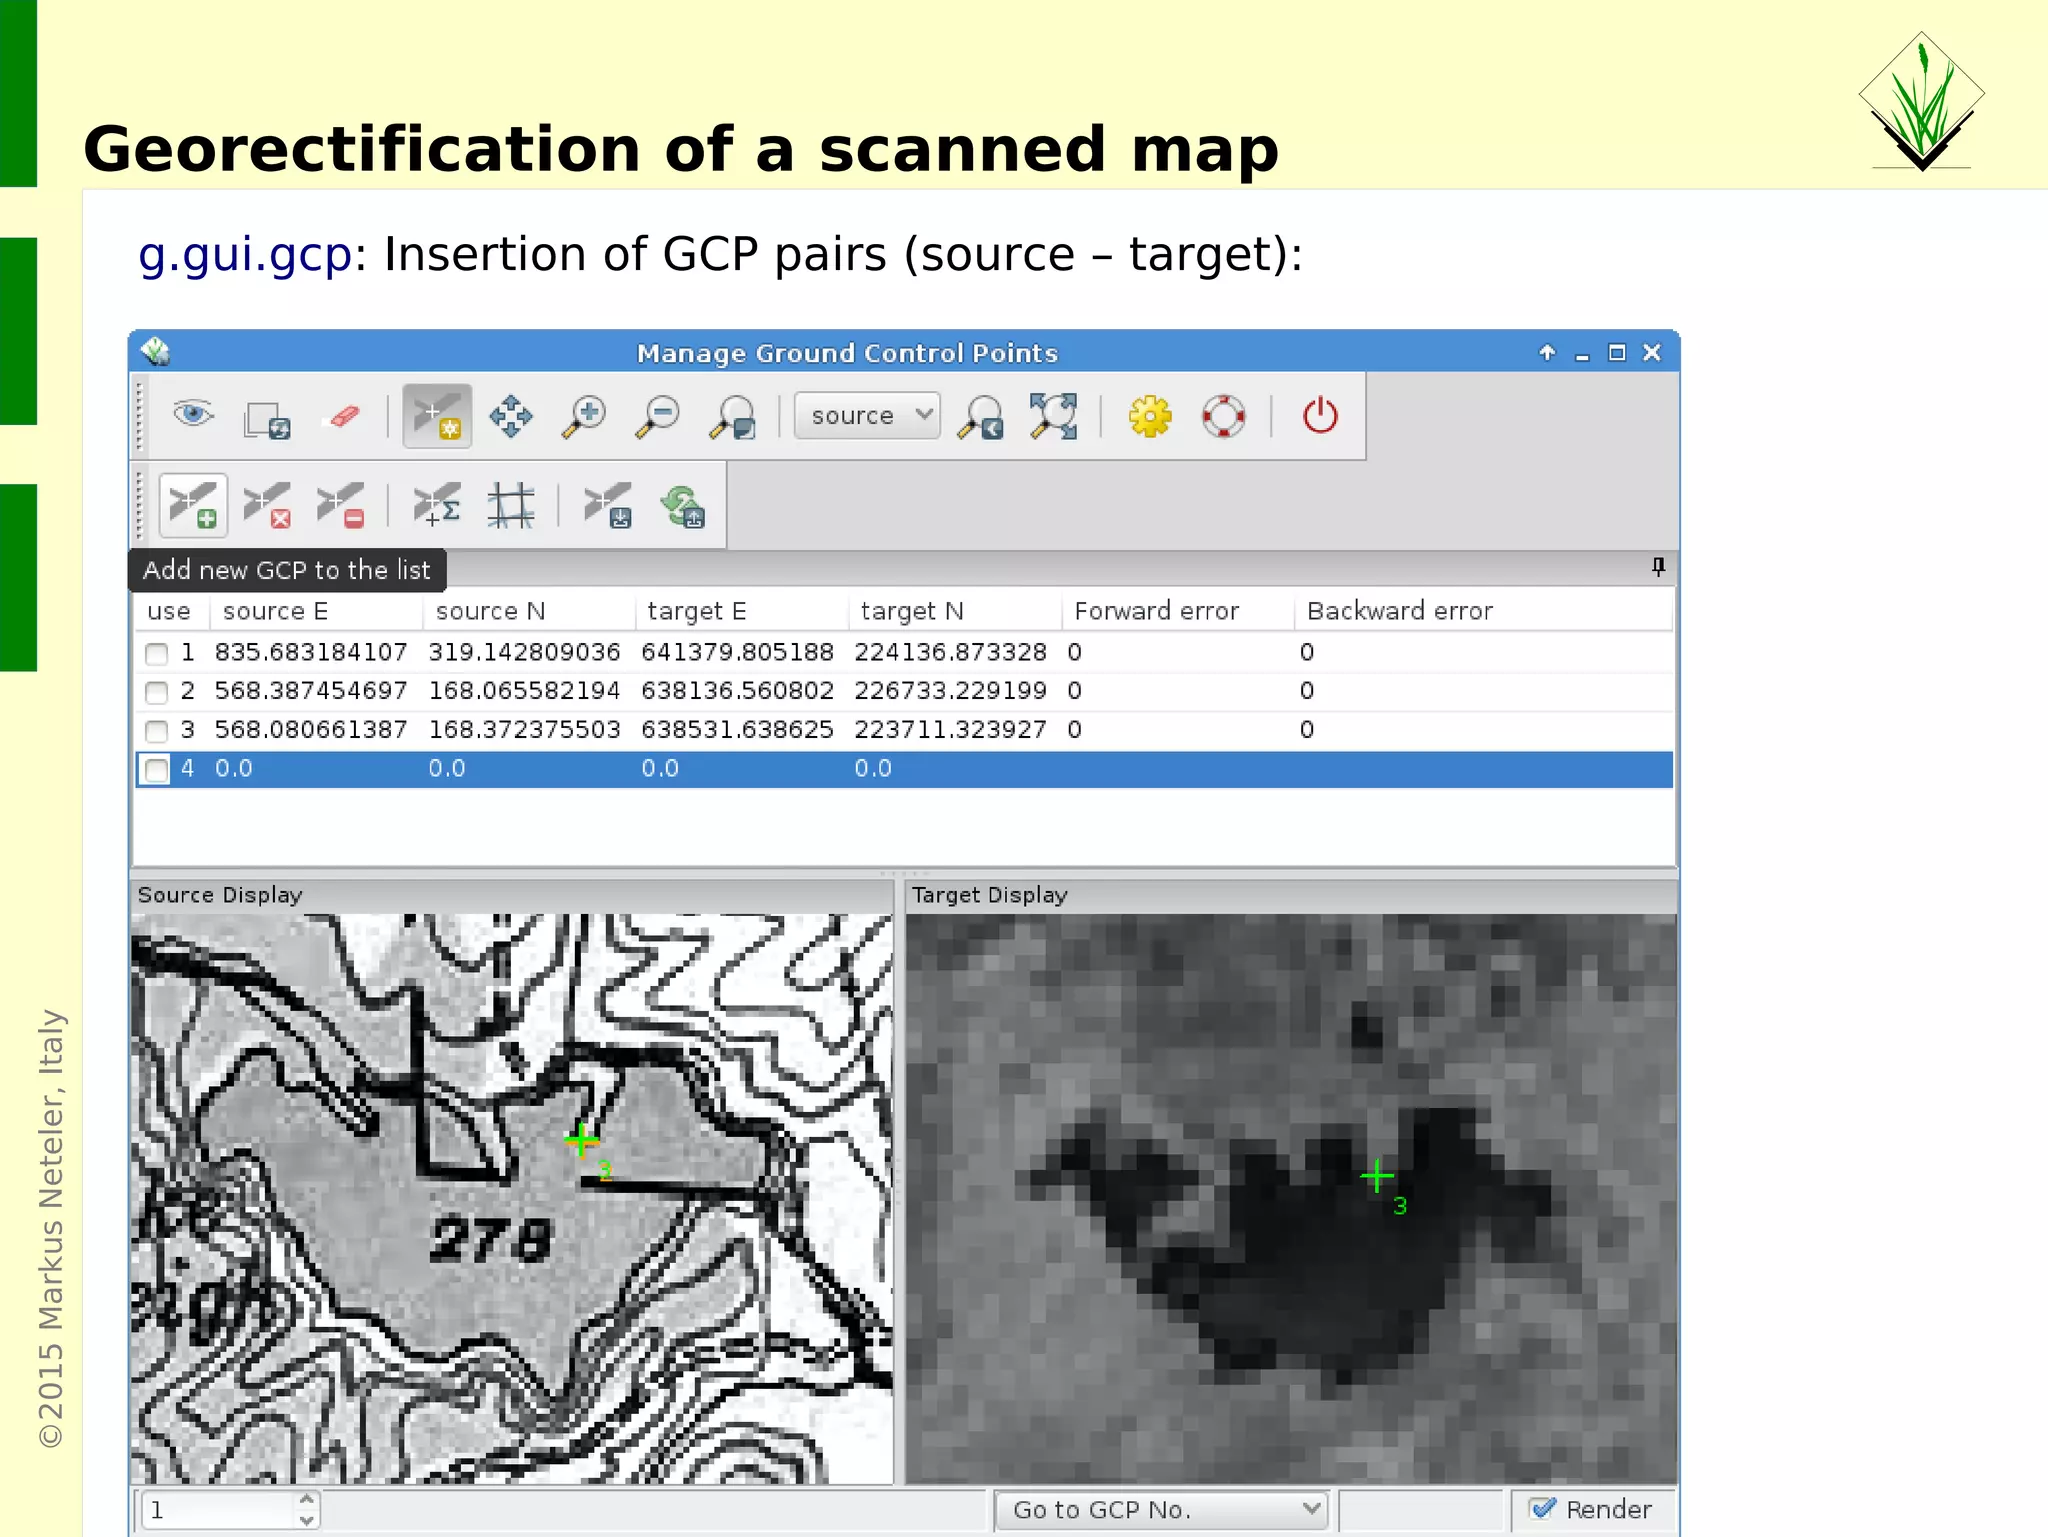
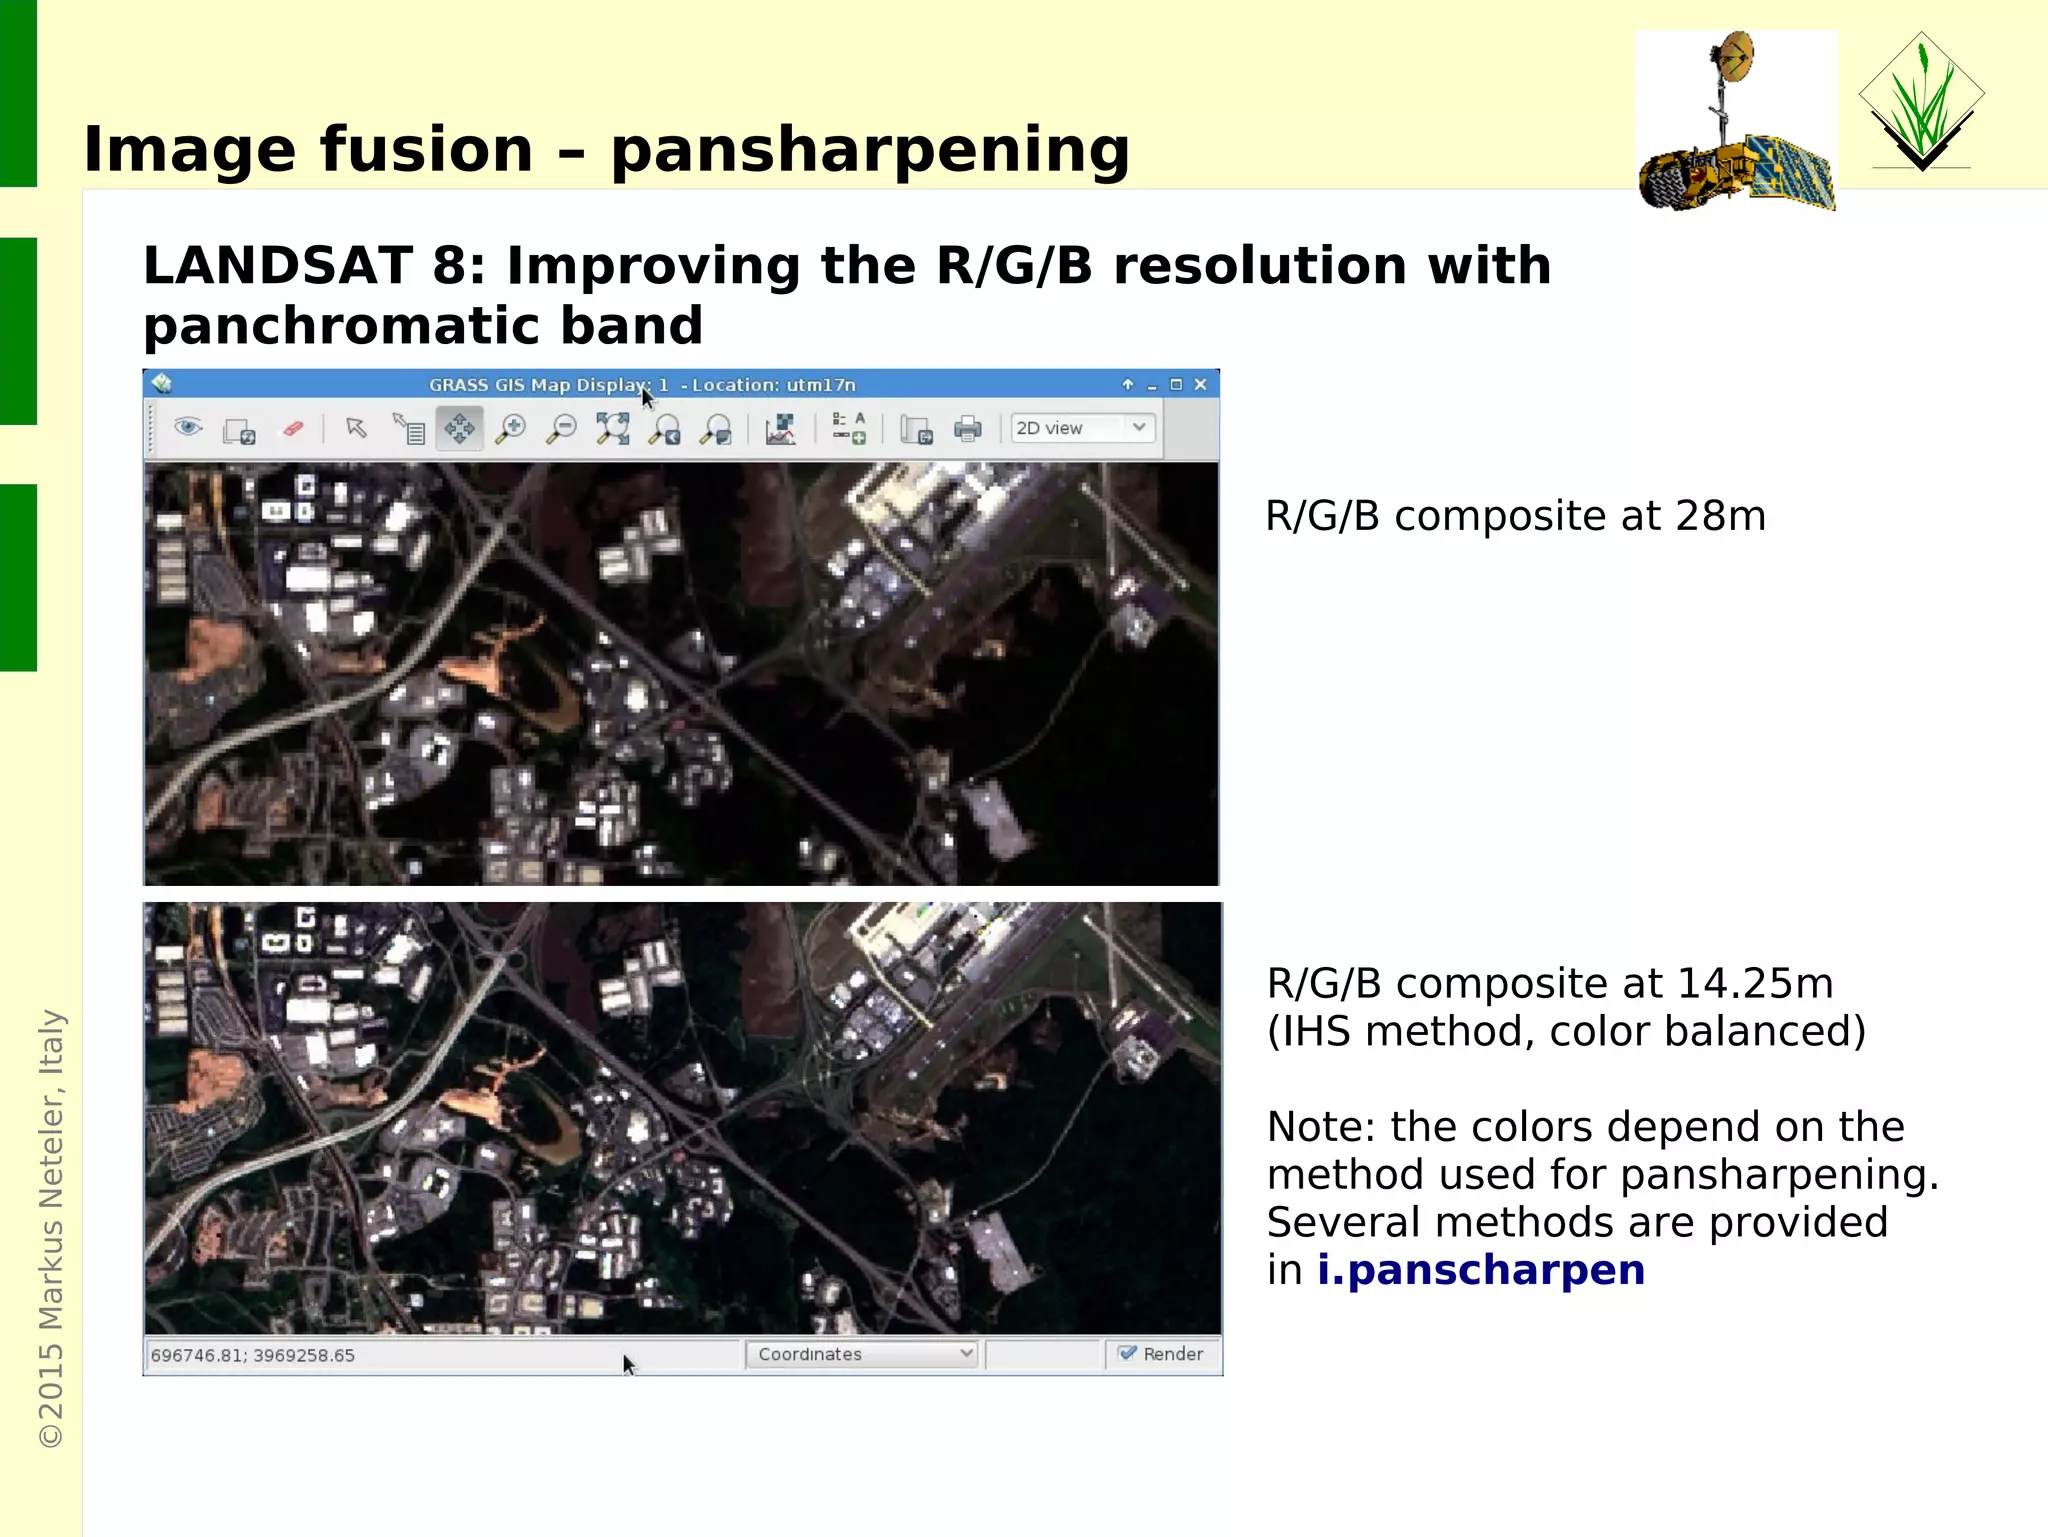
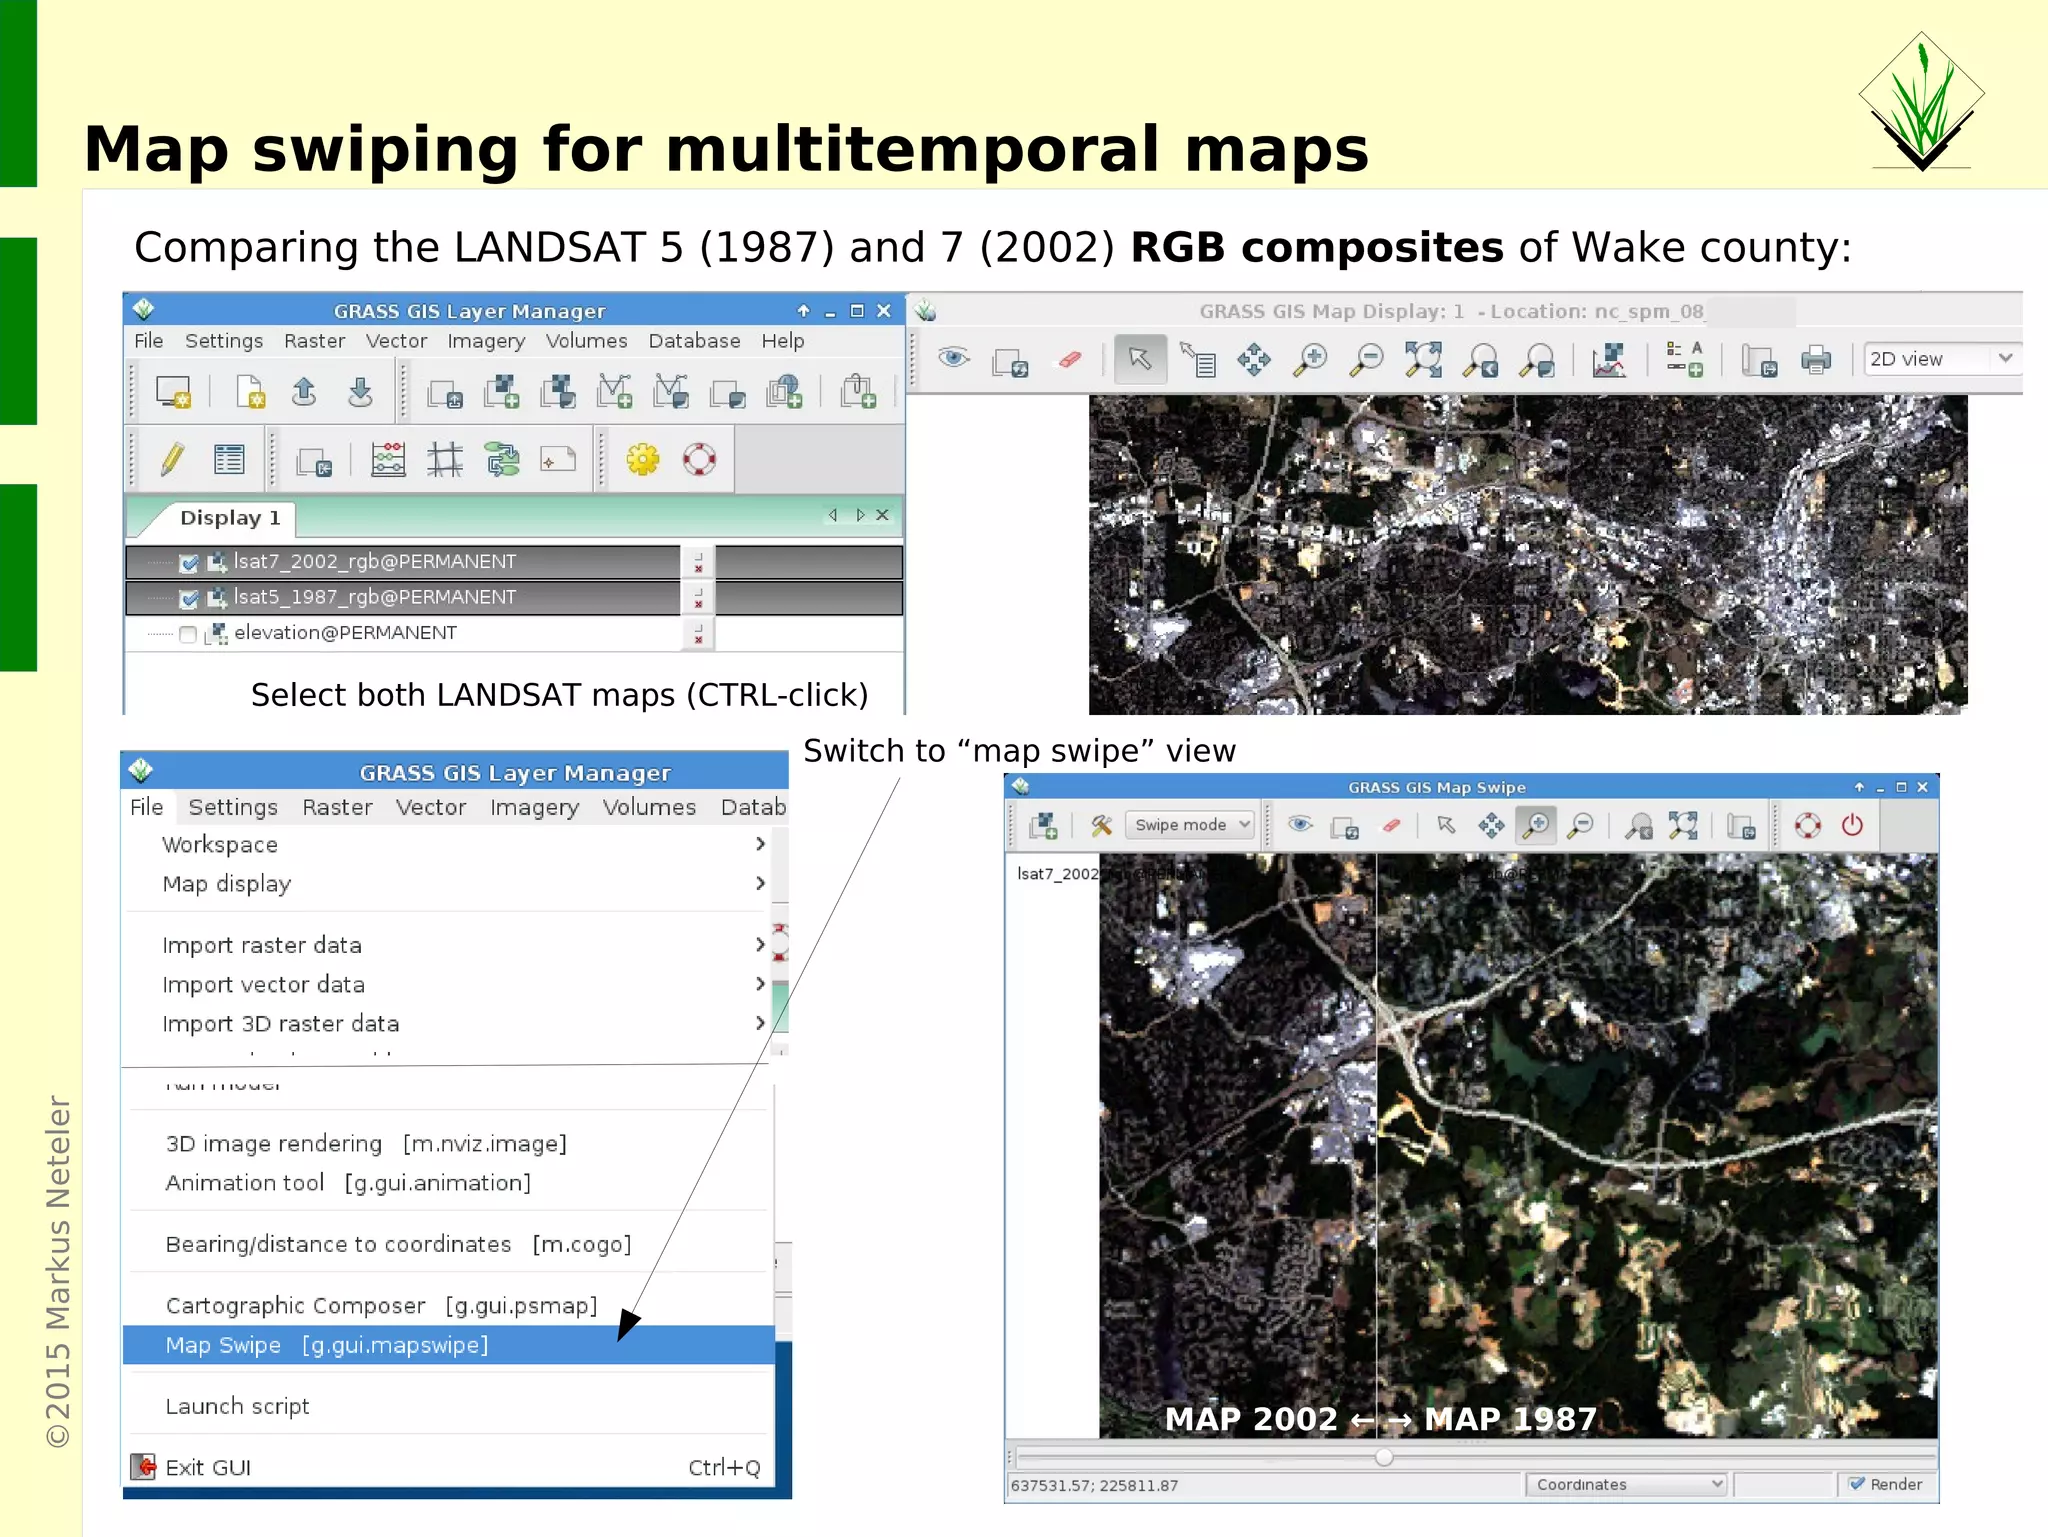
Techniques for georectification of maps and image fusion for improving resolution. Comparison of historical LANDSAT images.
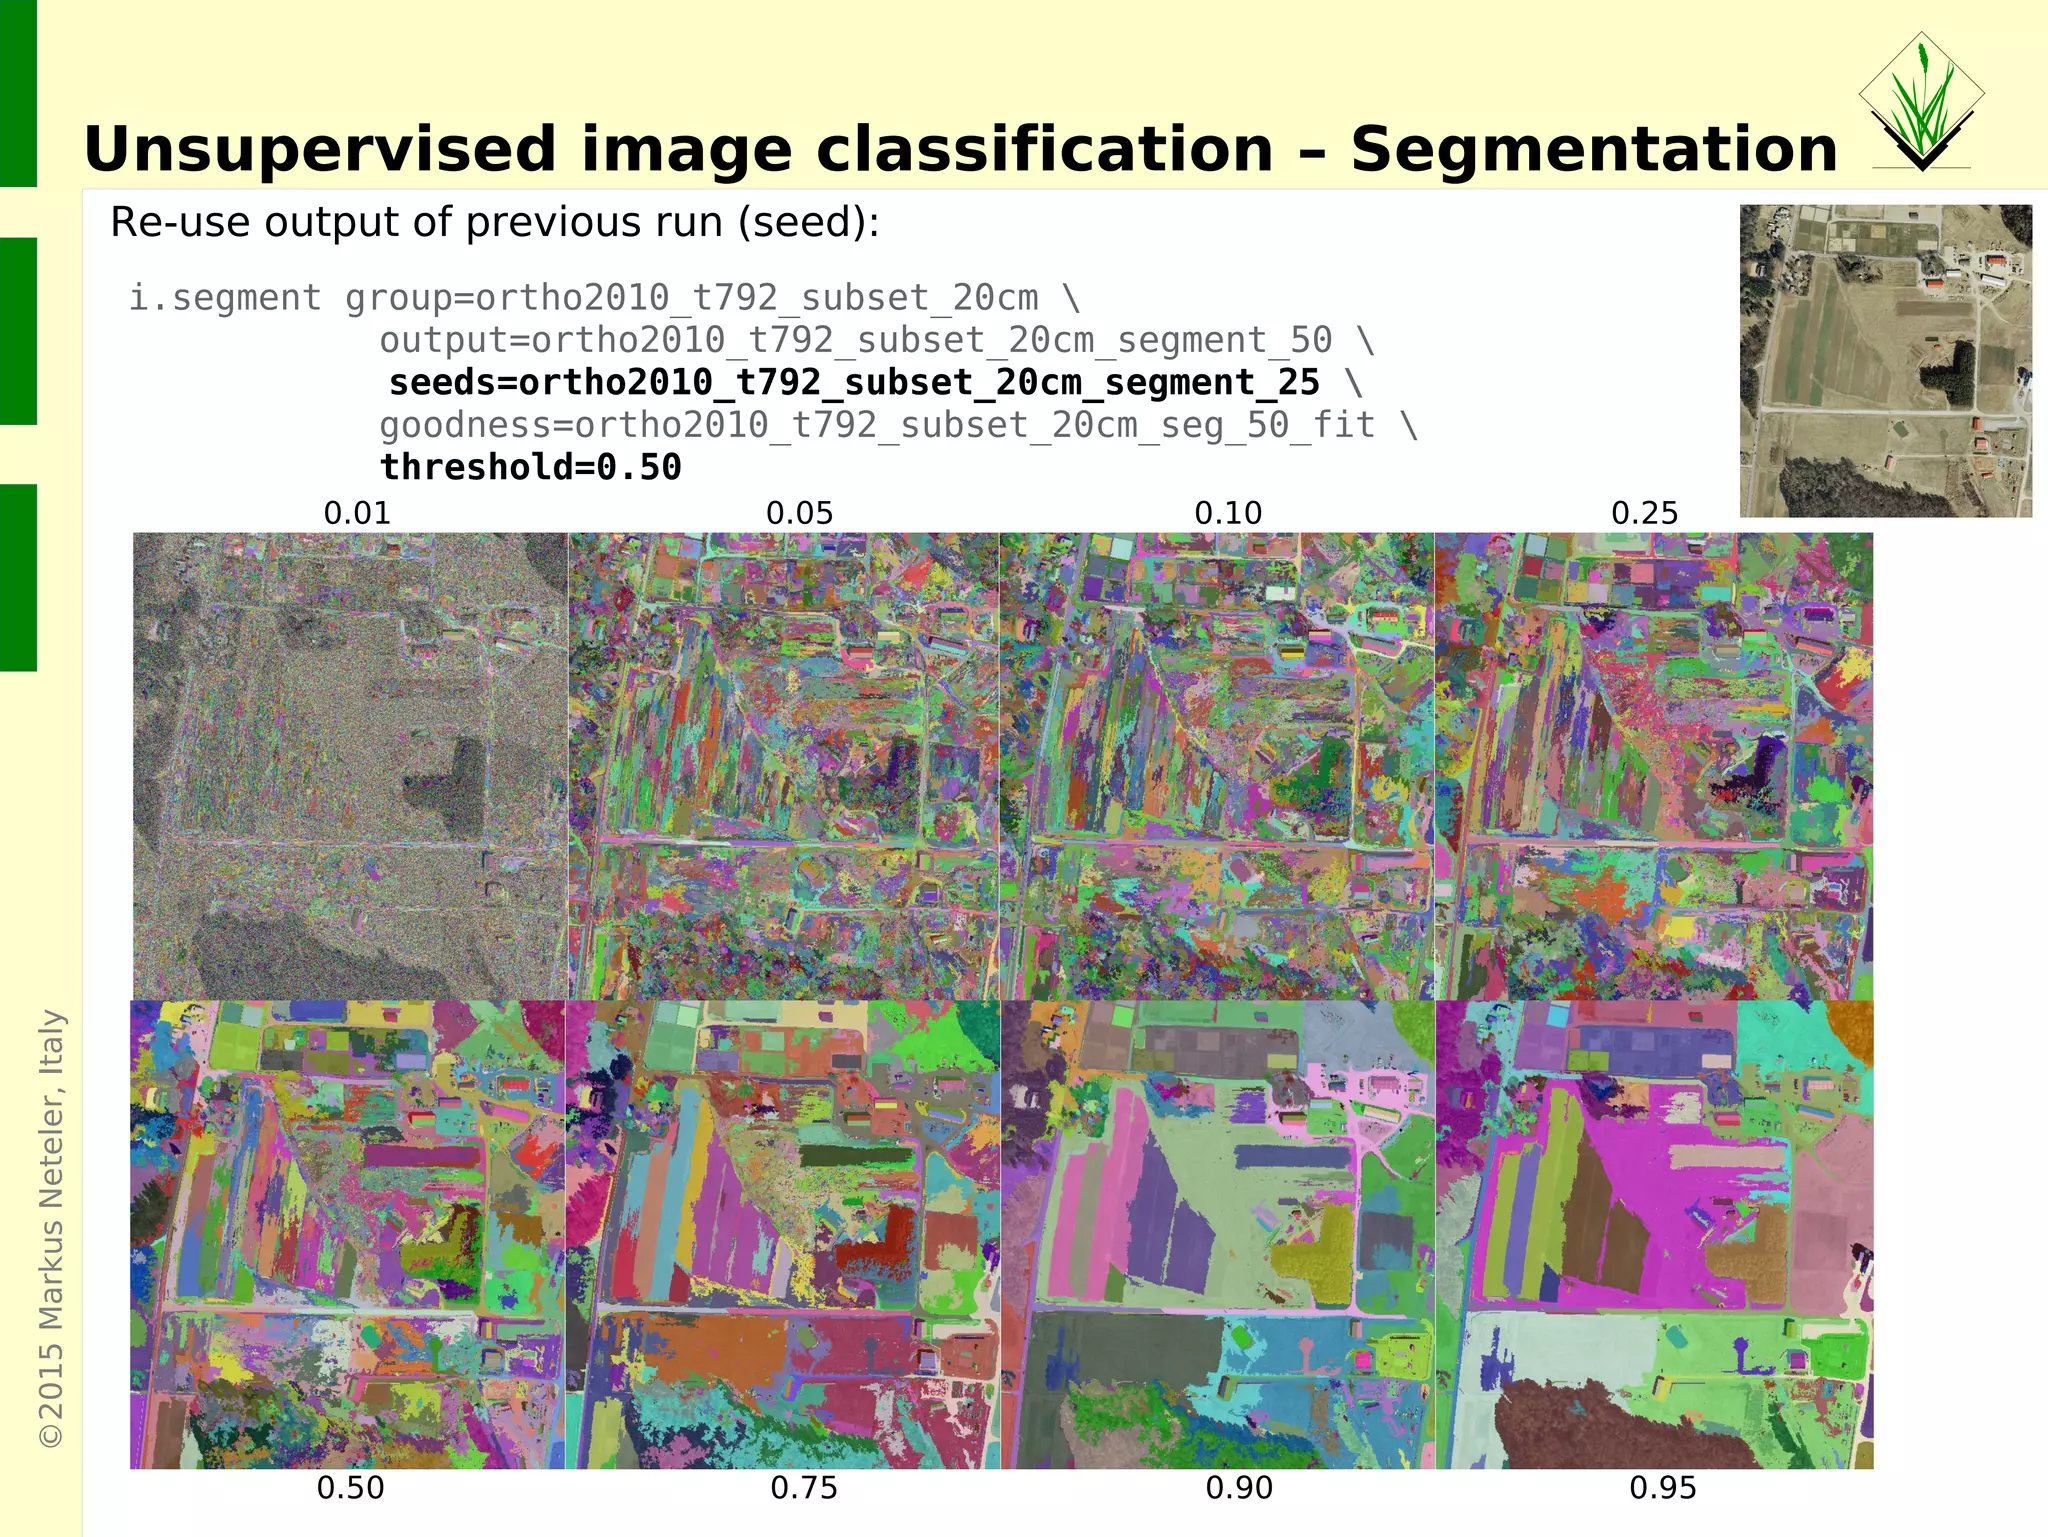
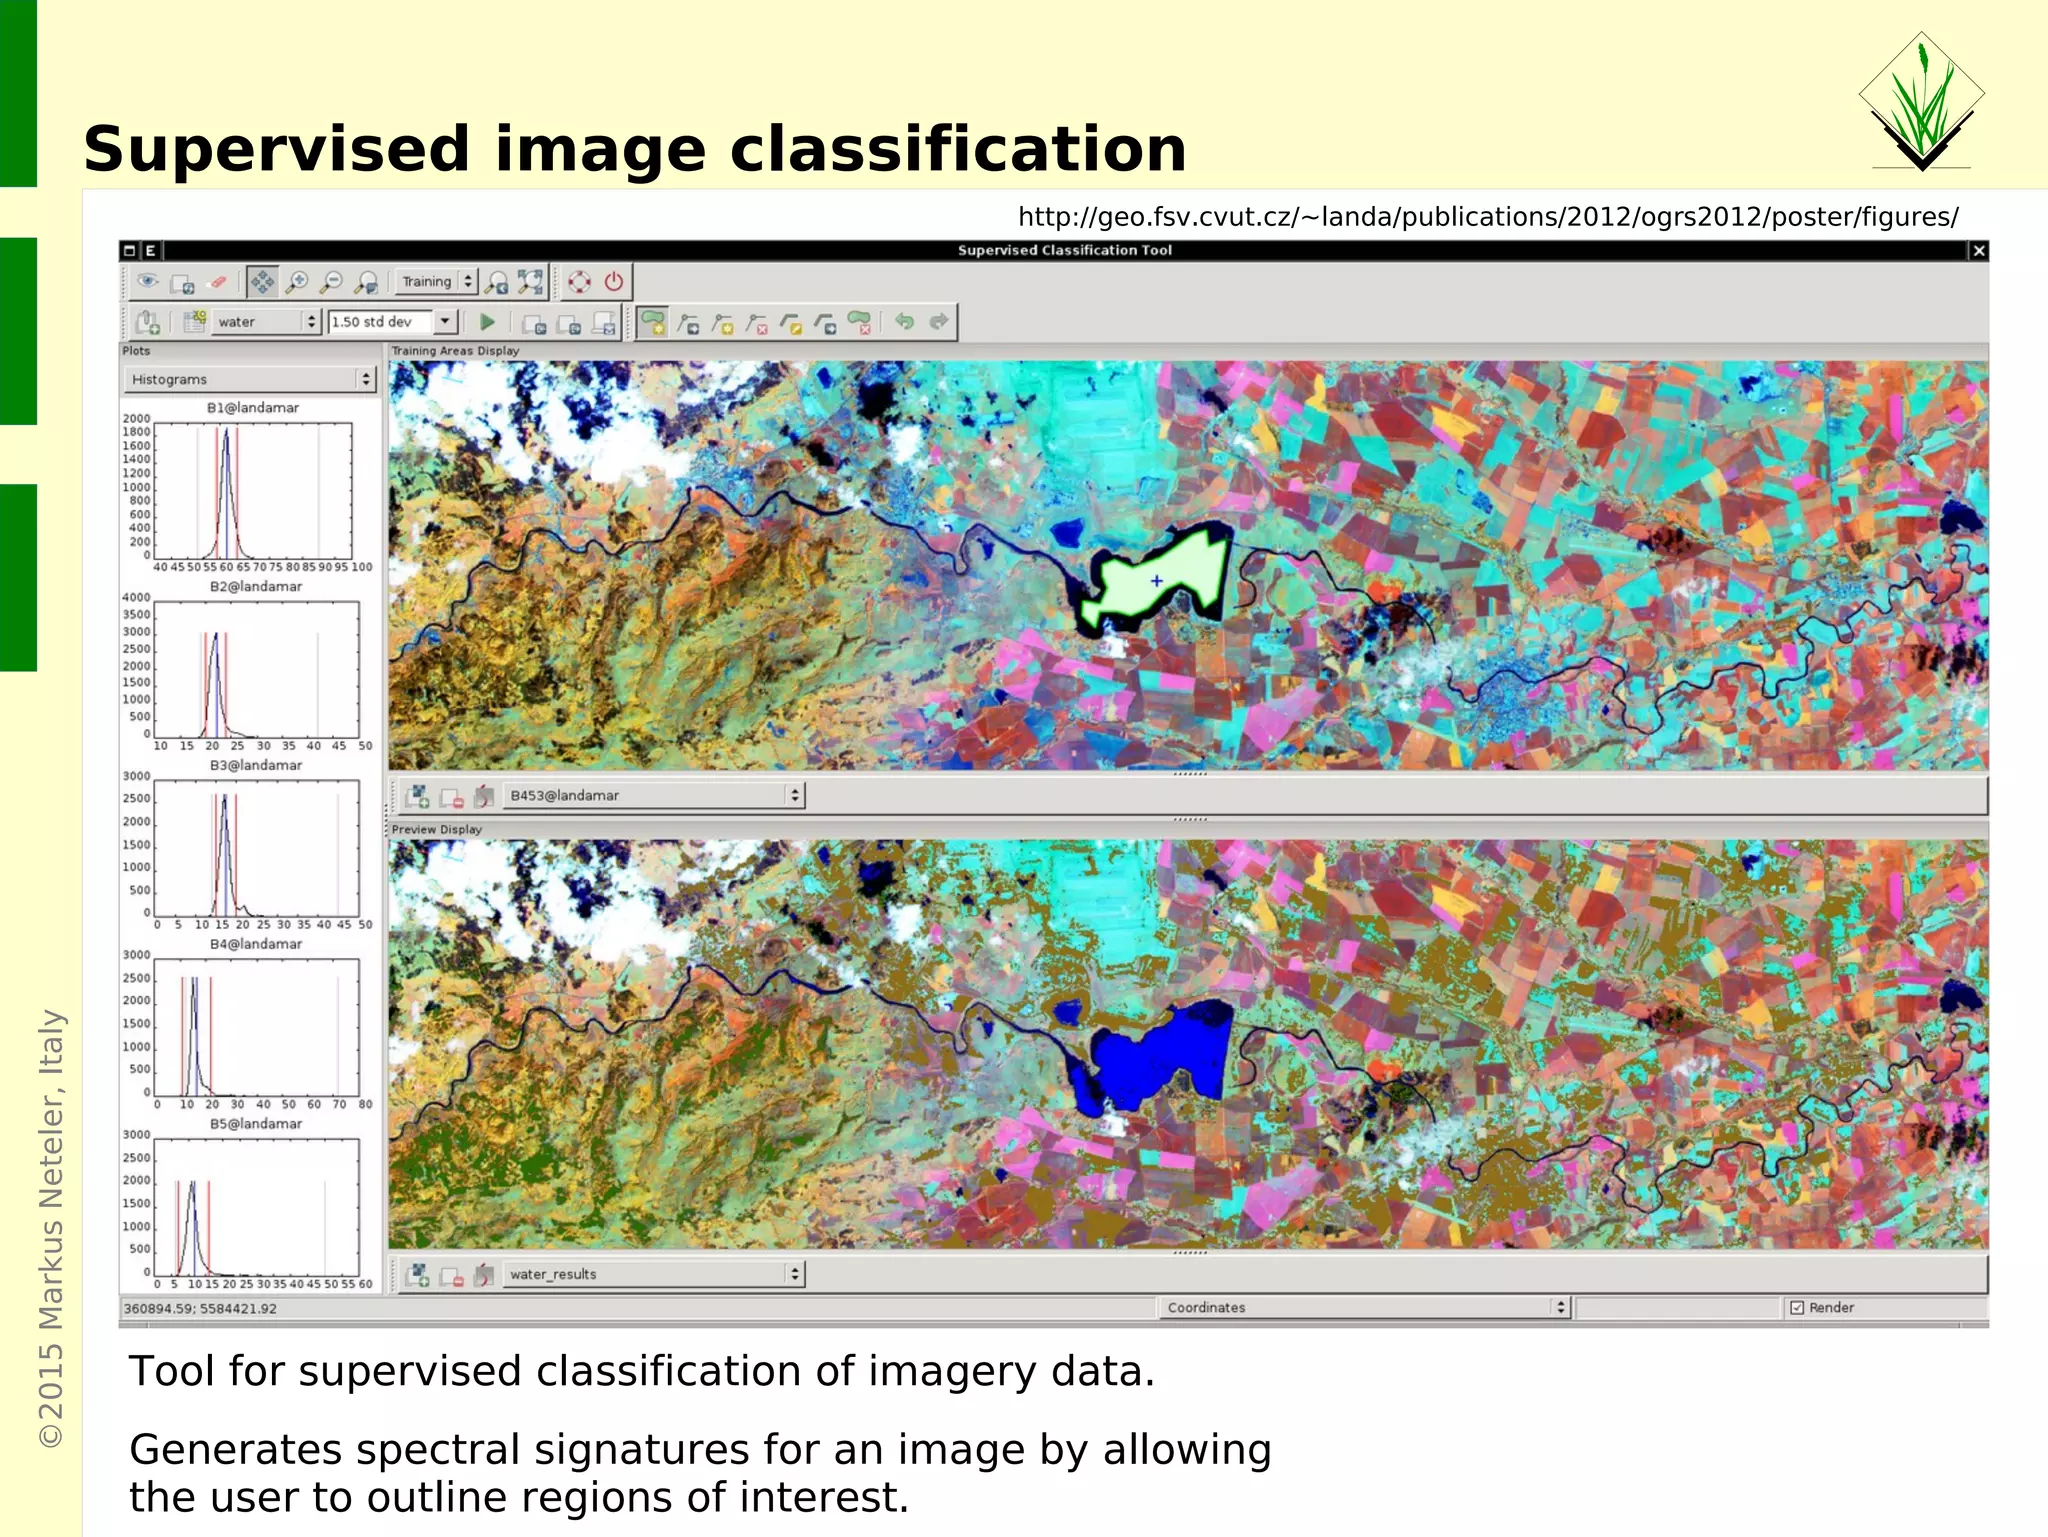
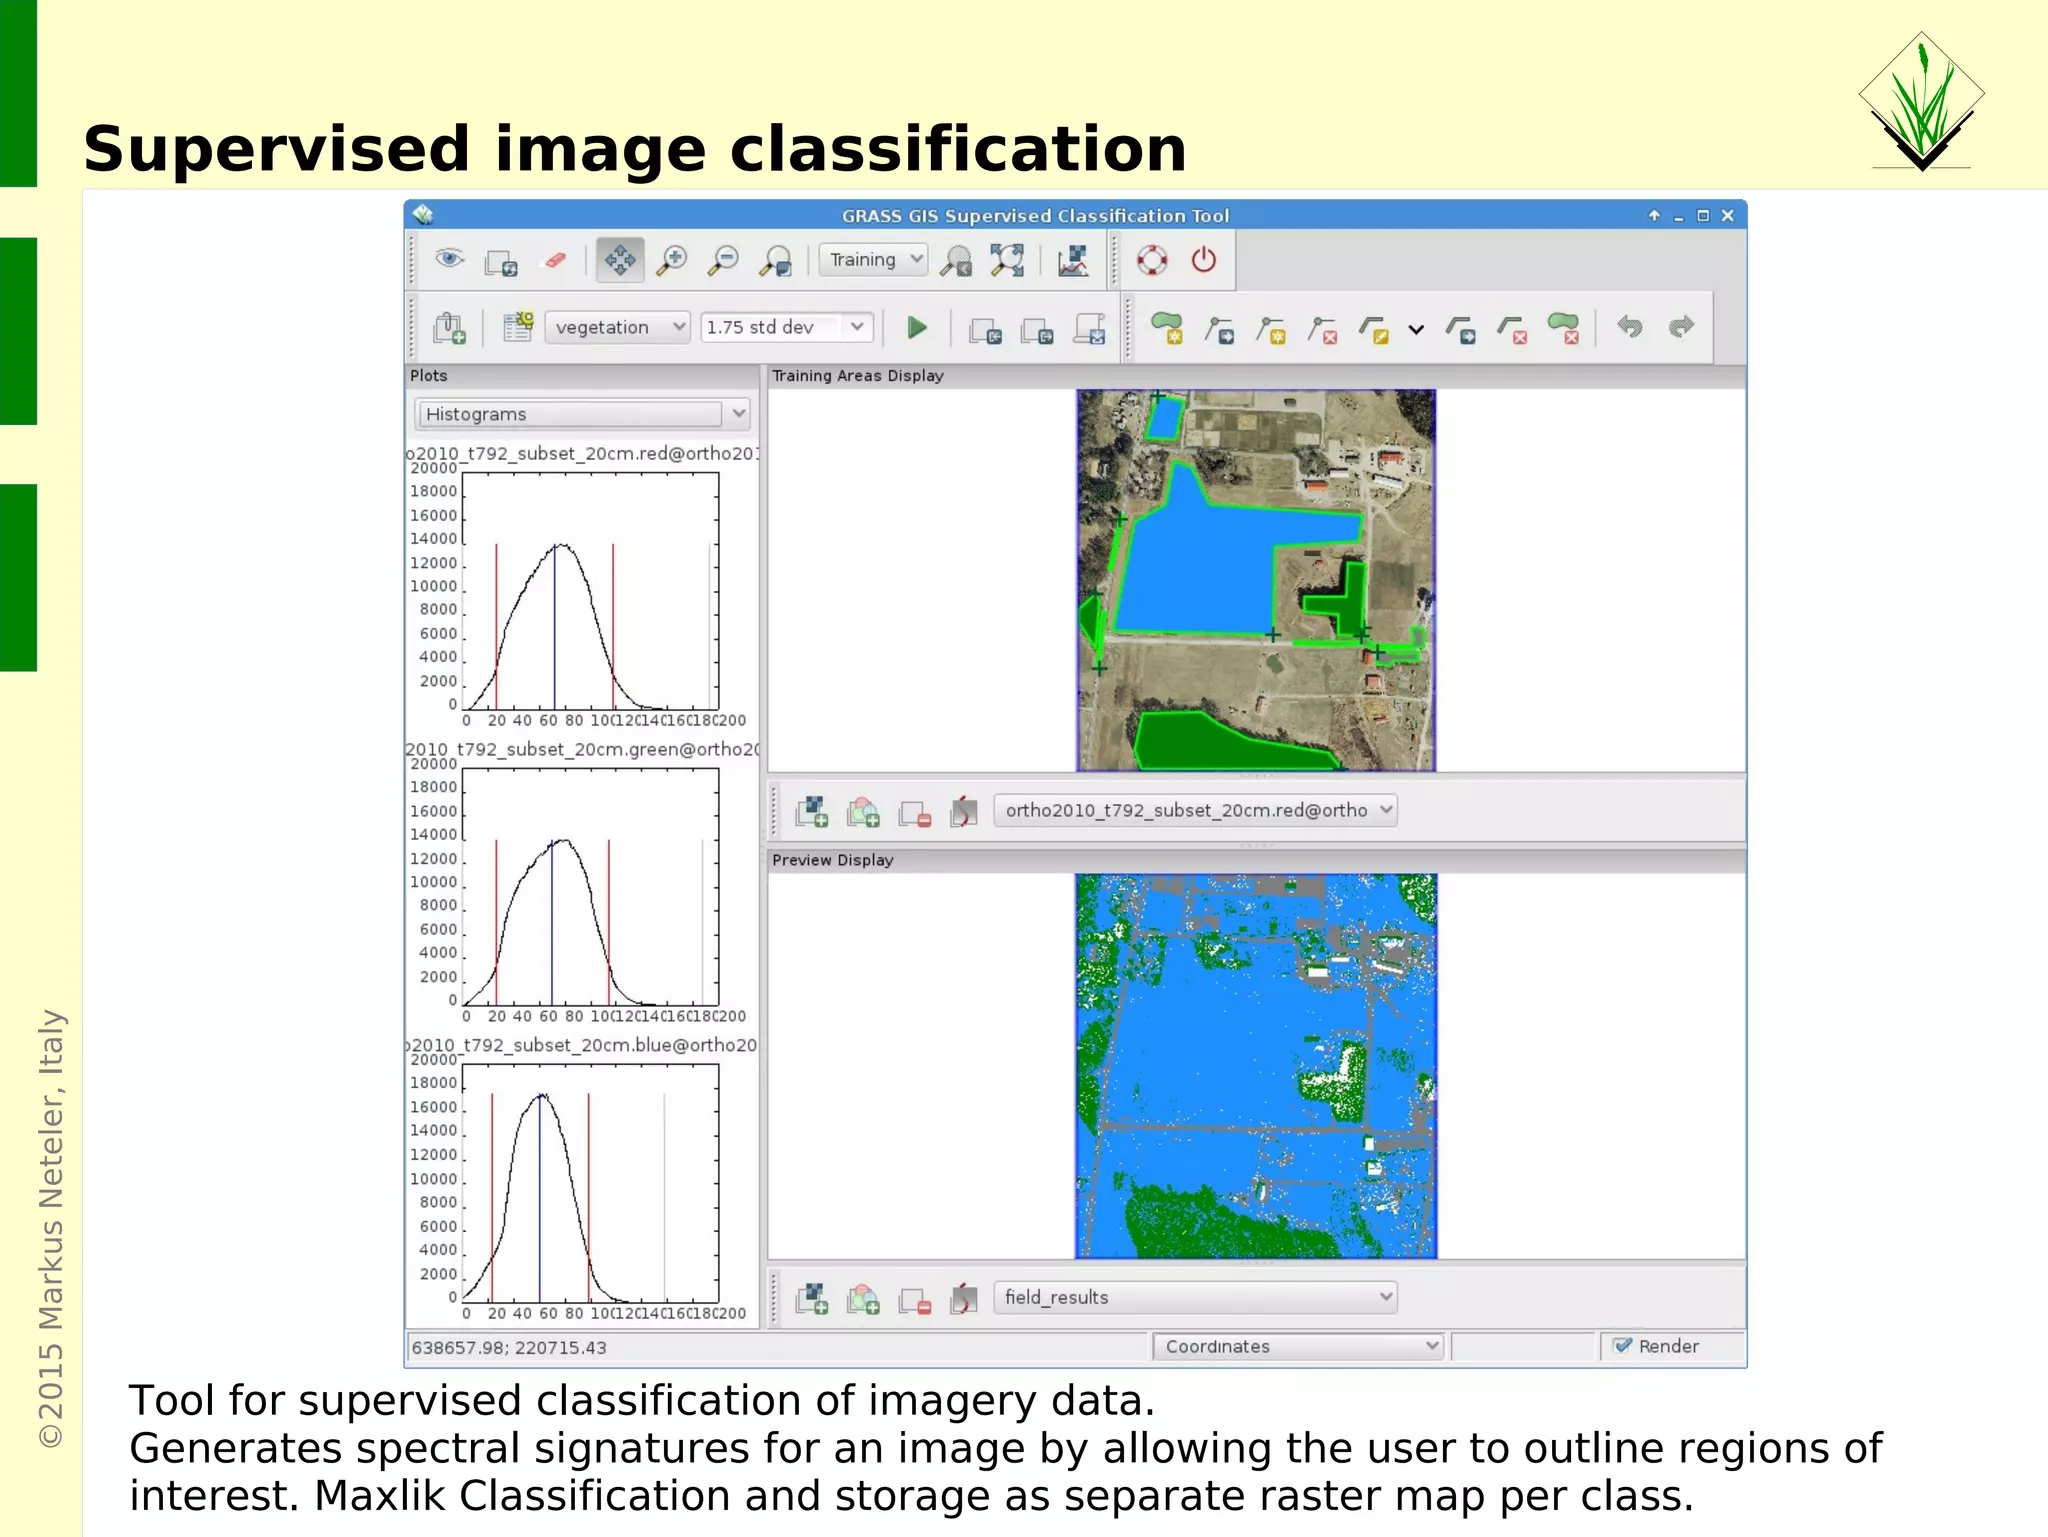
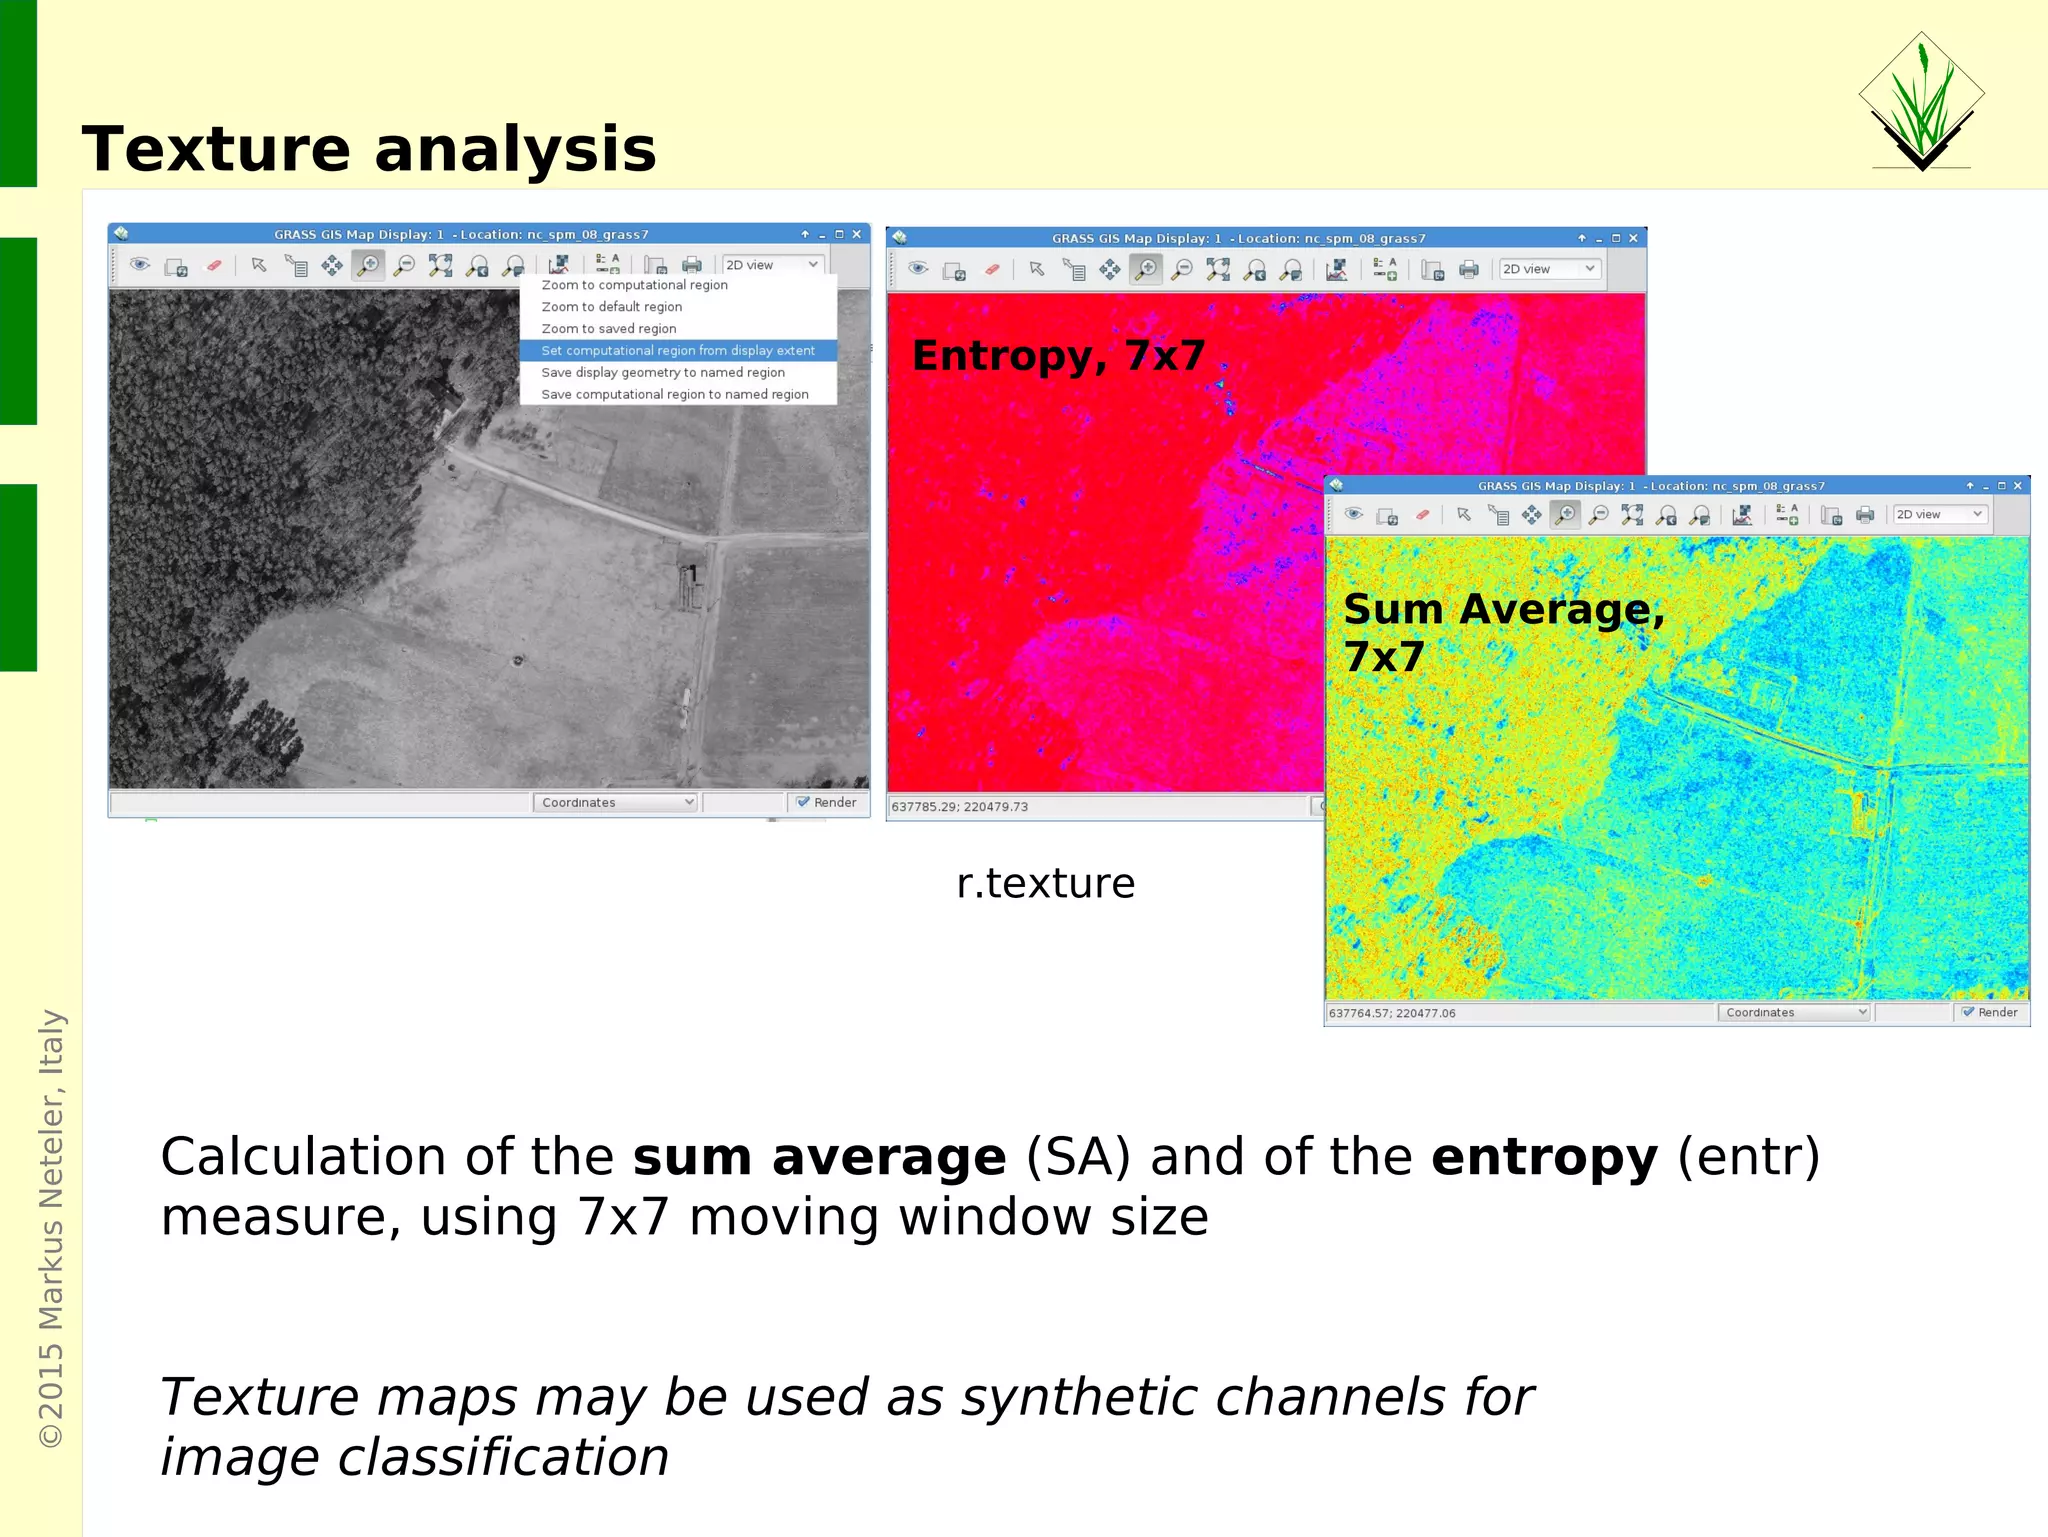
Unsupervised and supervised image classification tools, including segmentation and texture analysis for imagery data.
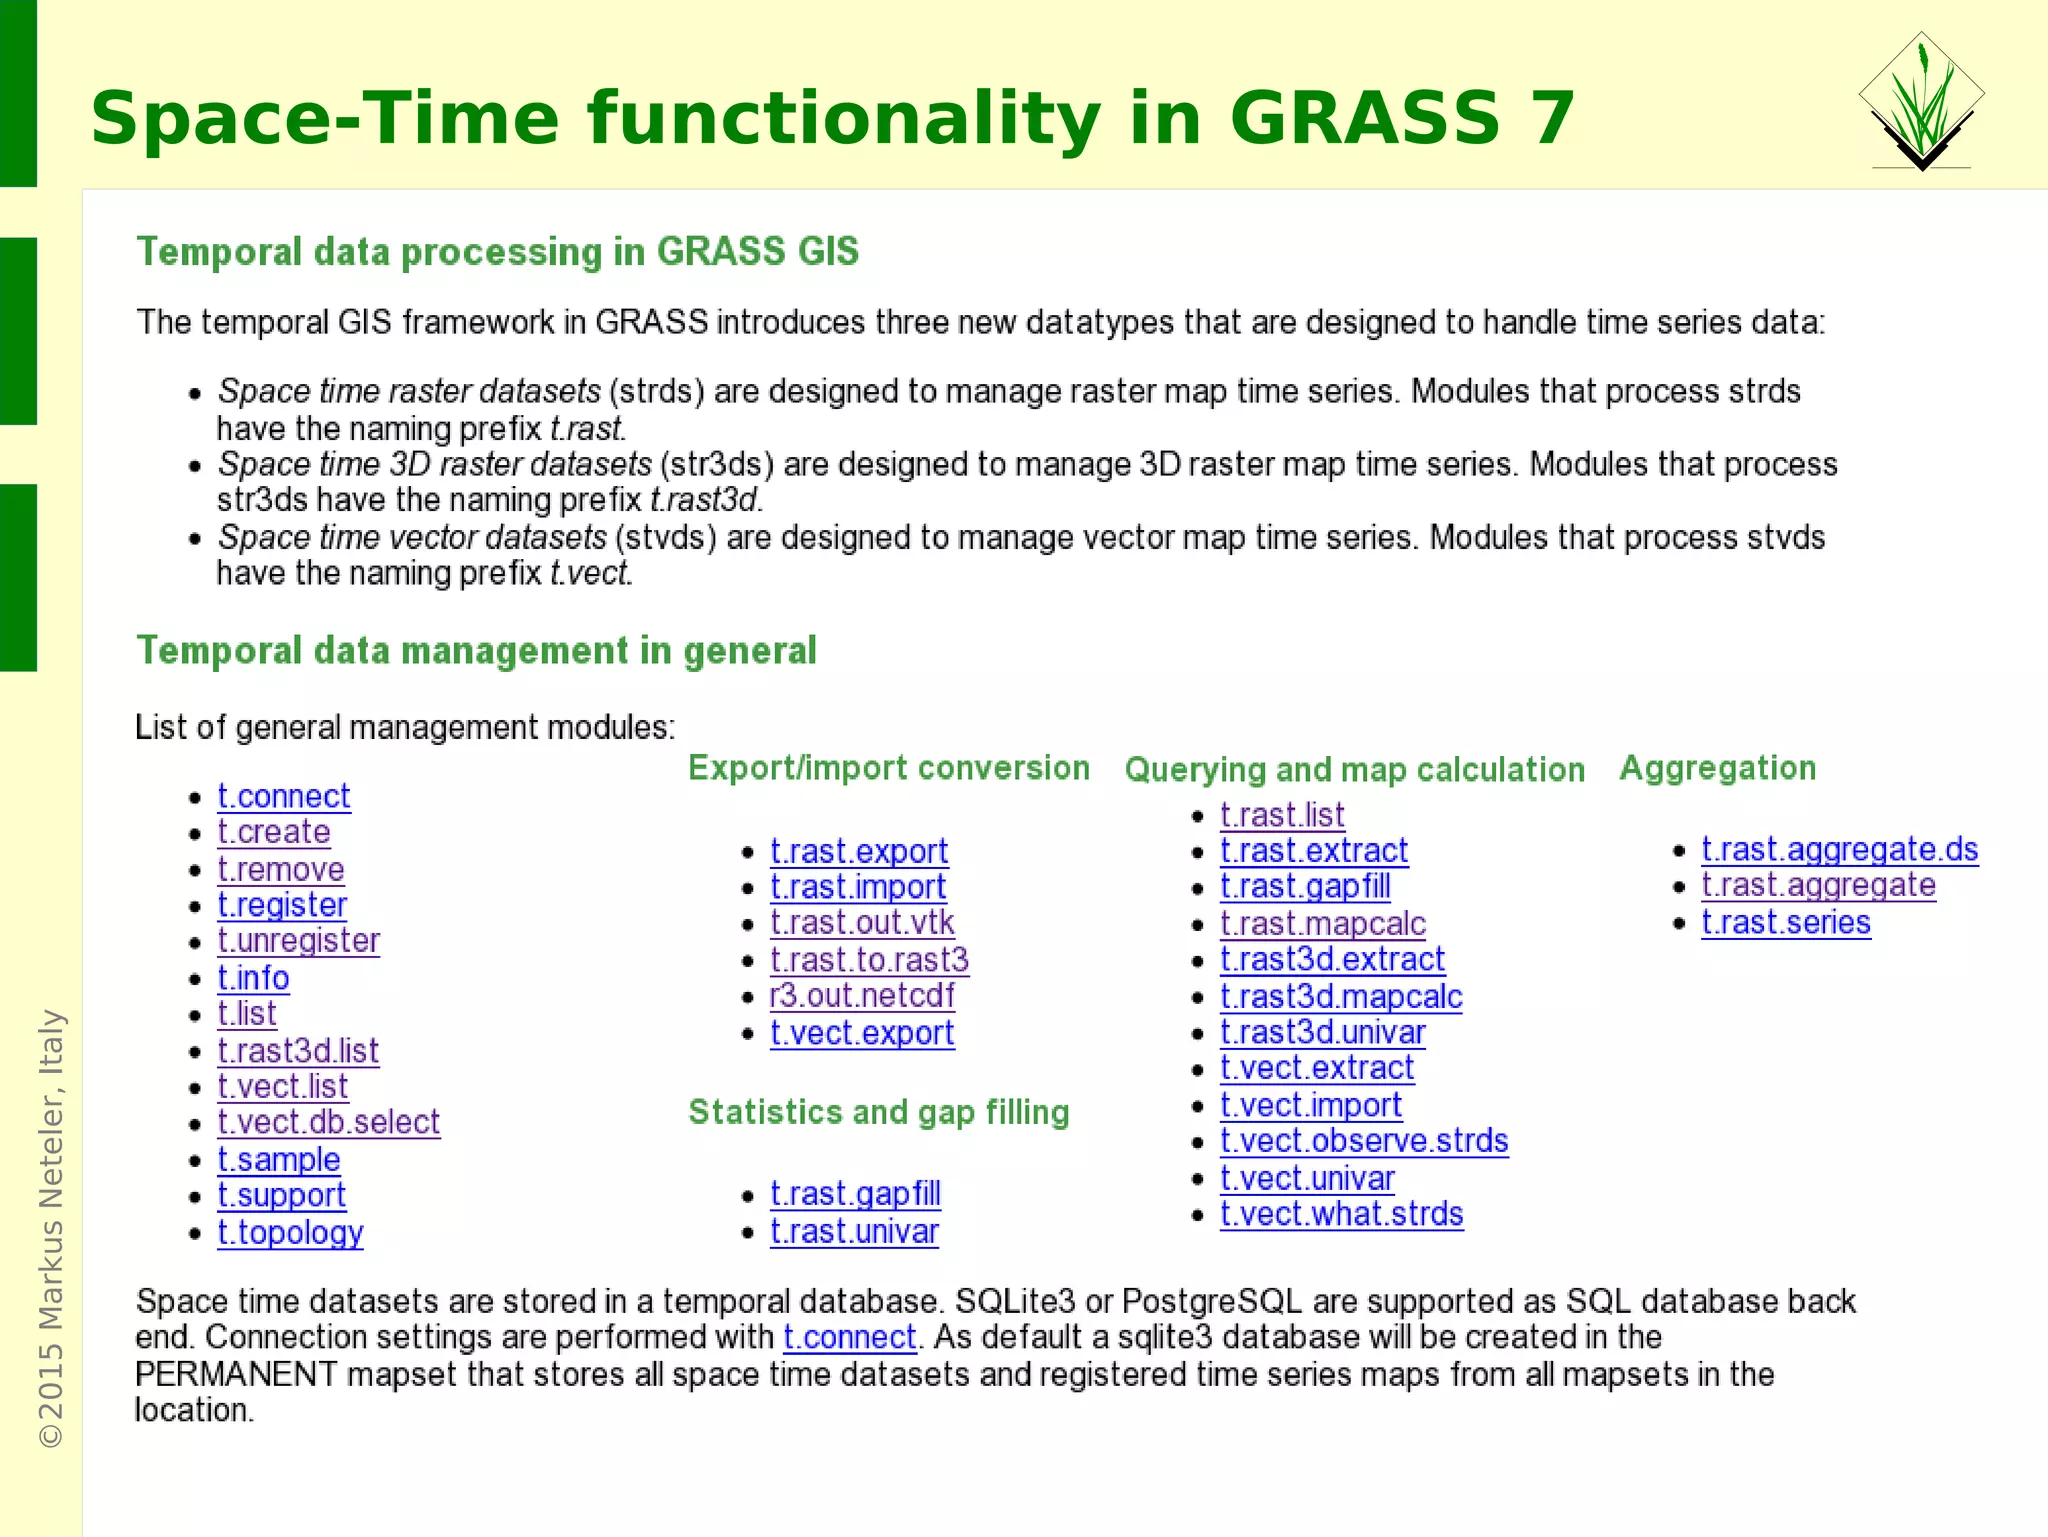
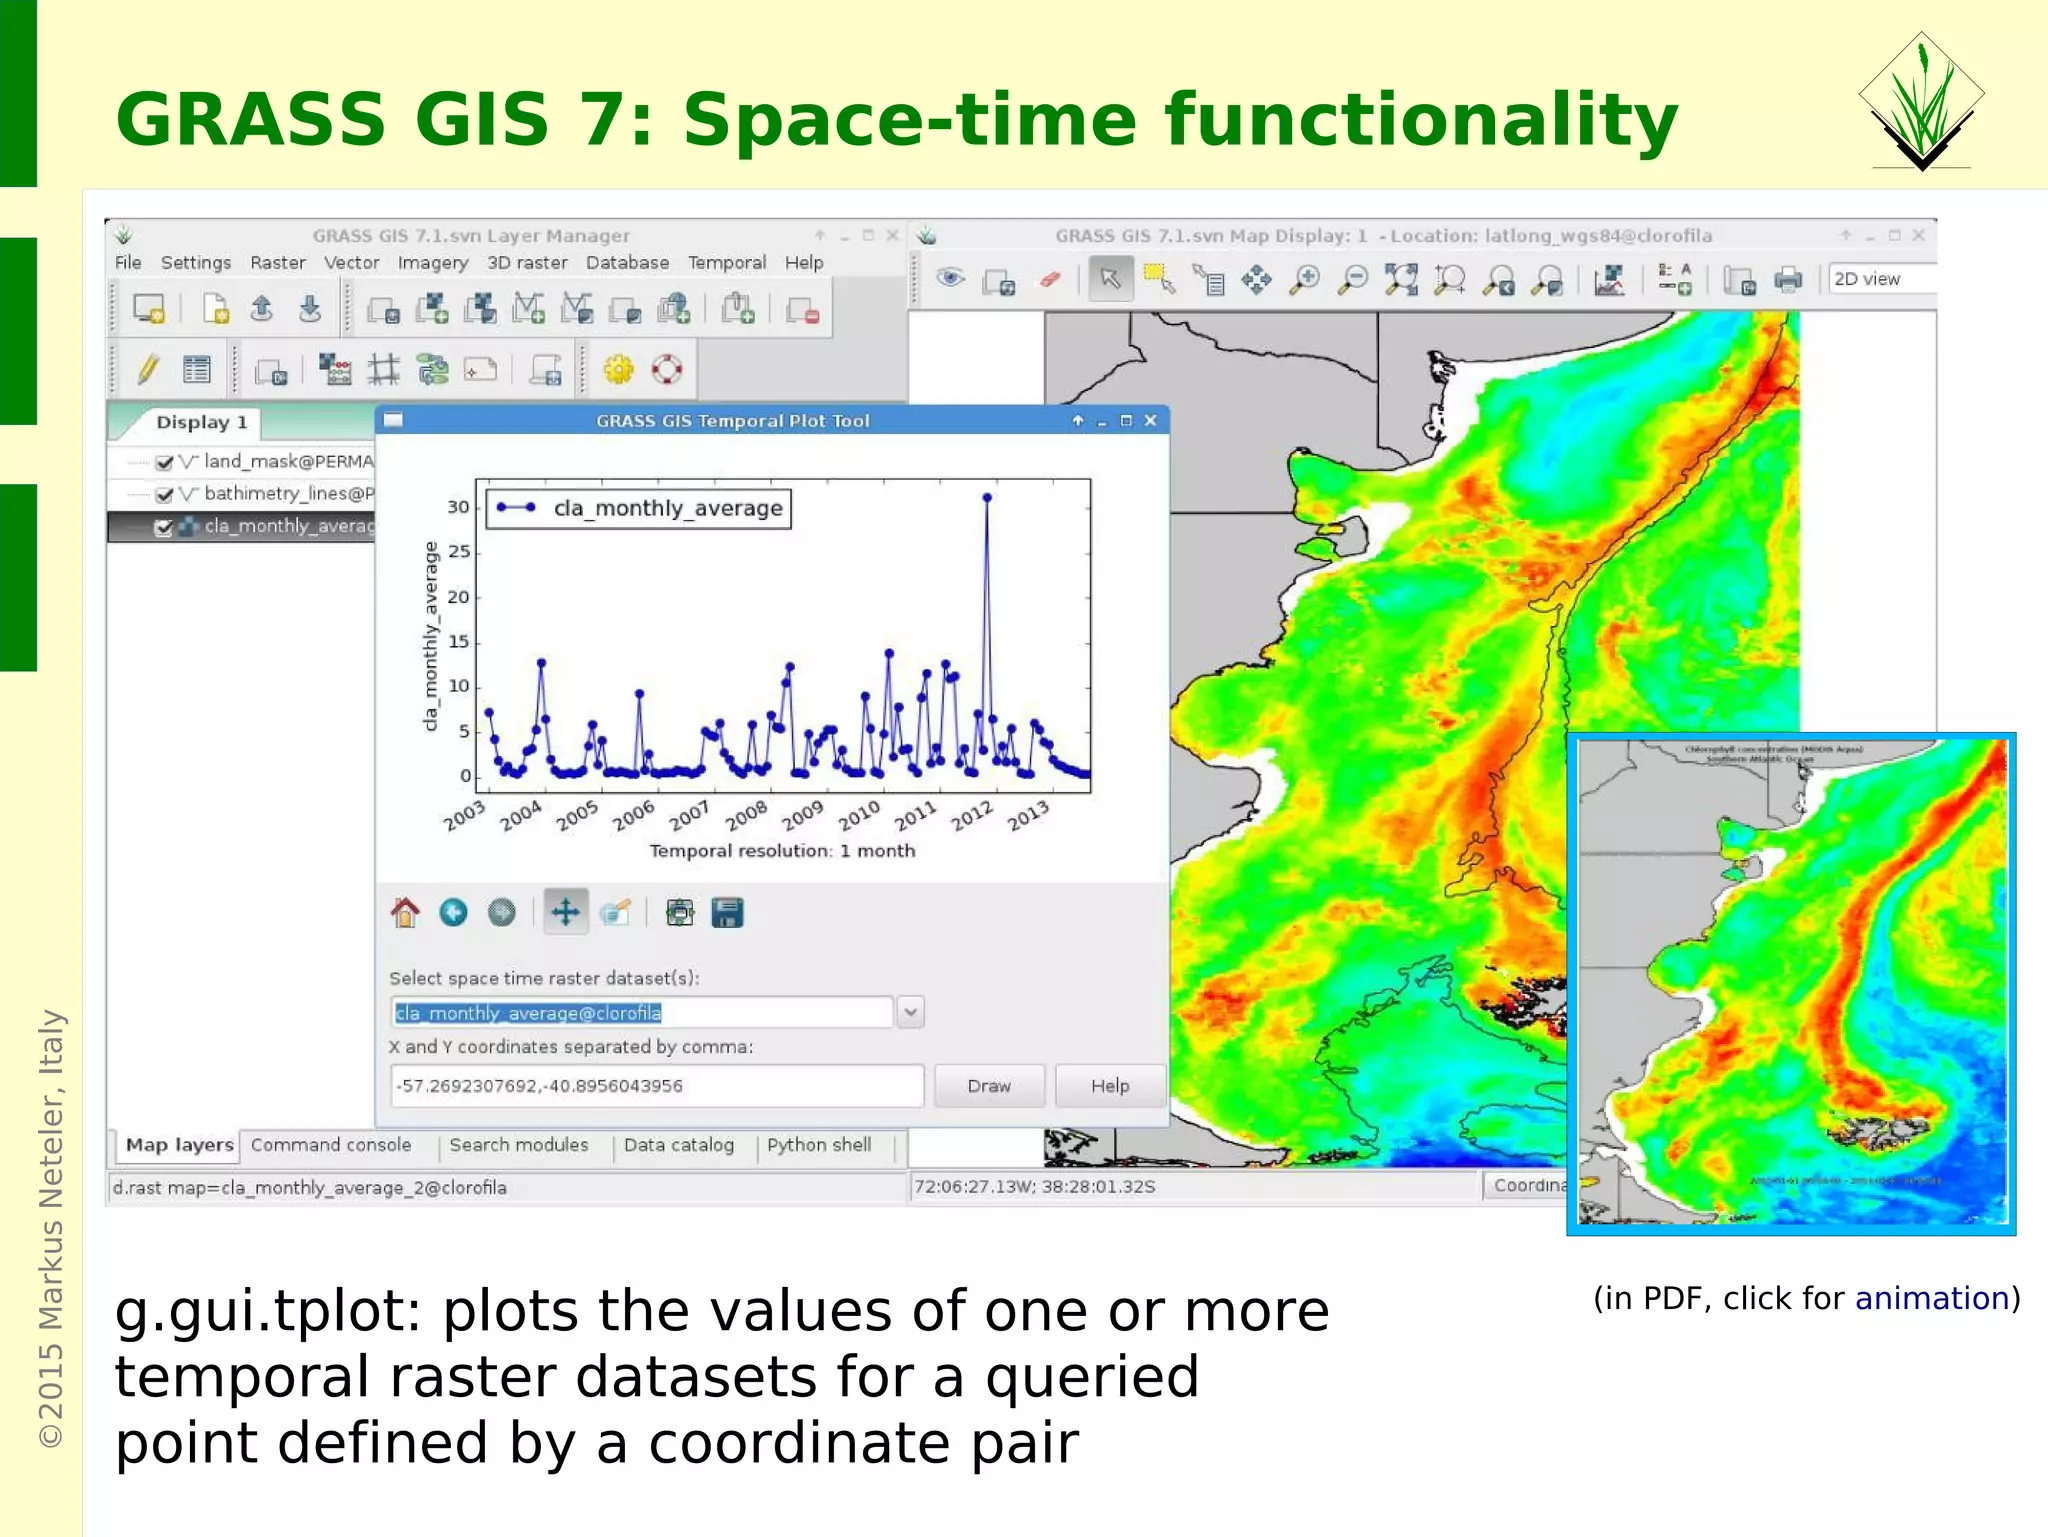
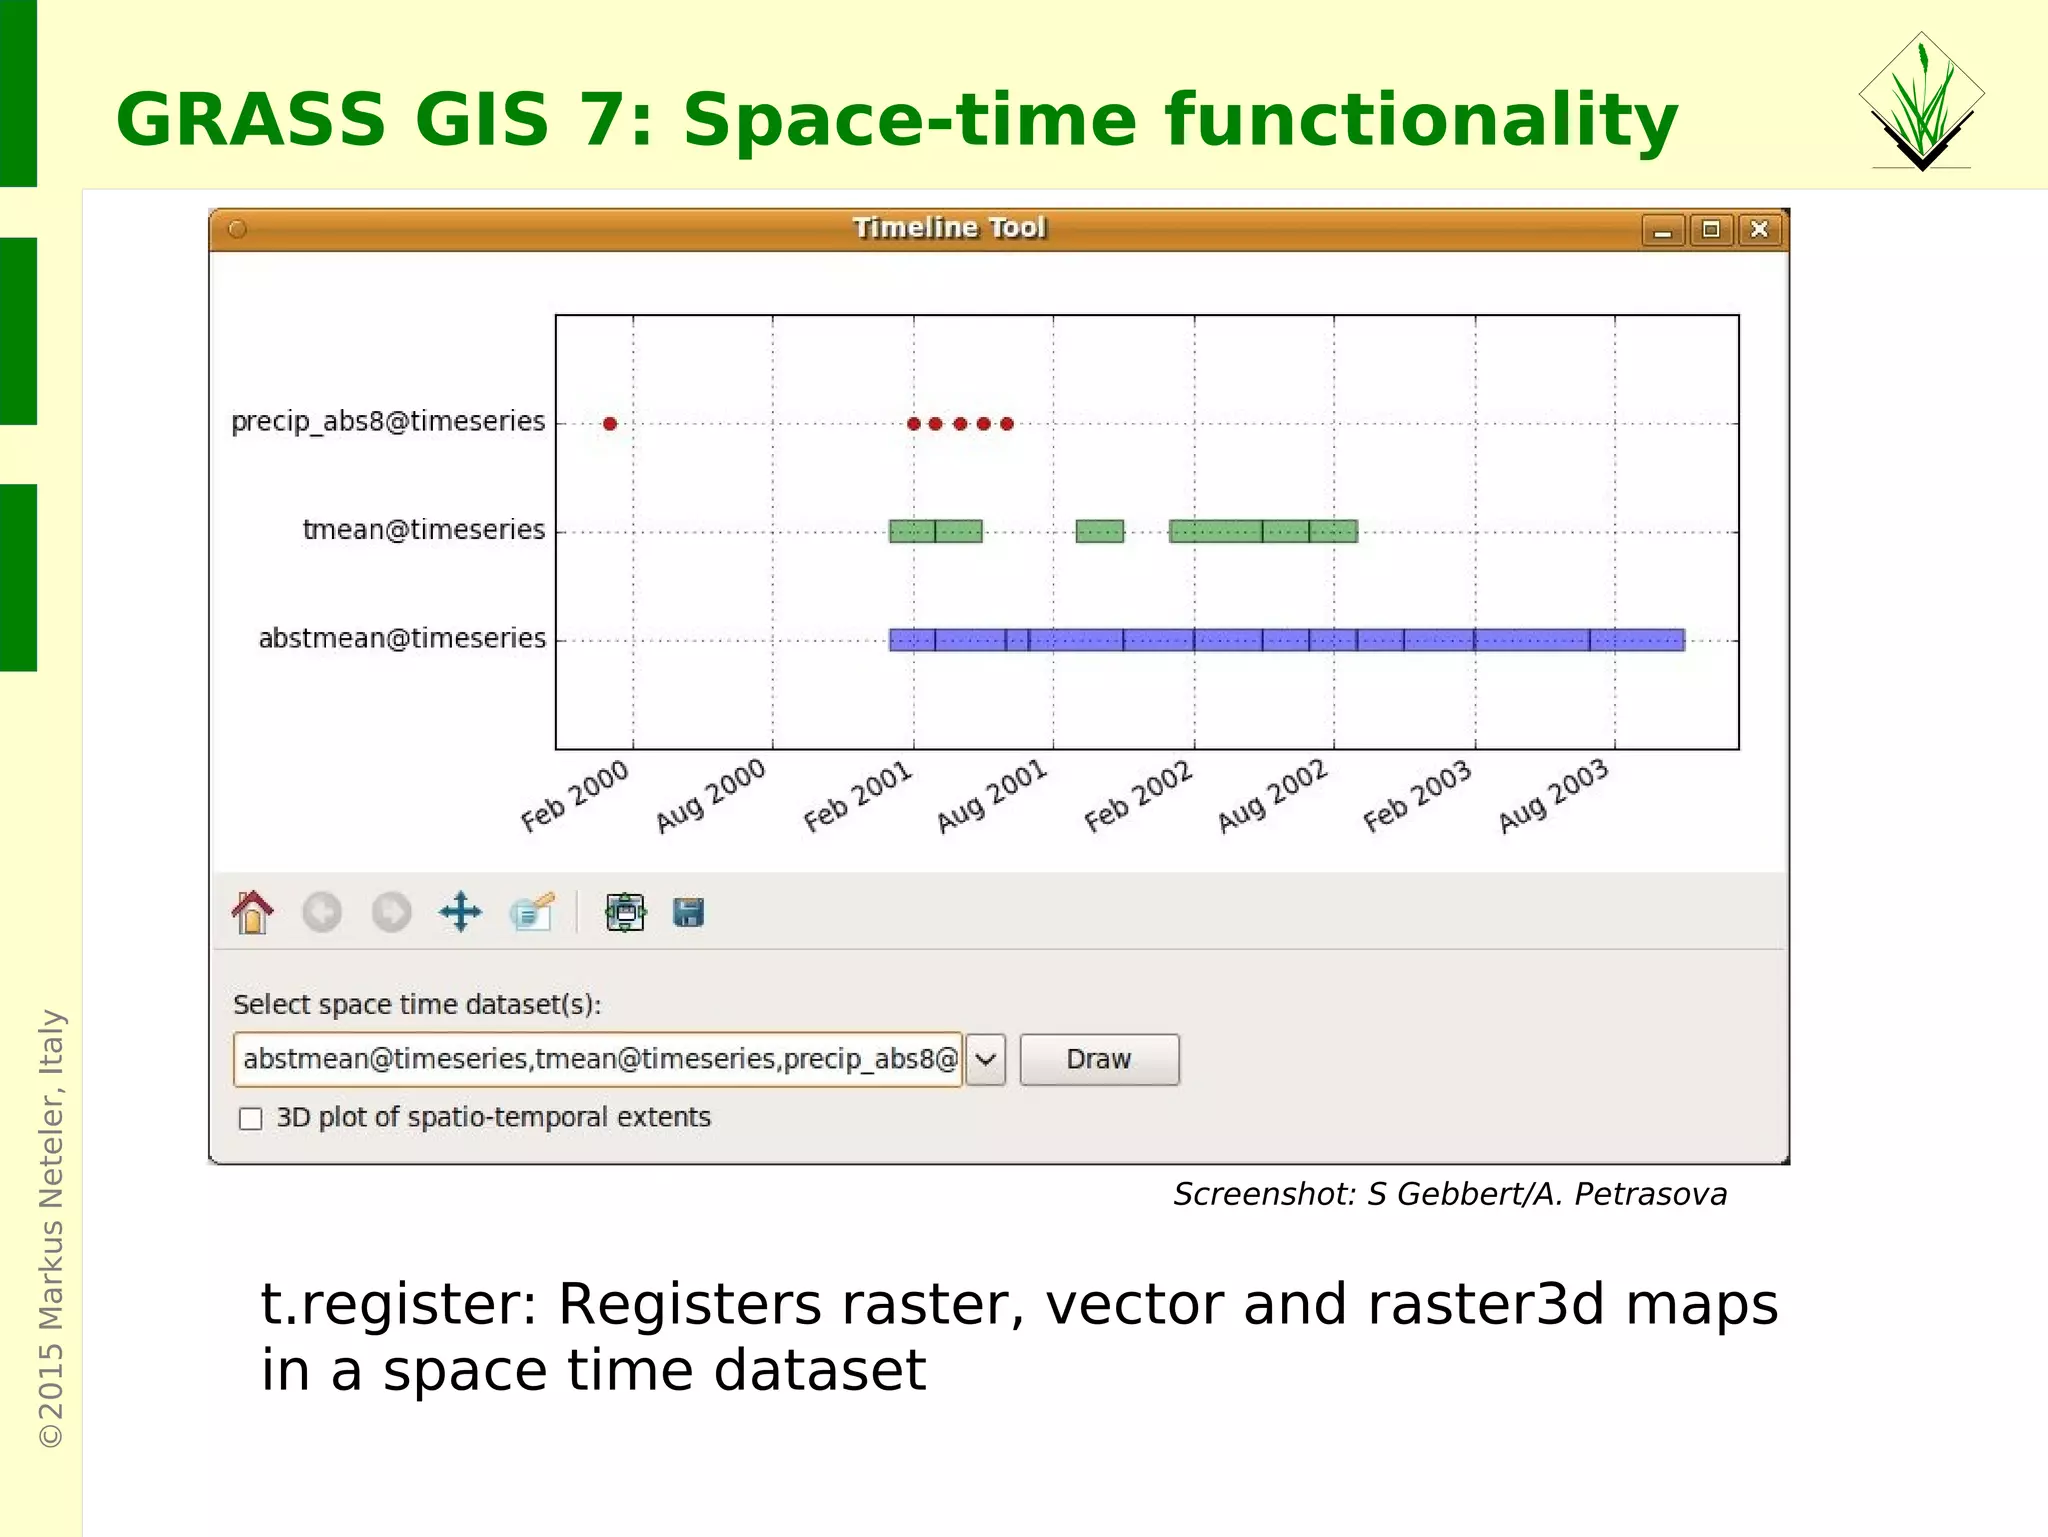
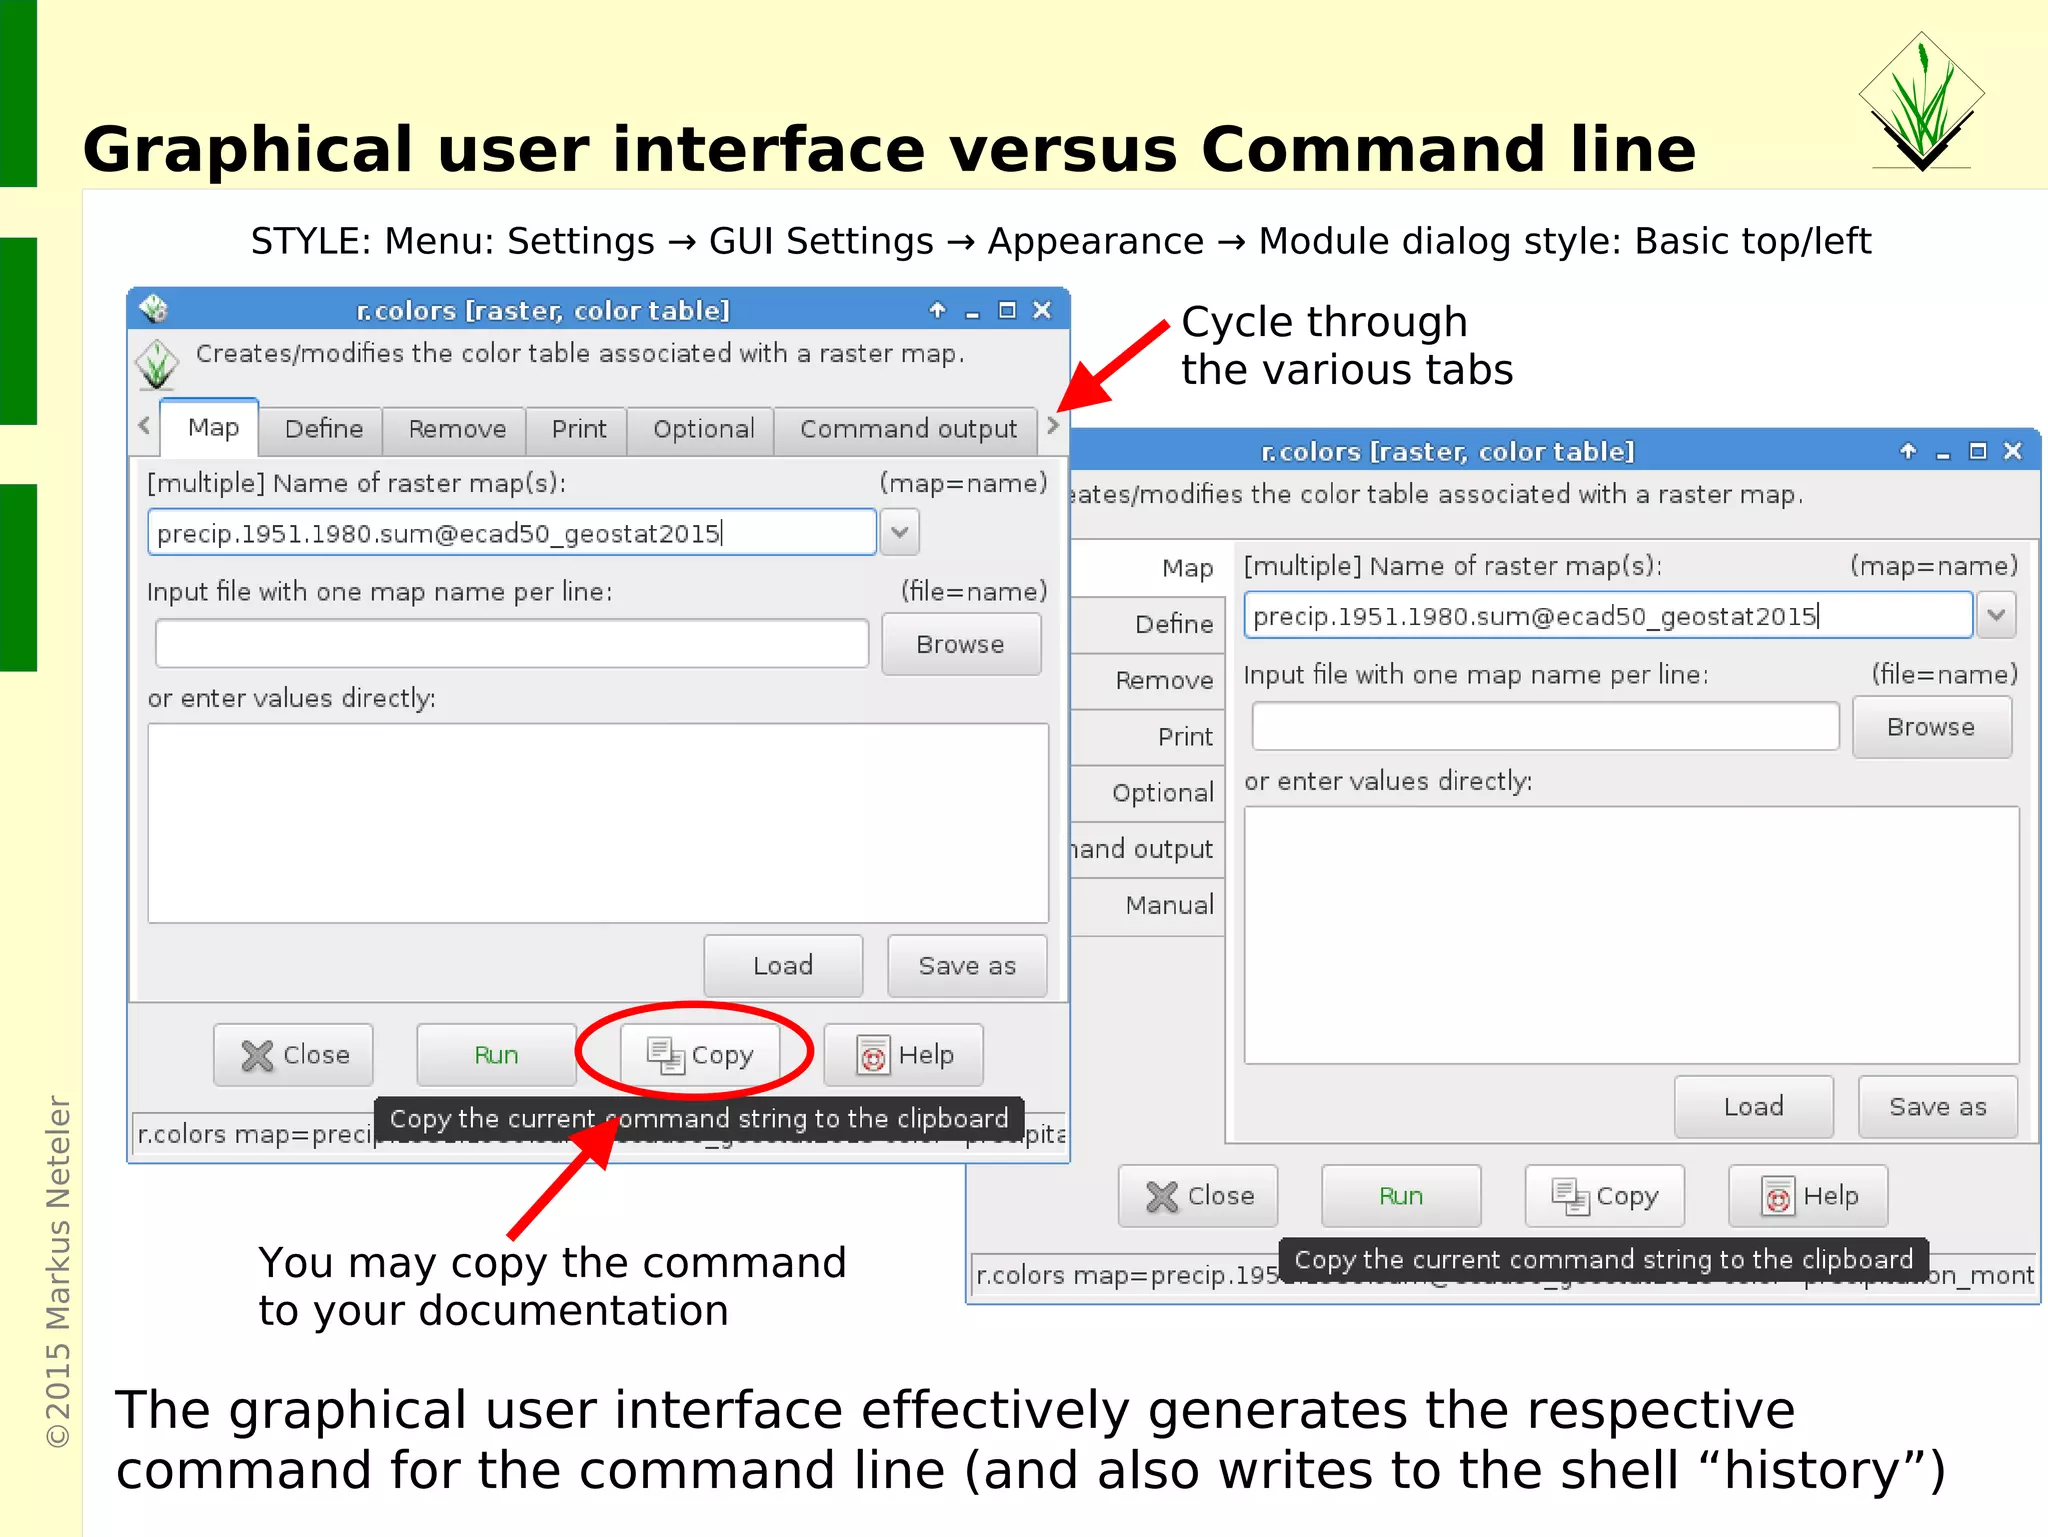
GRASS GIS 7's space-time functionality for managing temporal datasets and the graphical vs command-line interface.
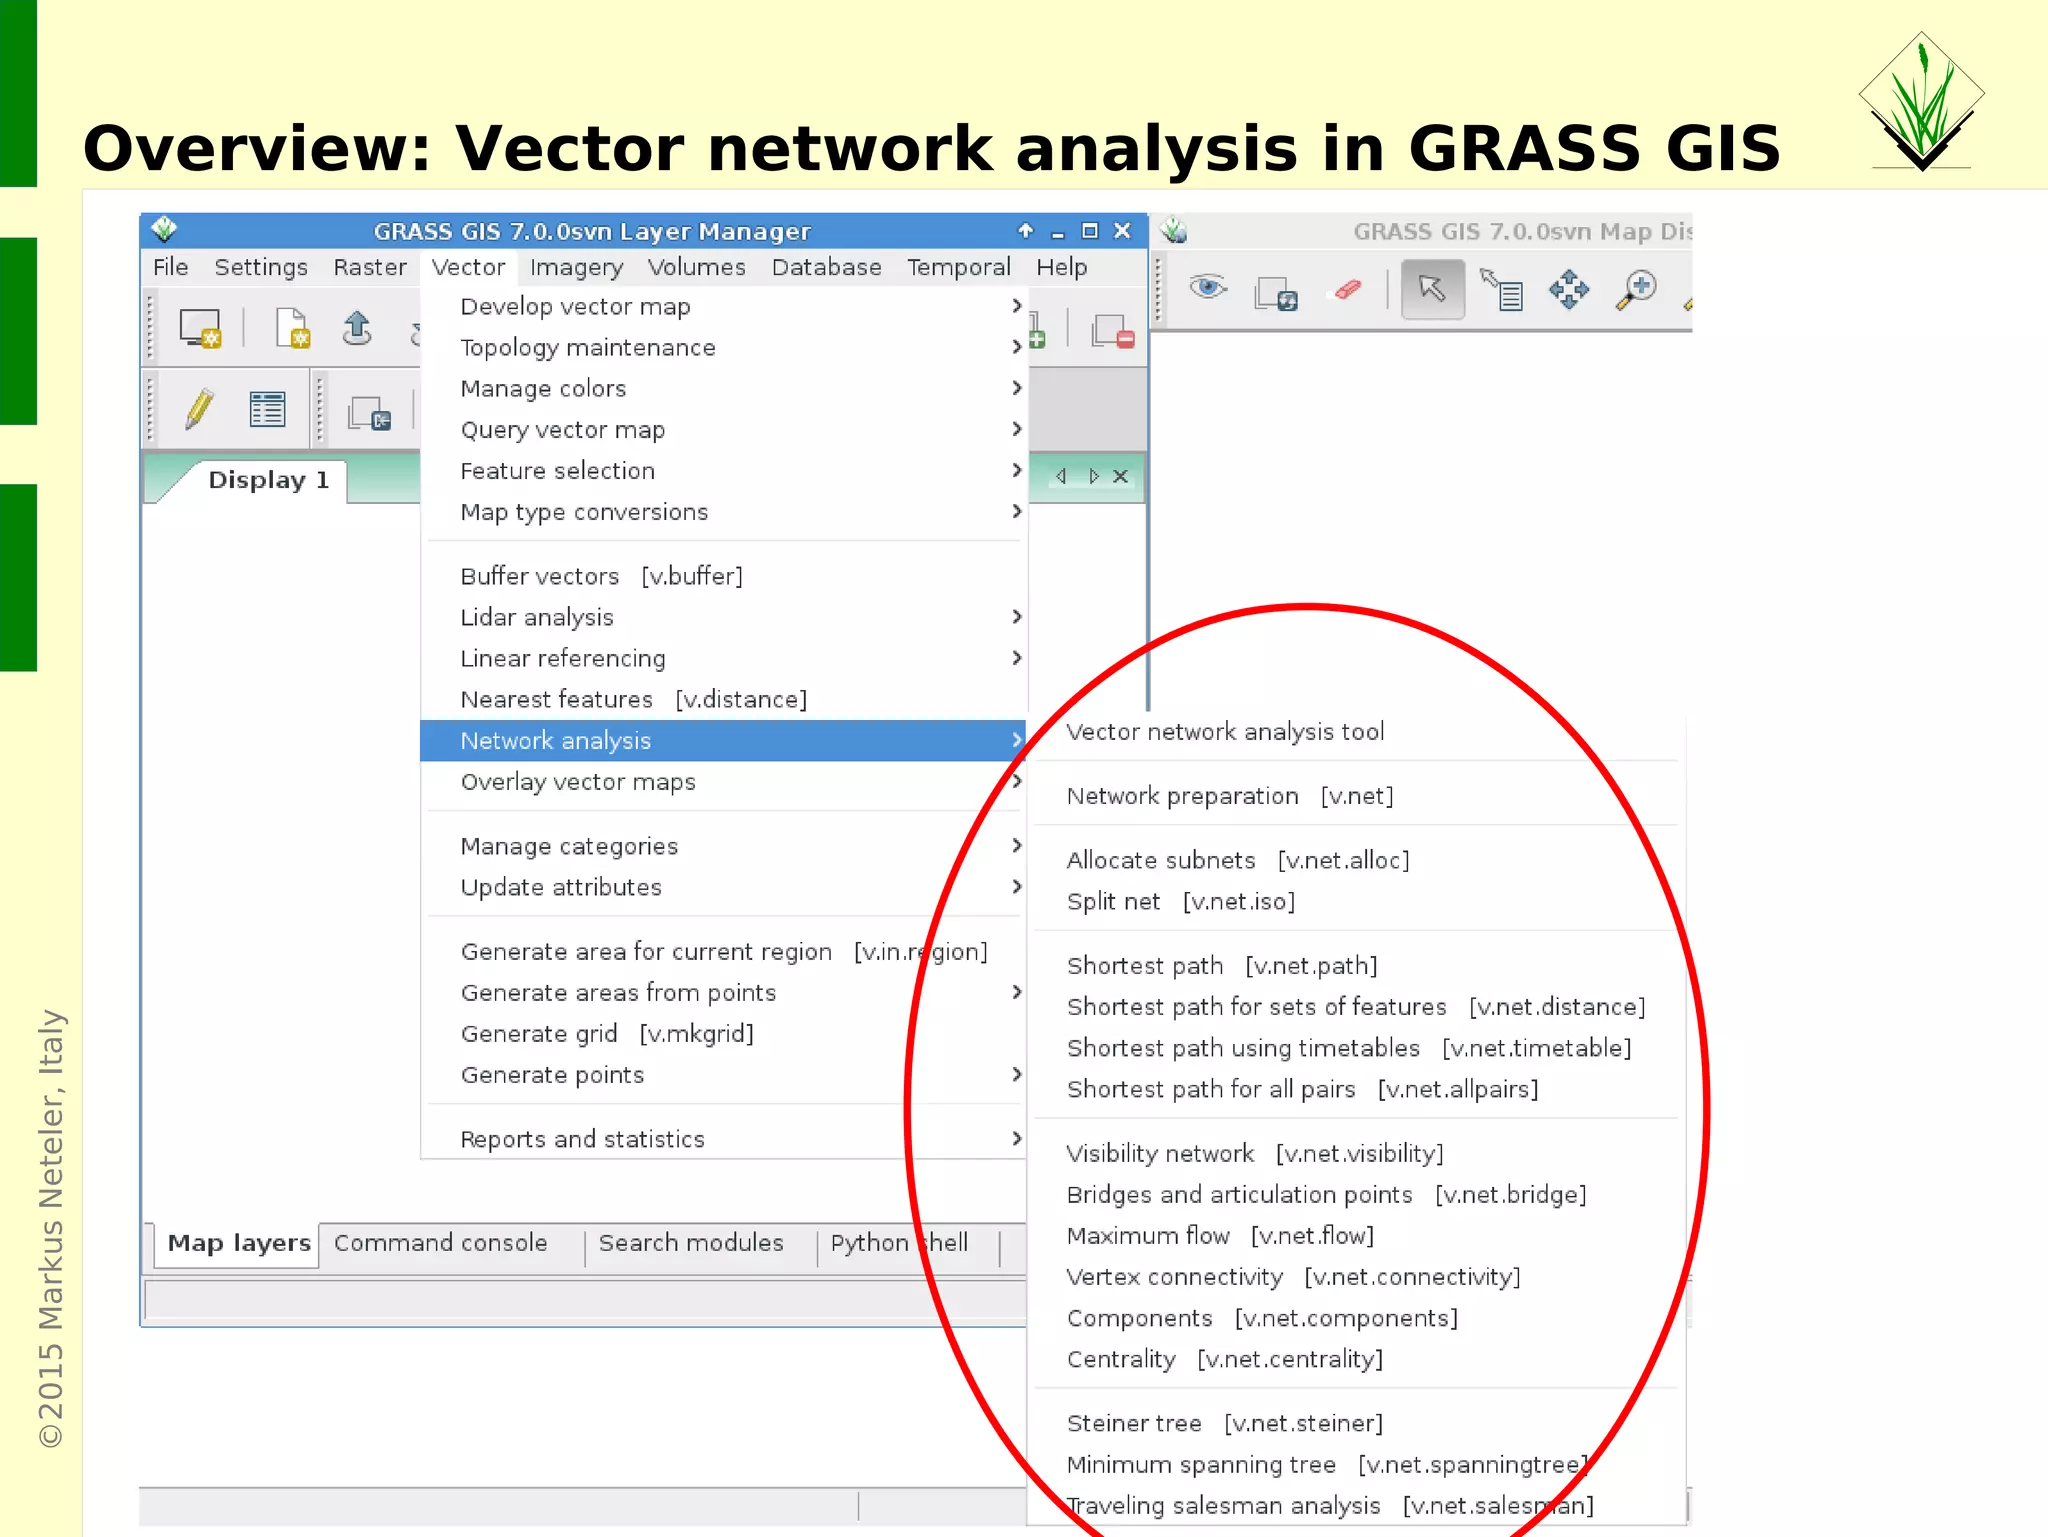
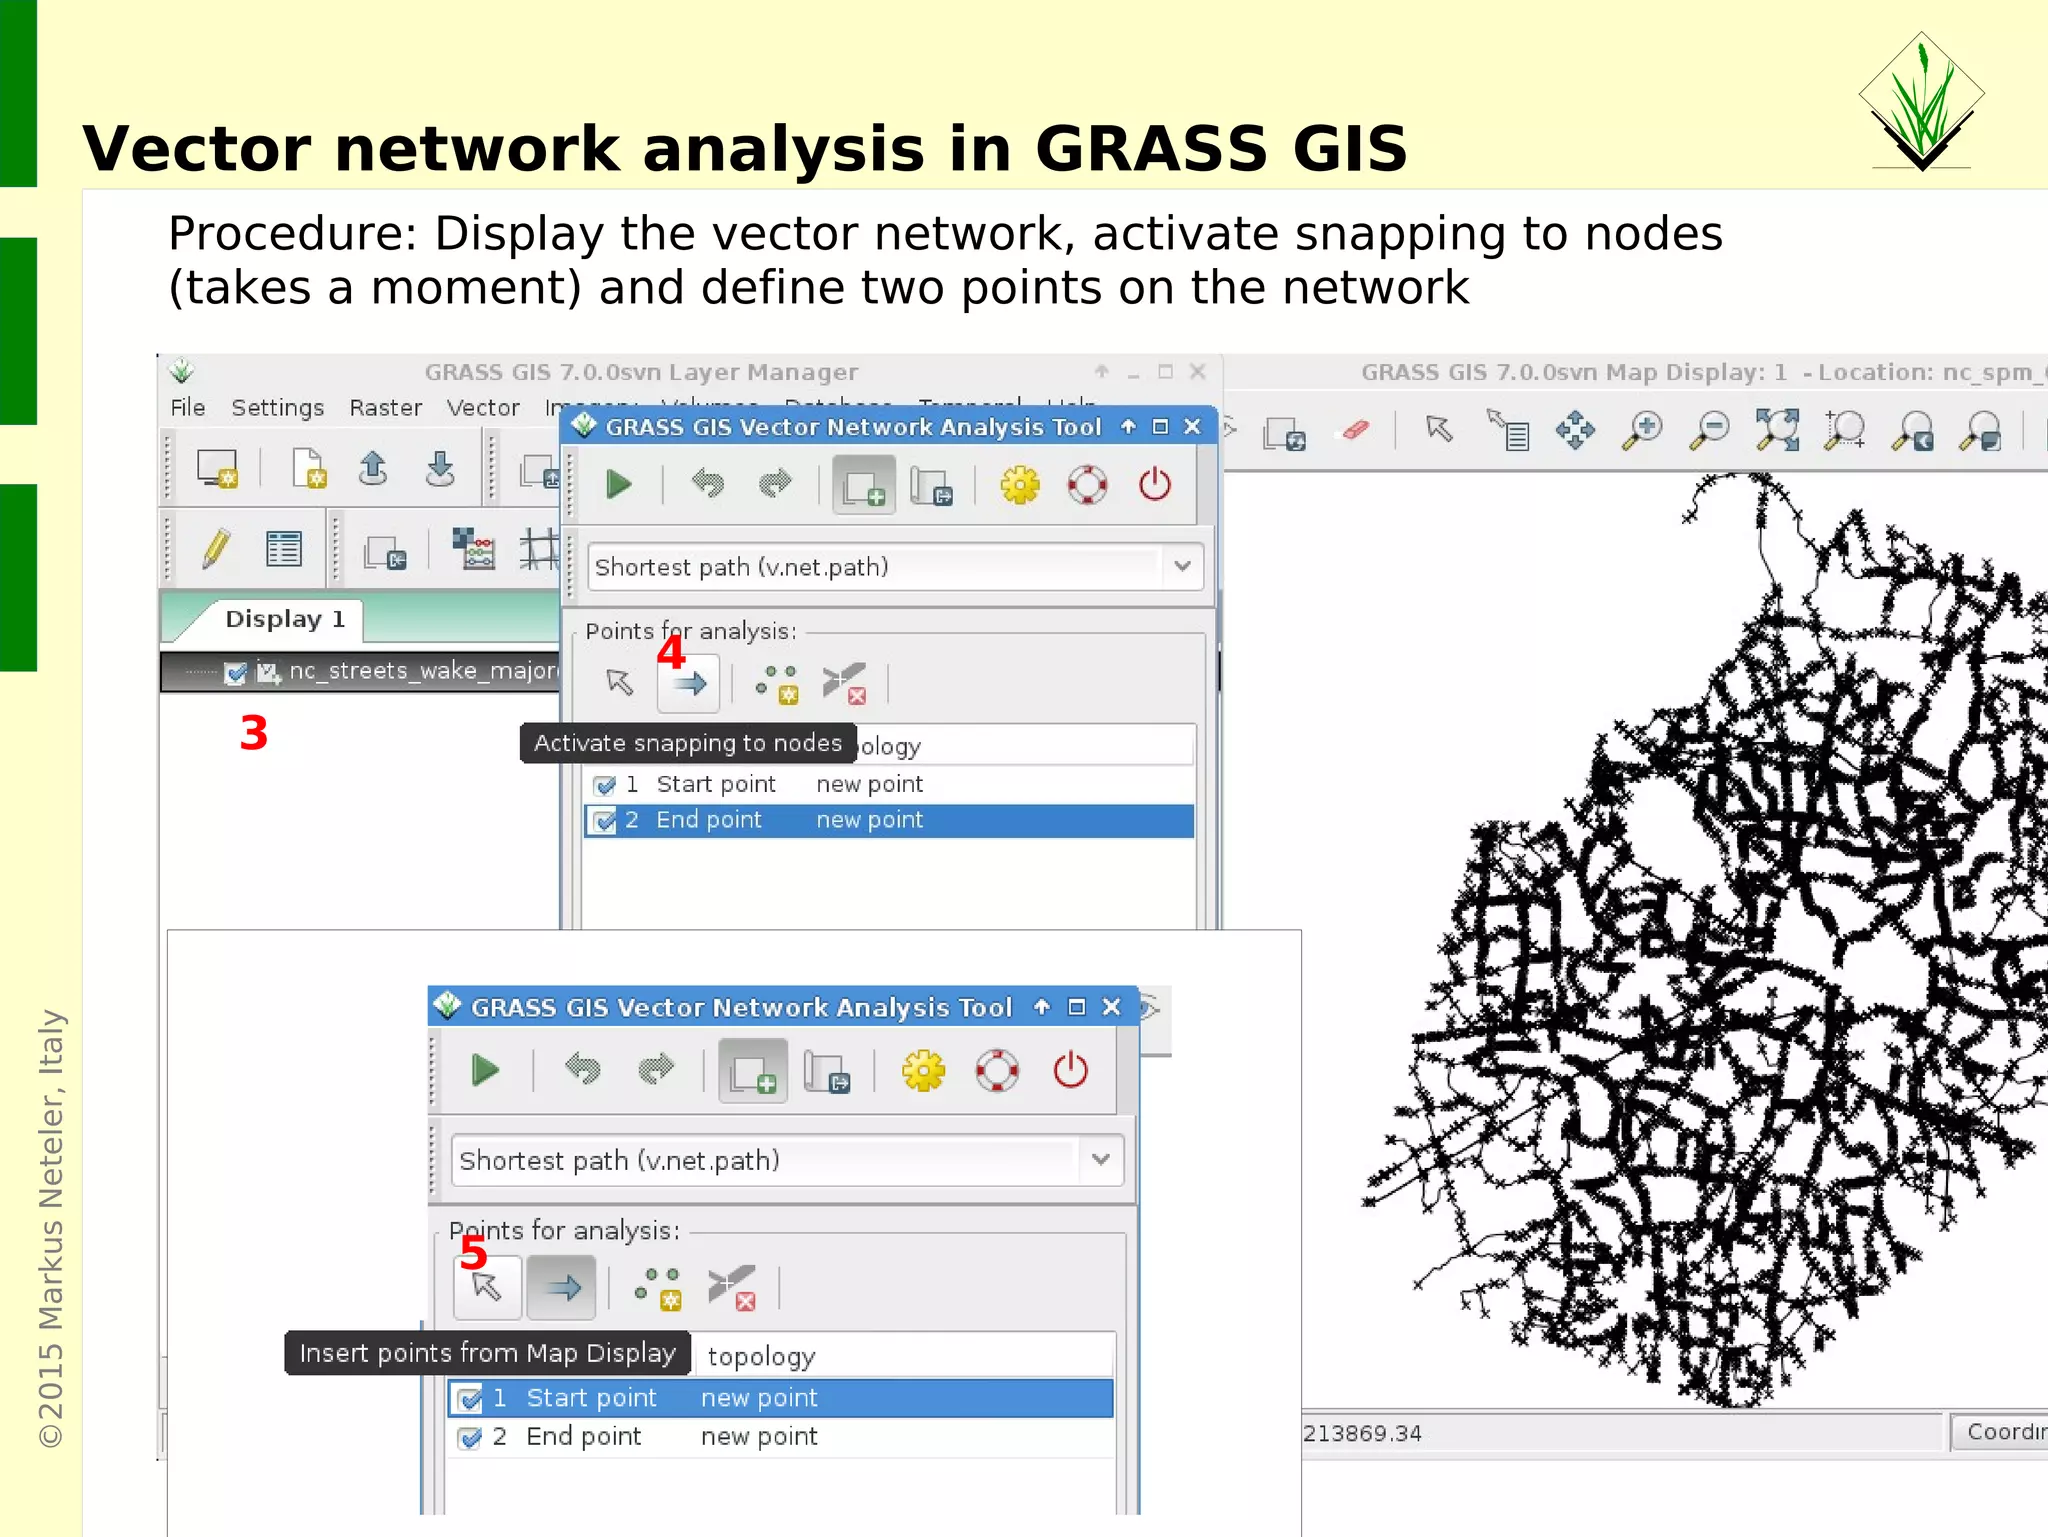
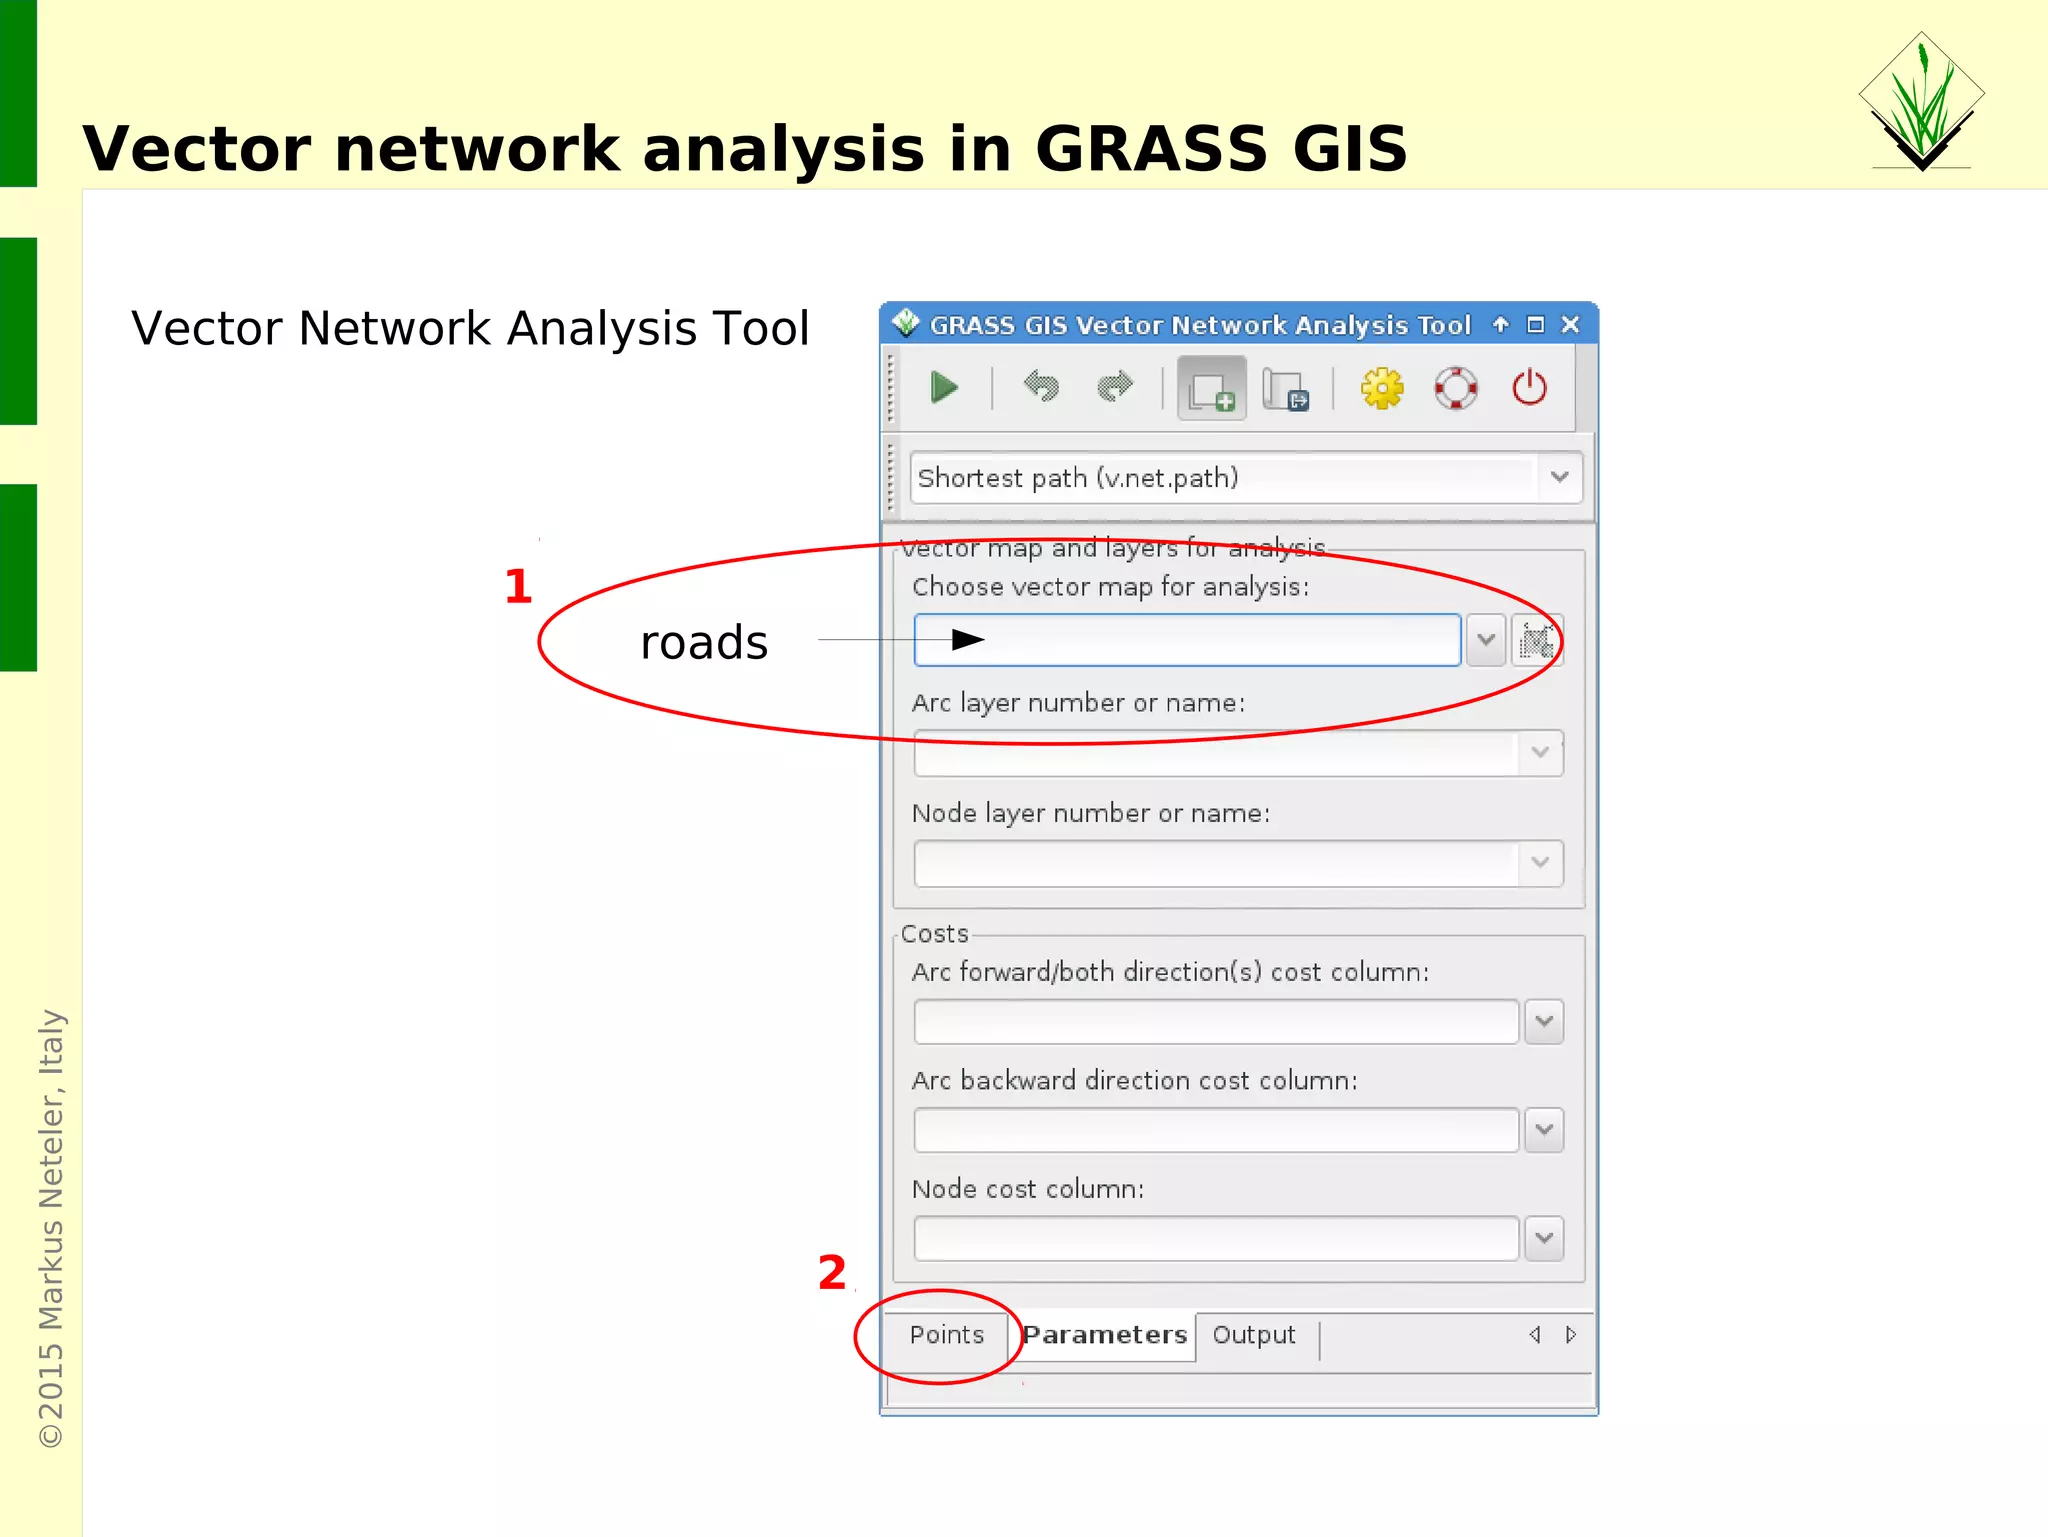
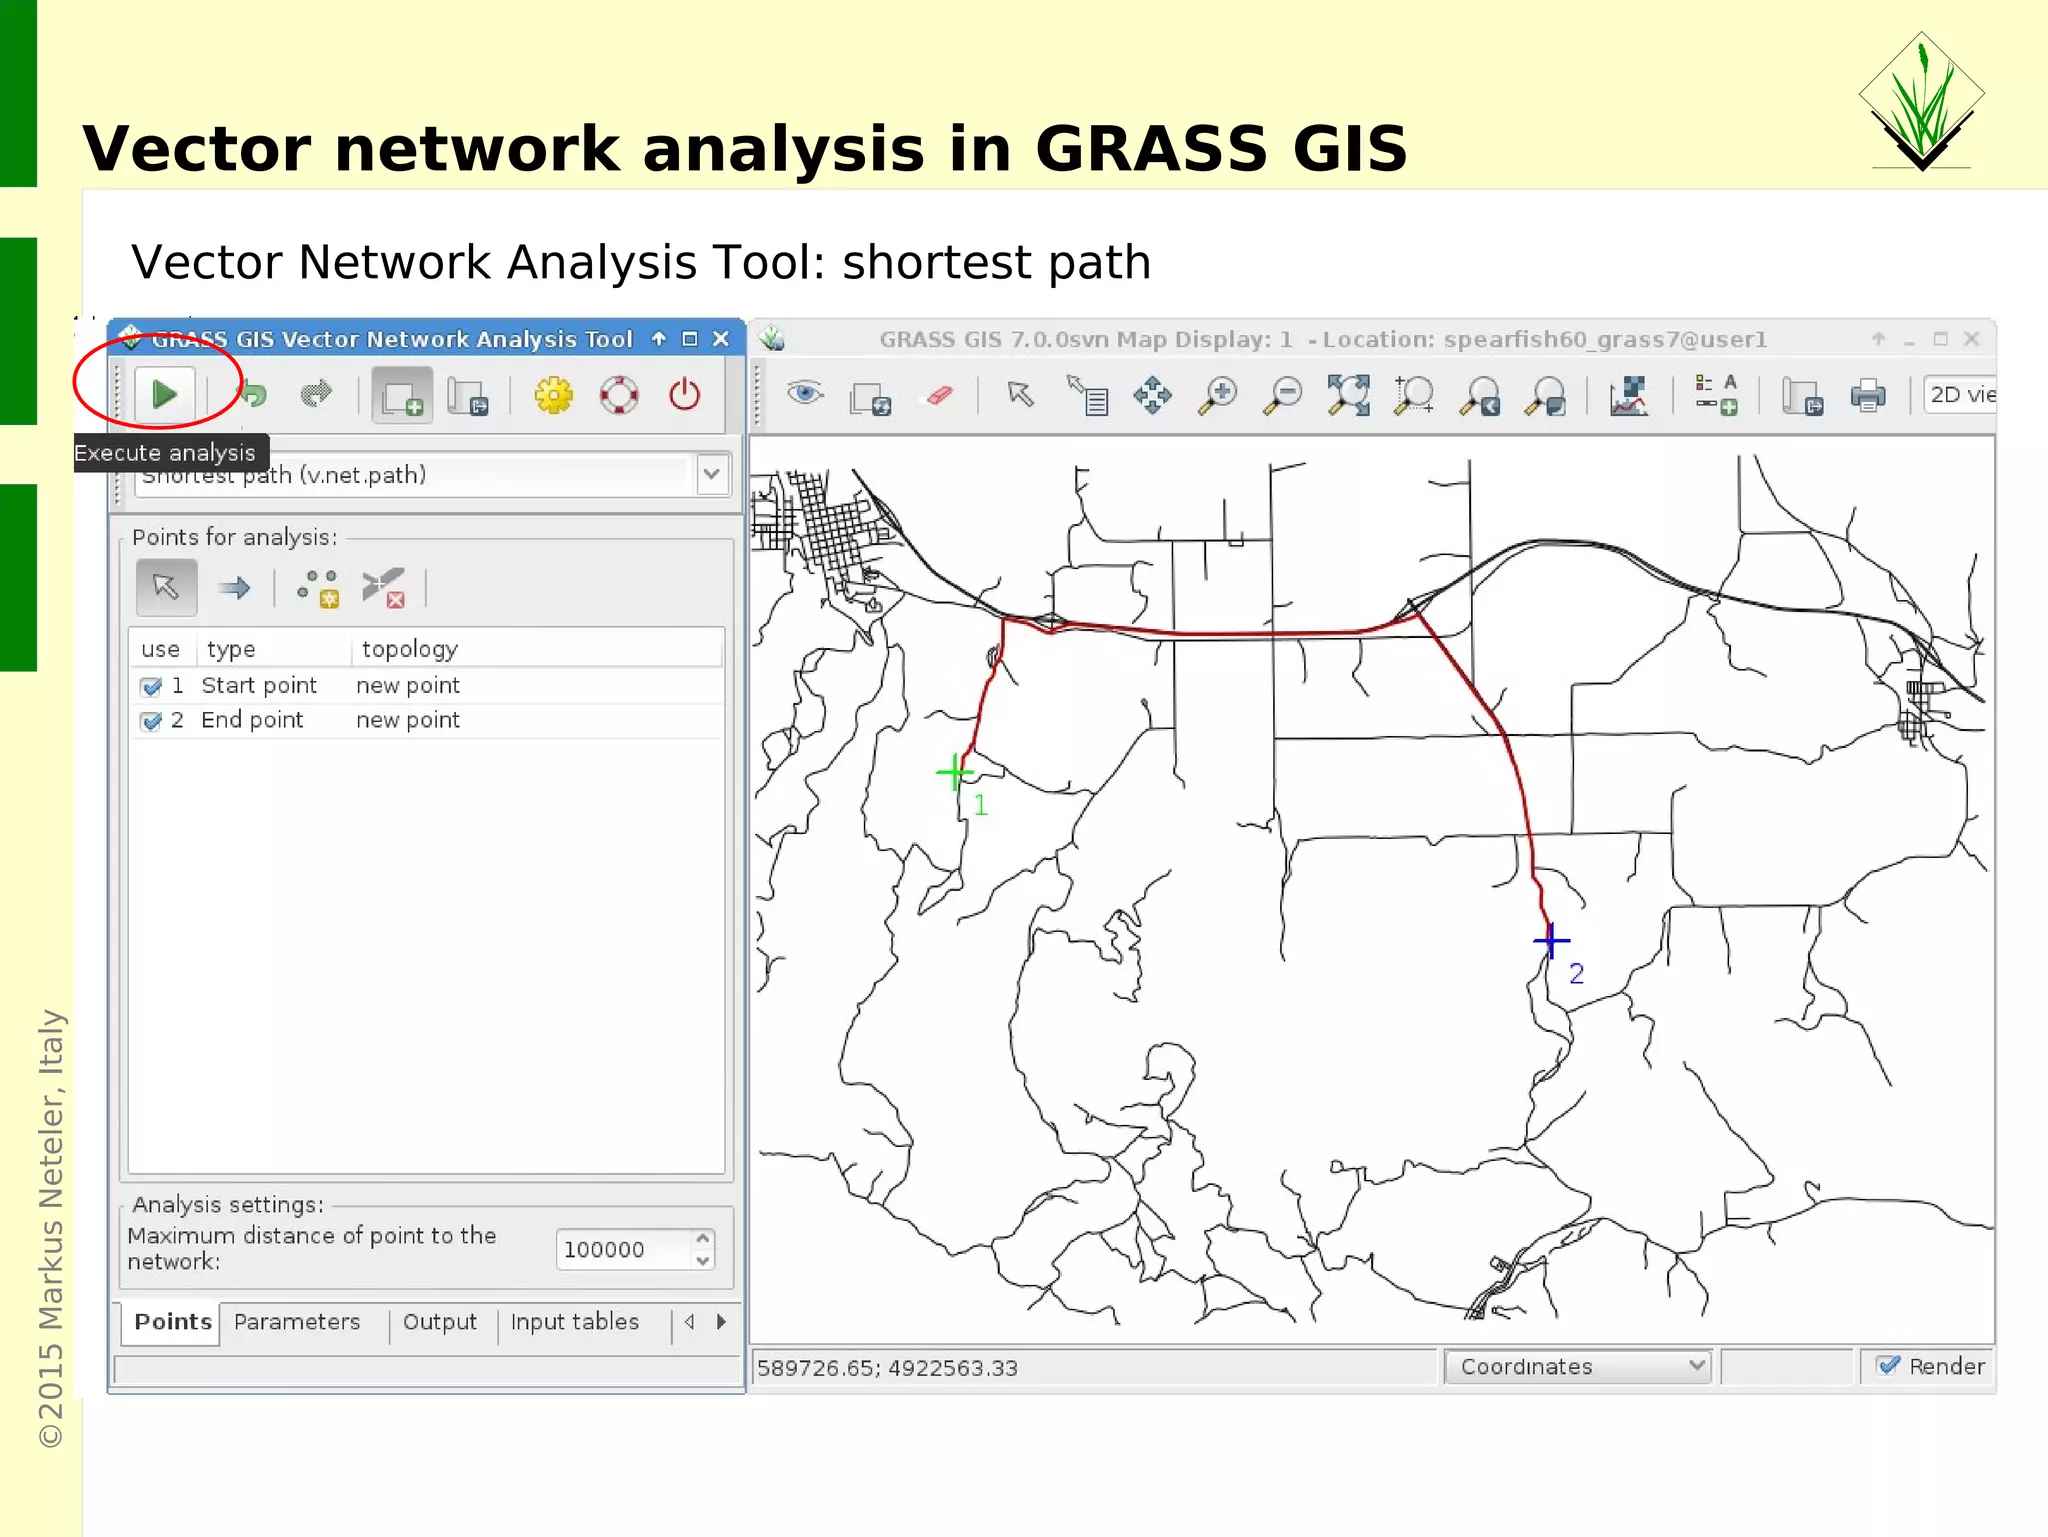
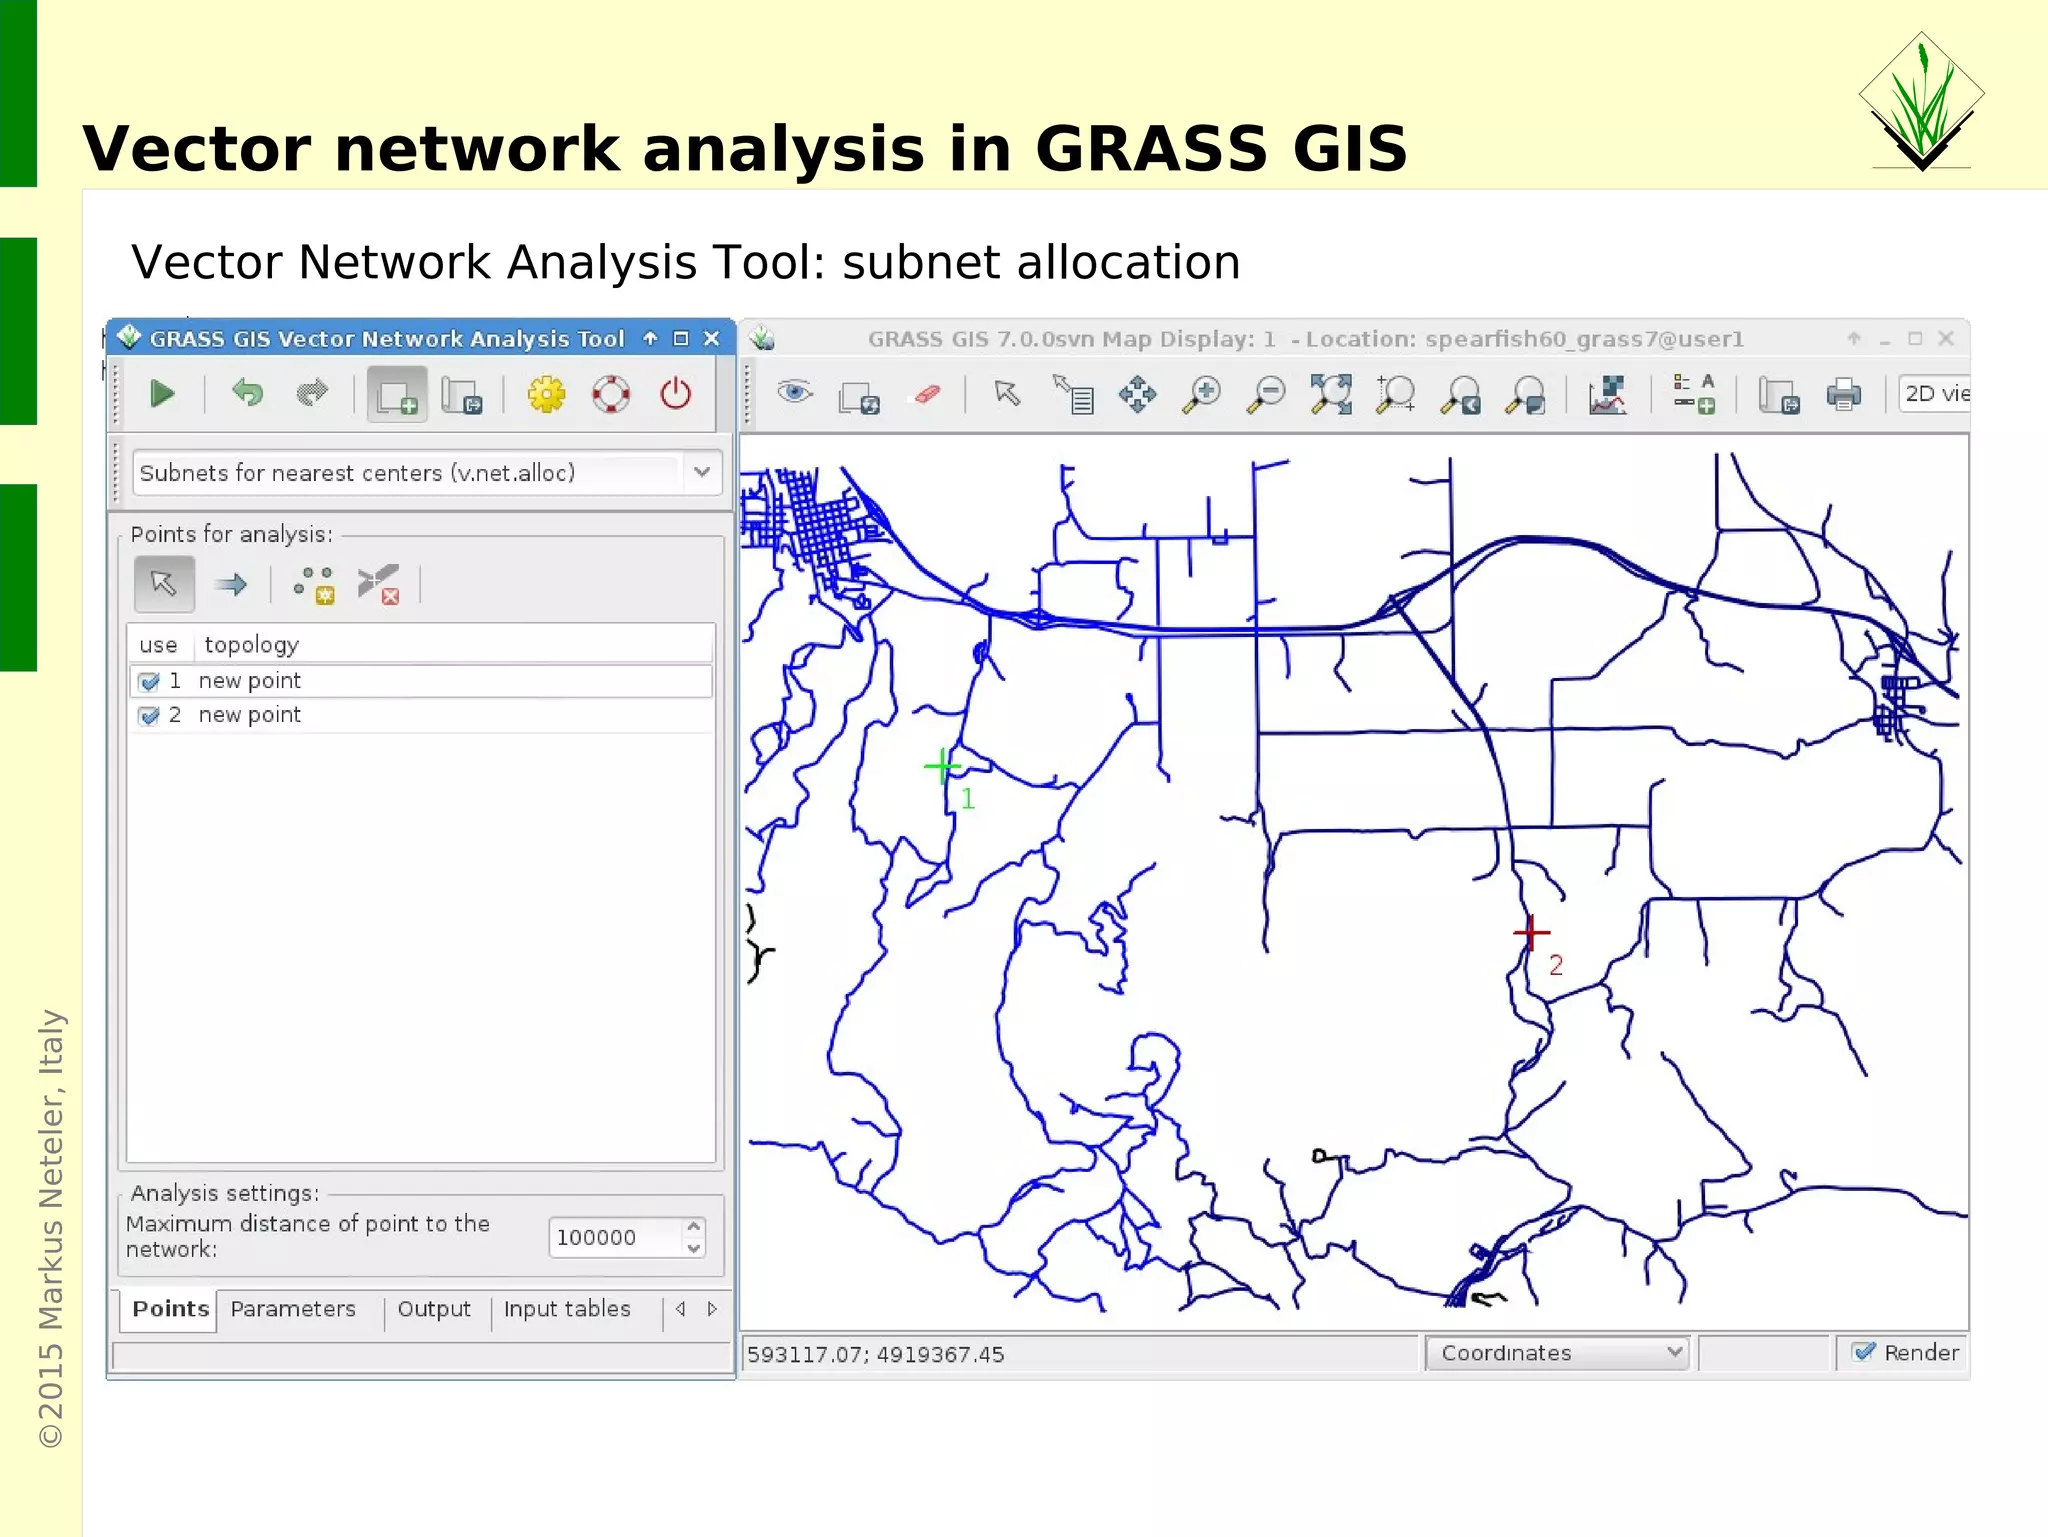
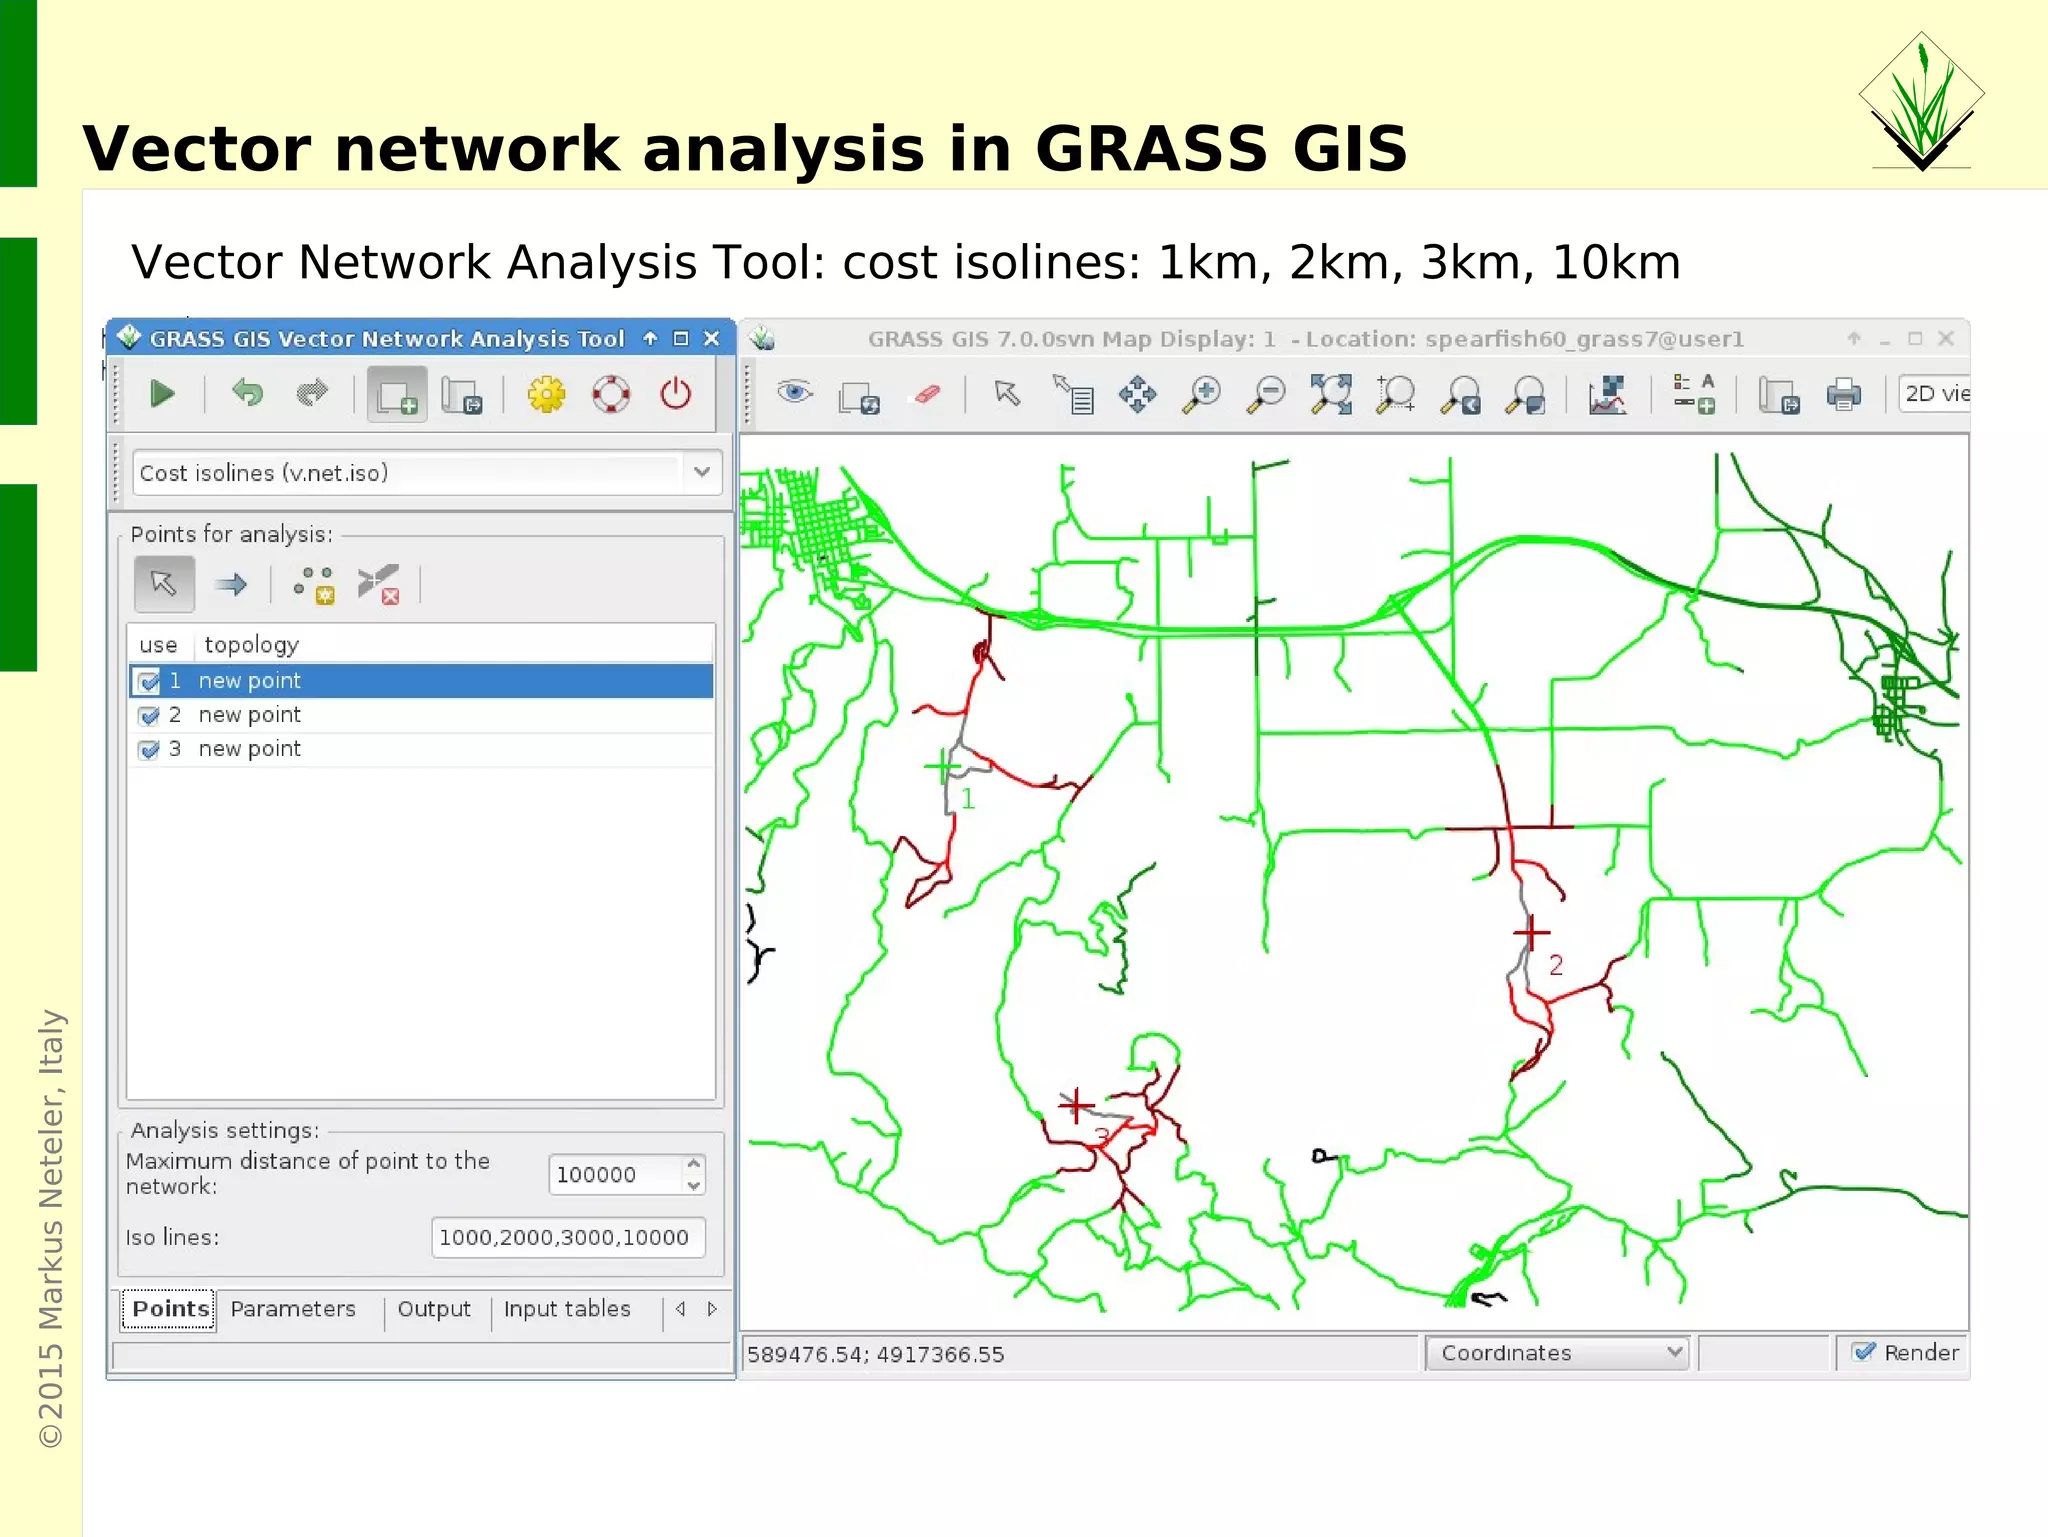
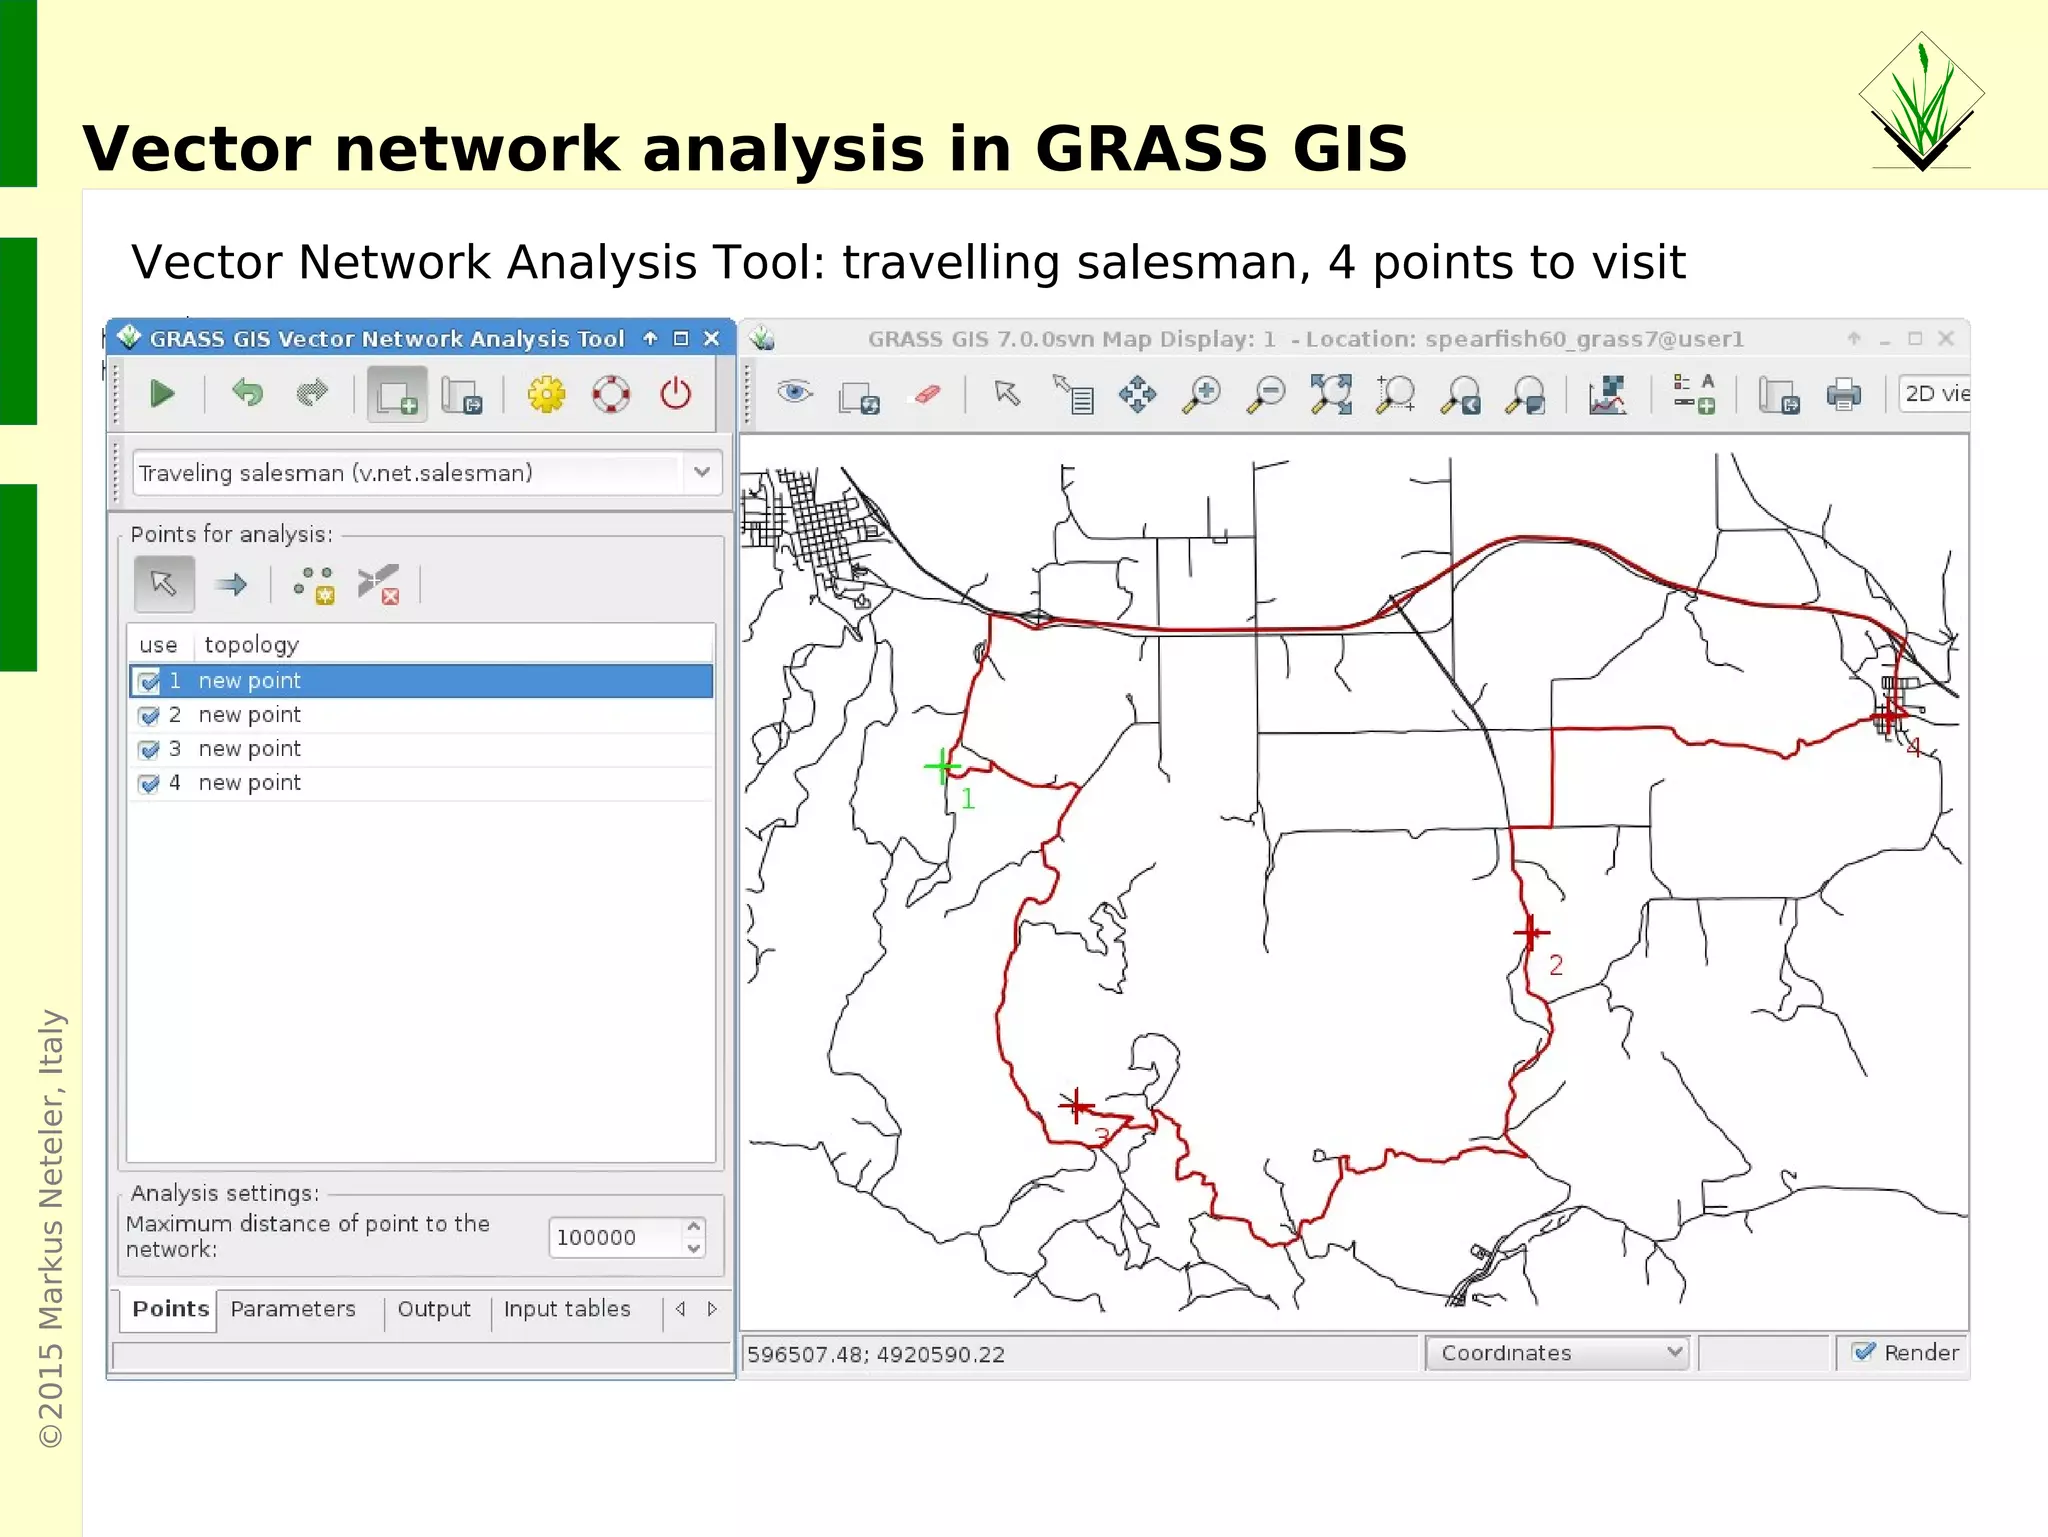
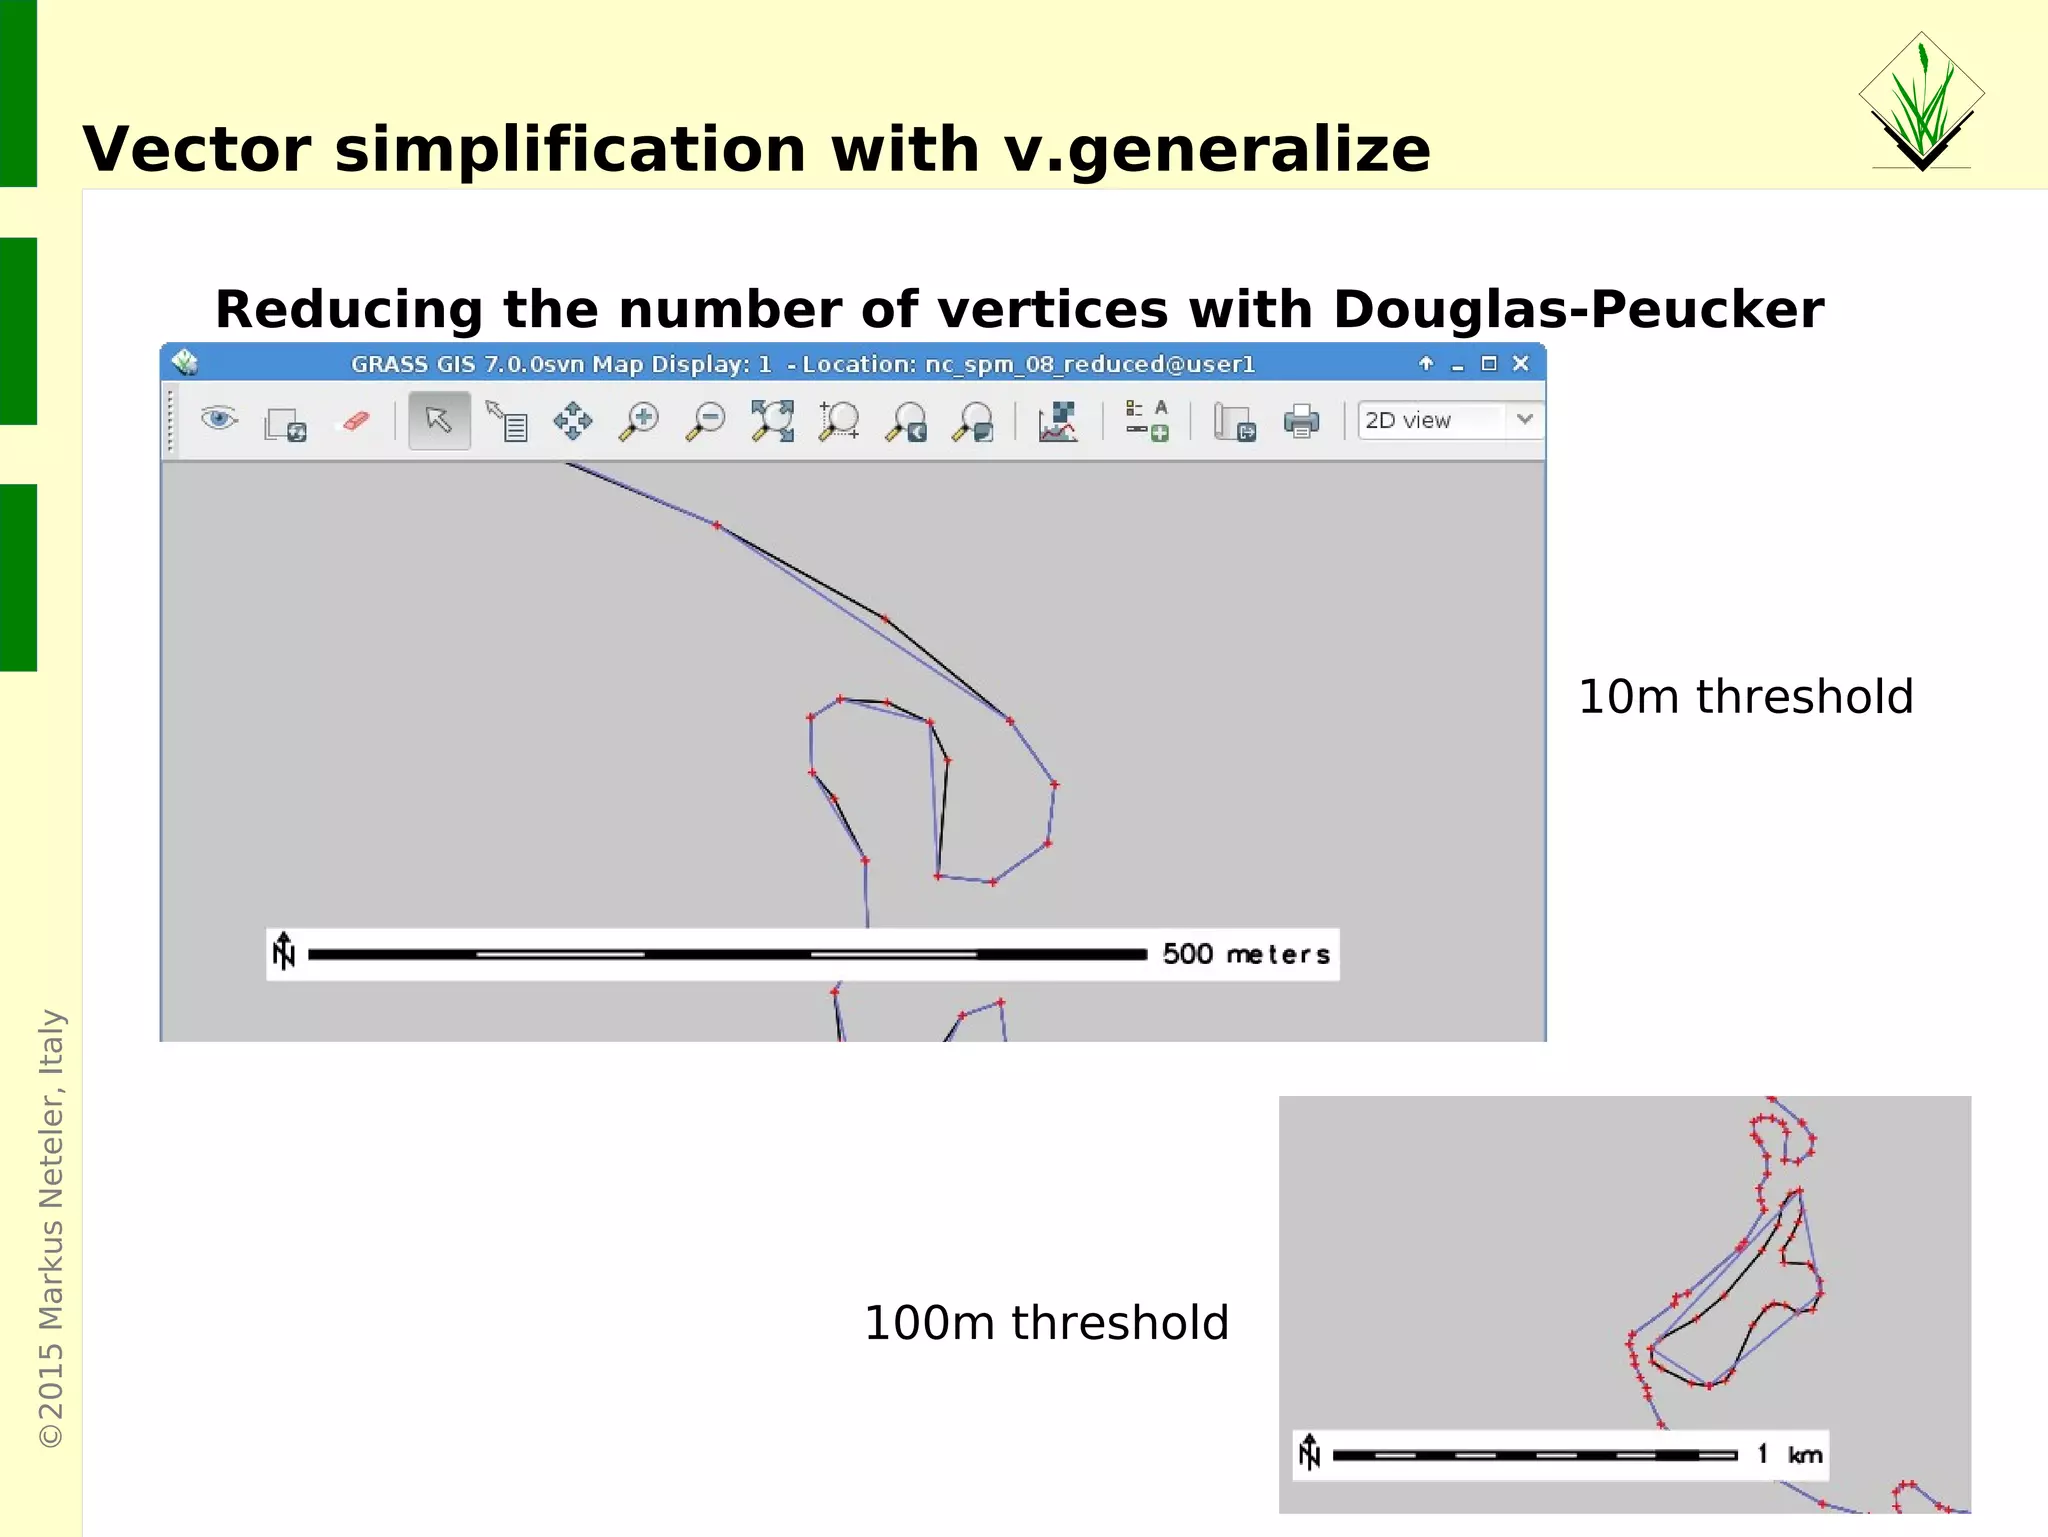
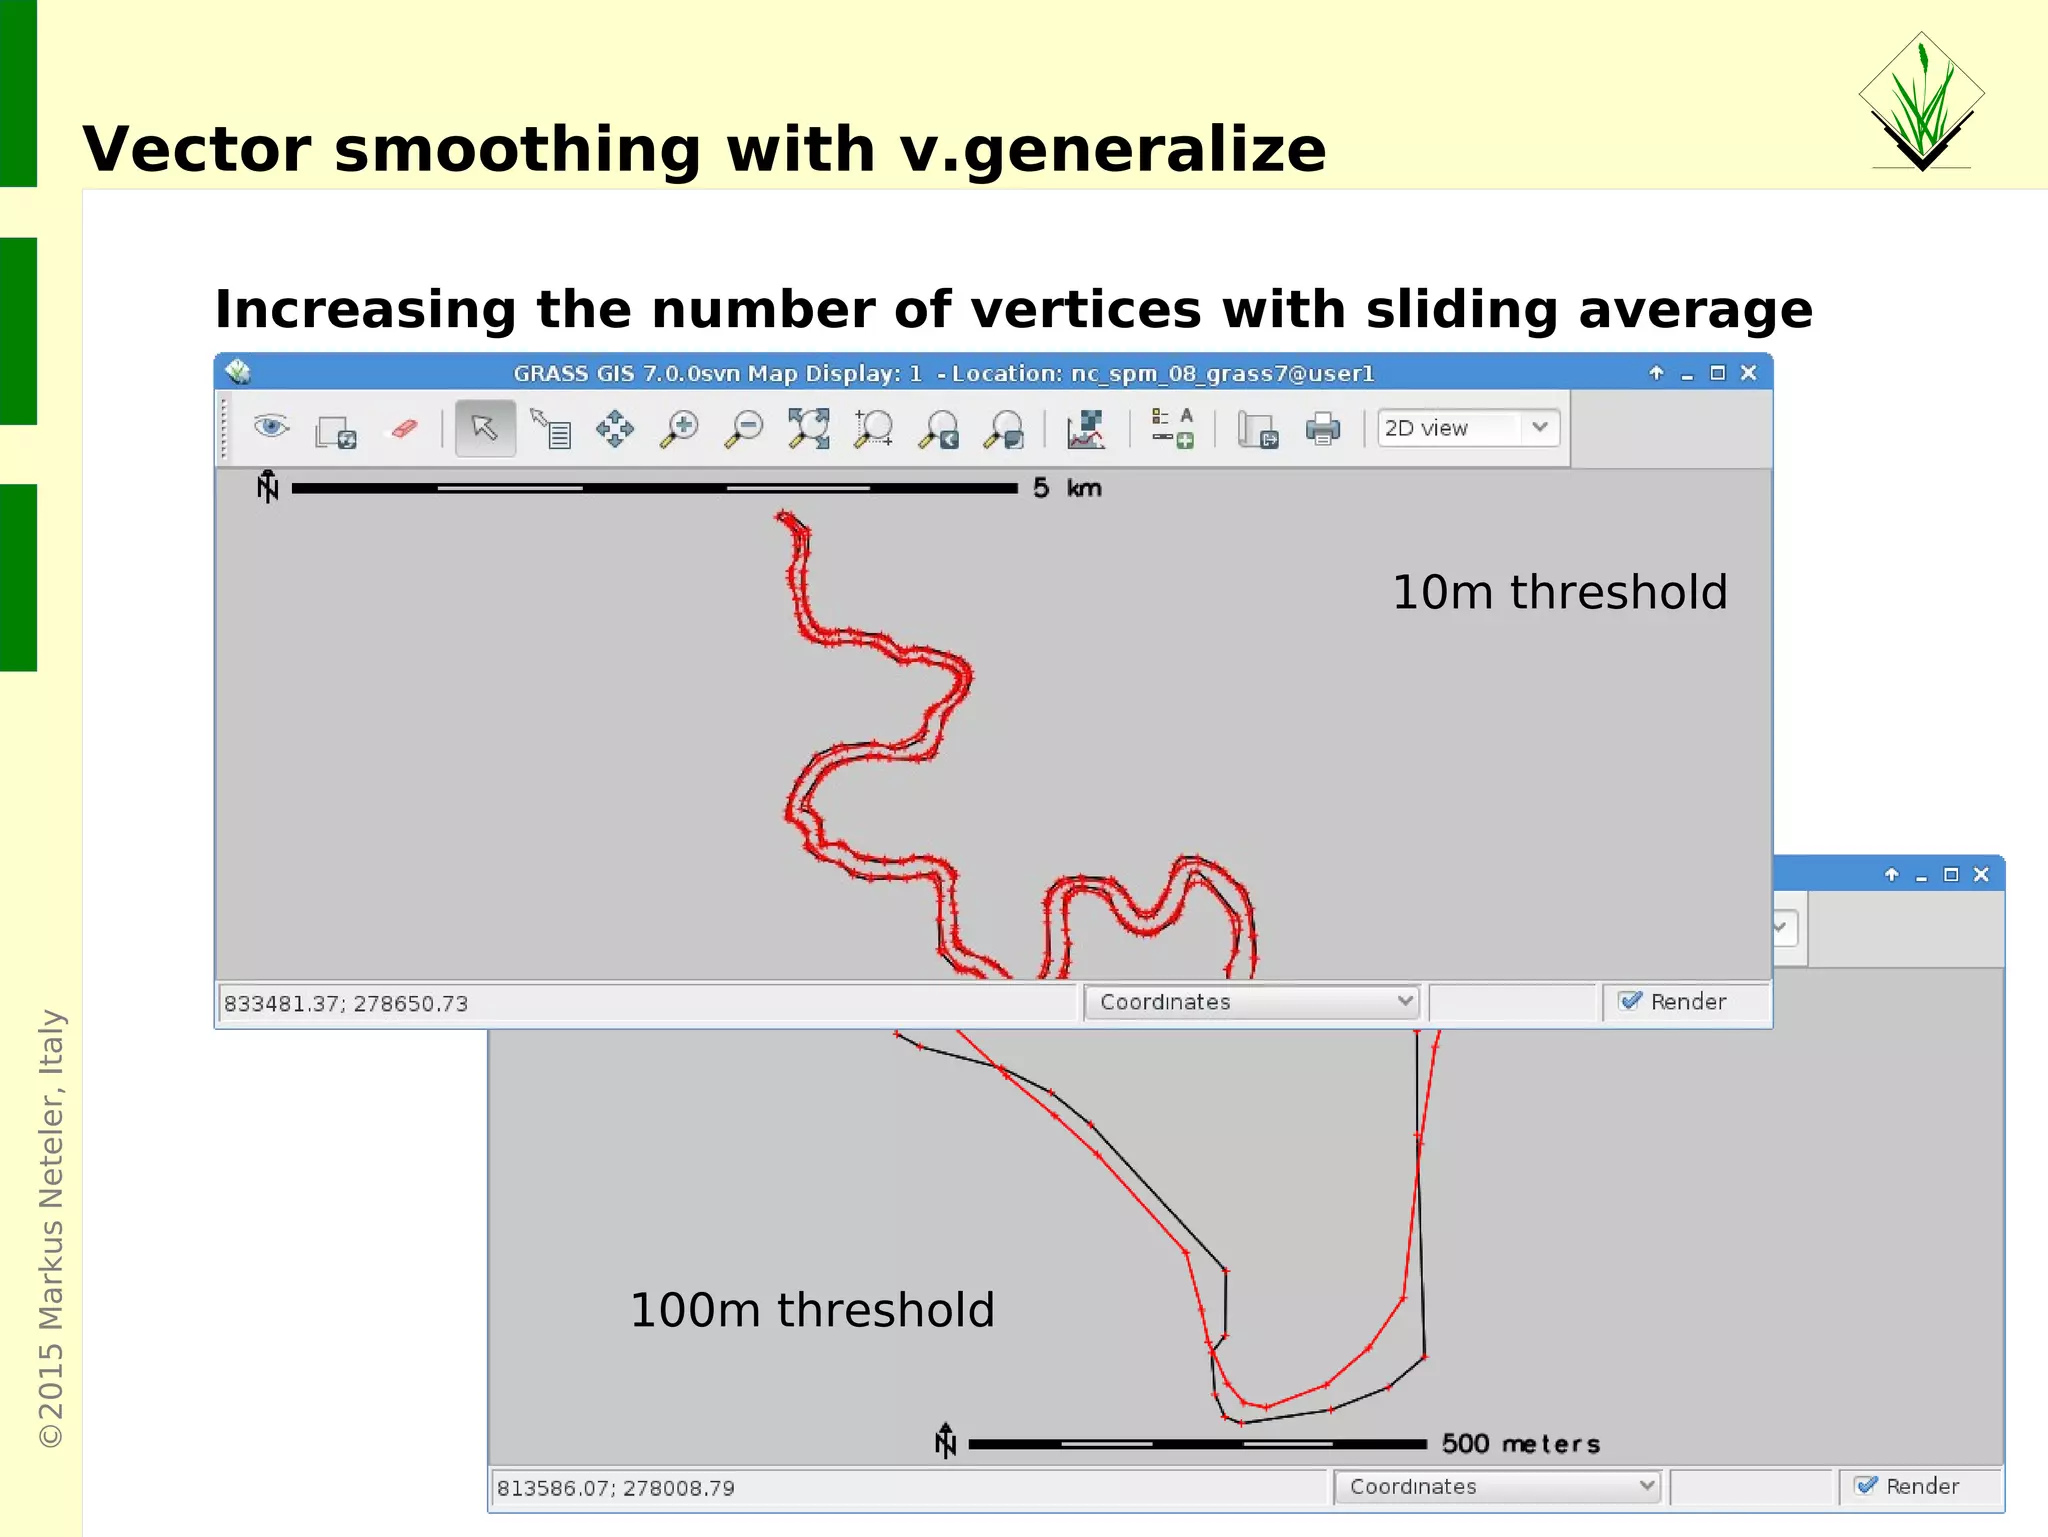
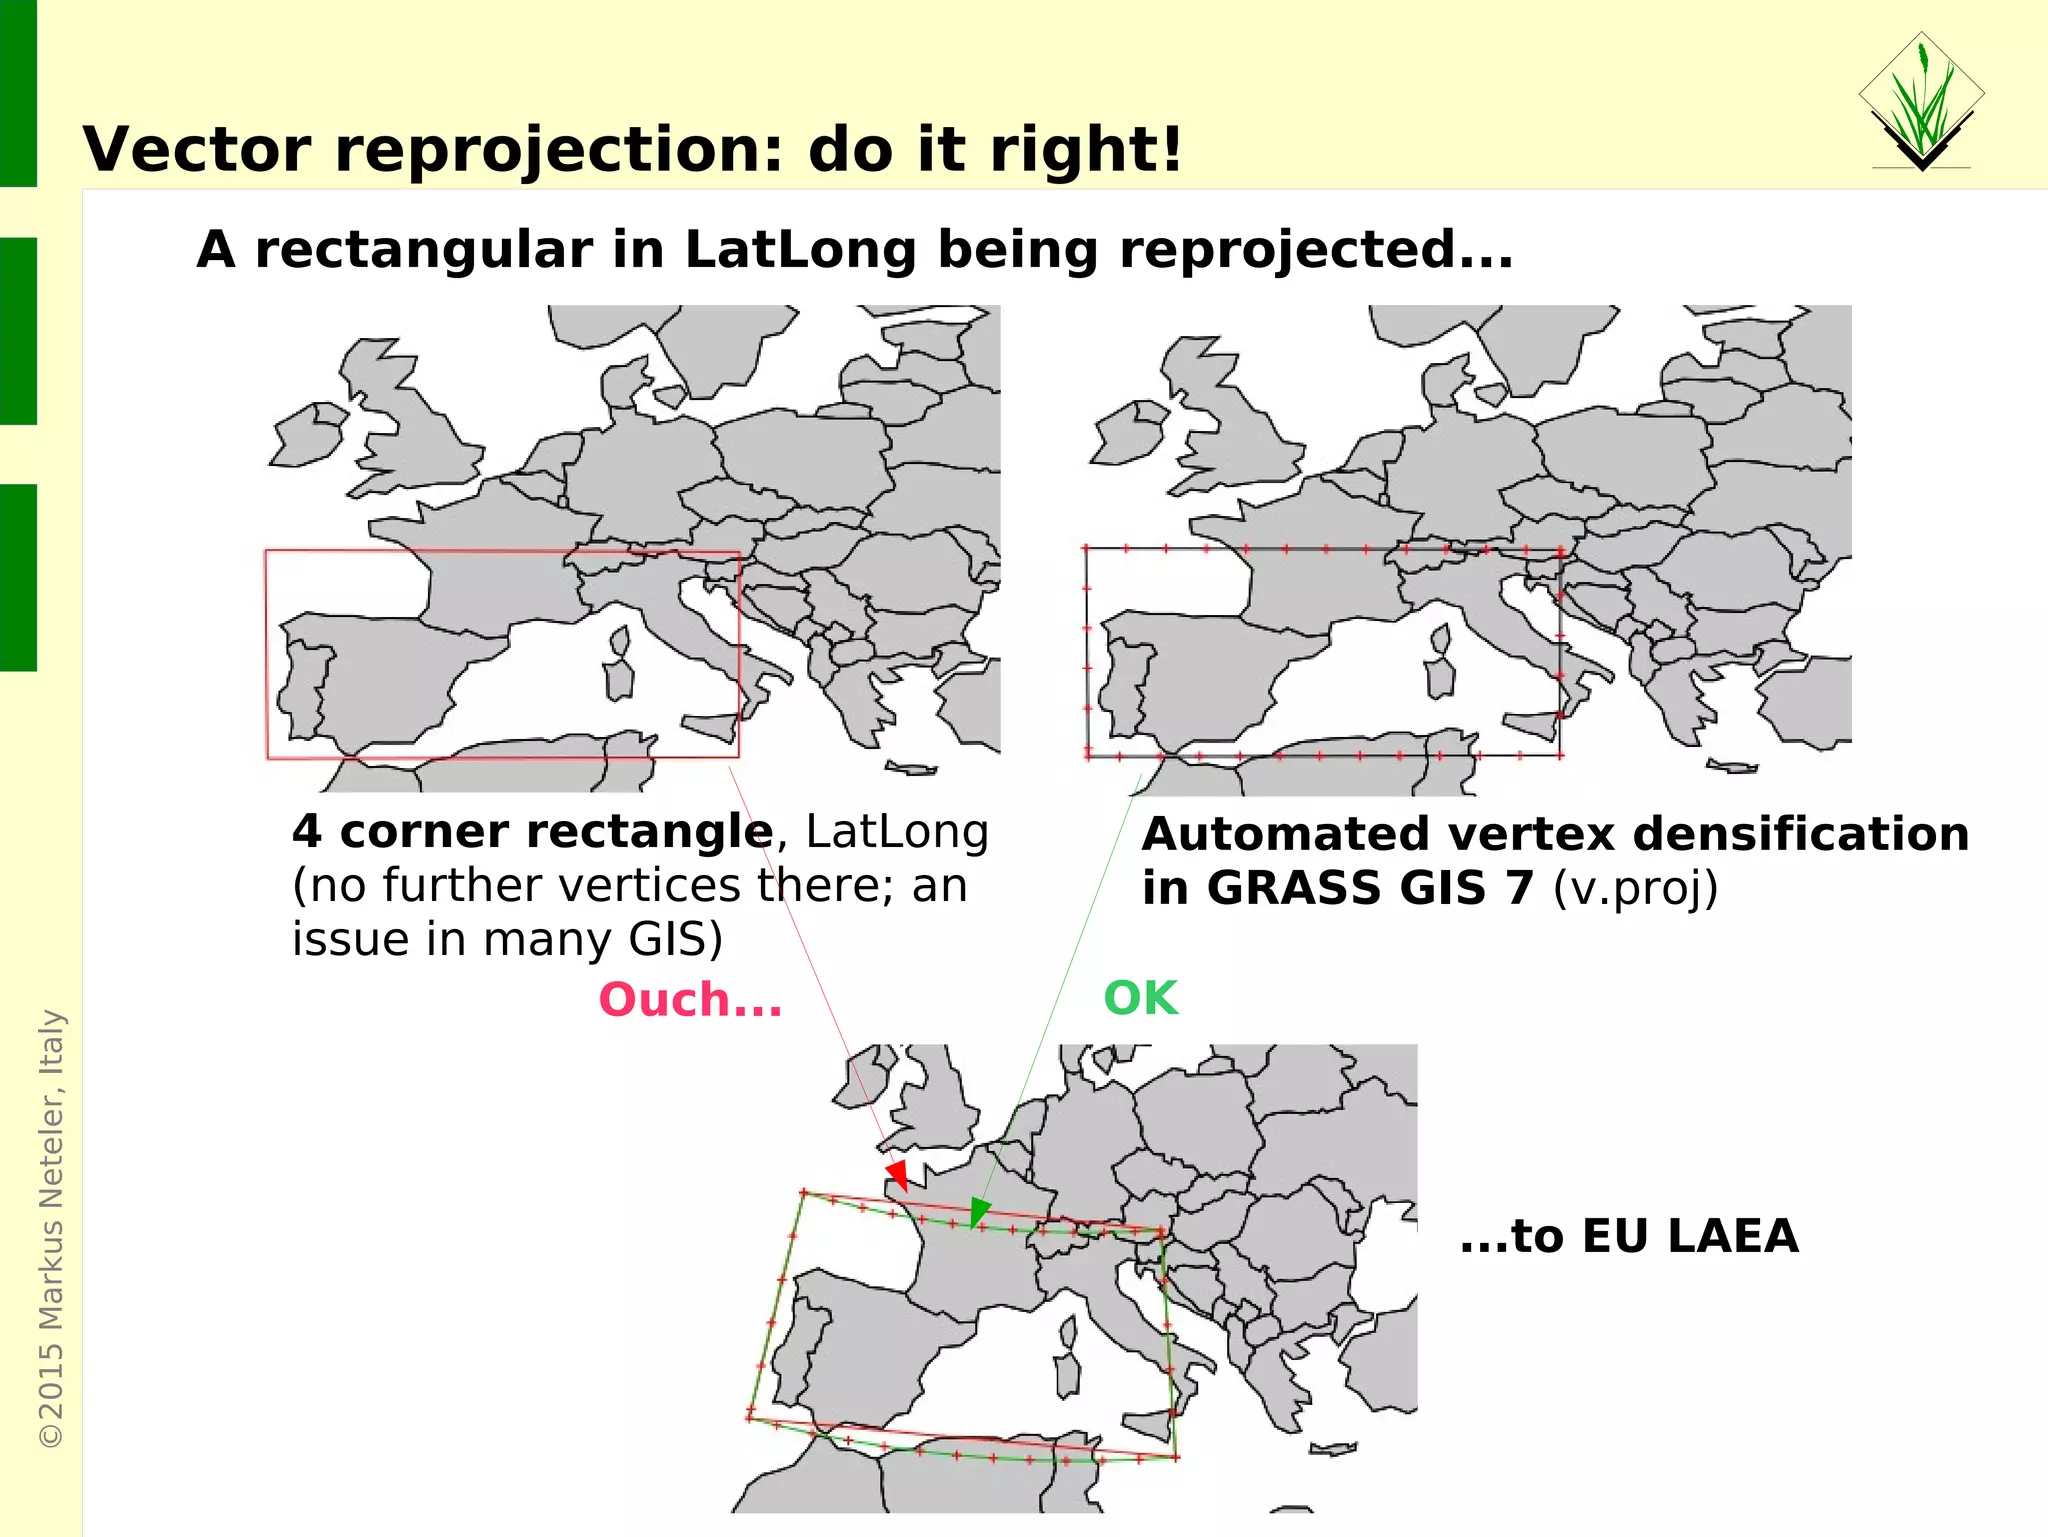
Vector network analysis features, shortest path calculations, subnet allocation, cost isolines, and vector simplification techniques.
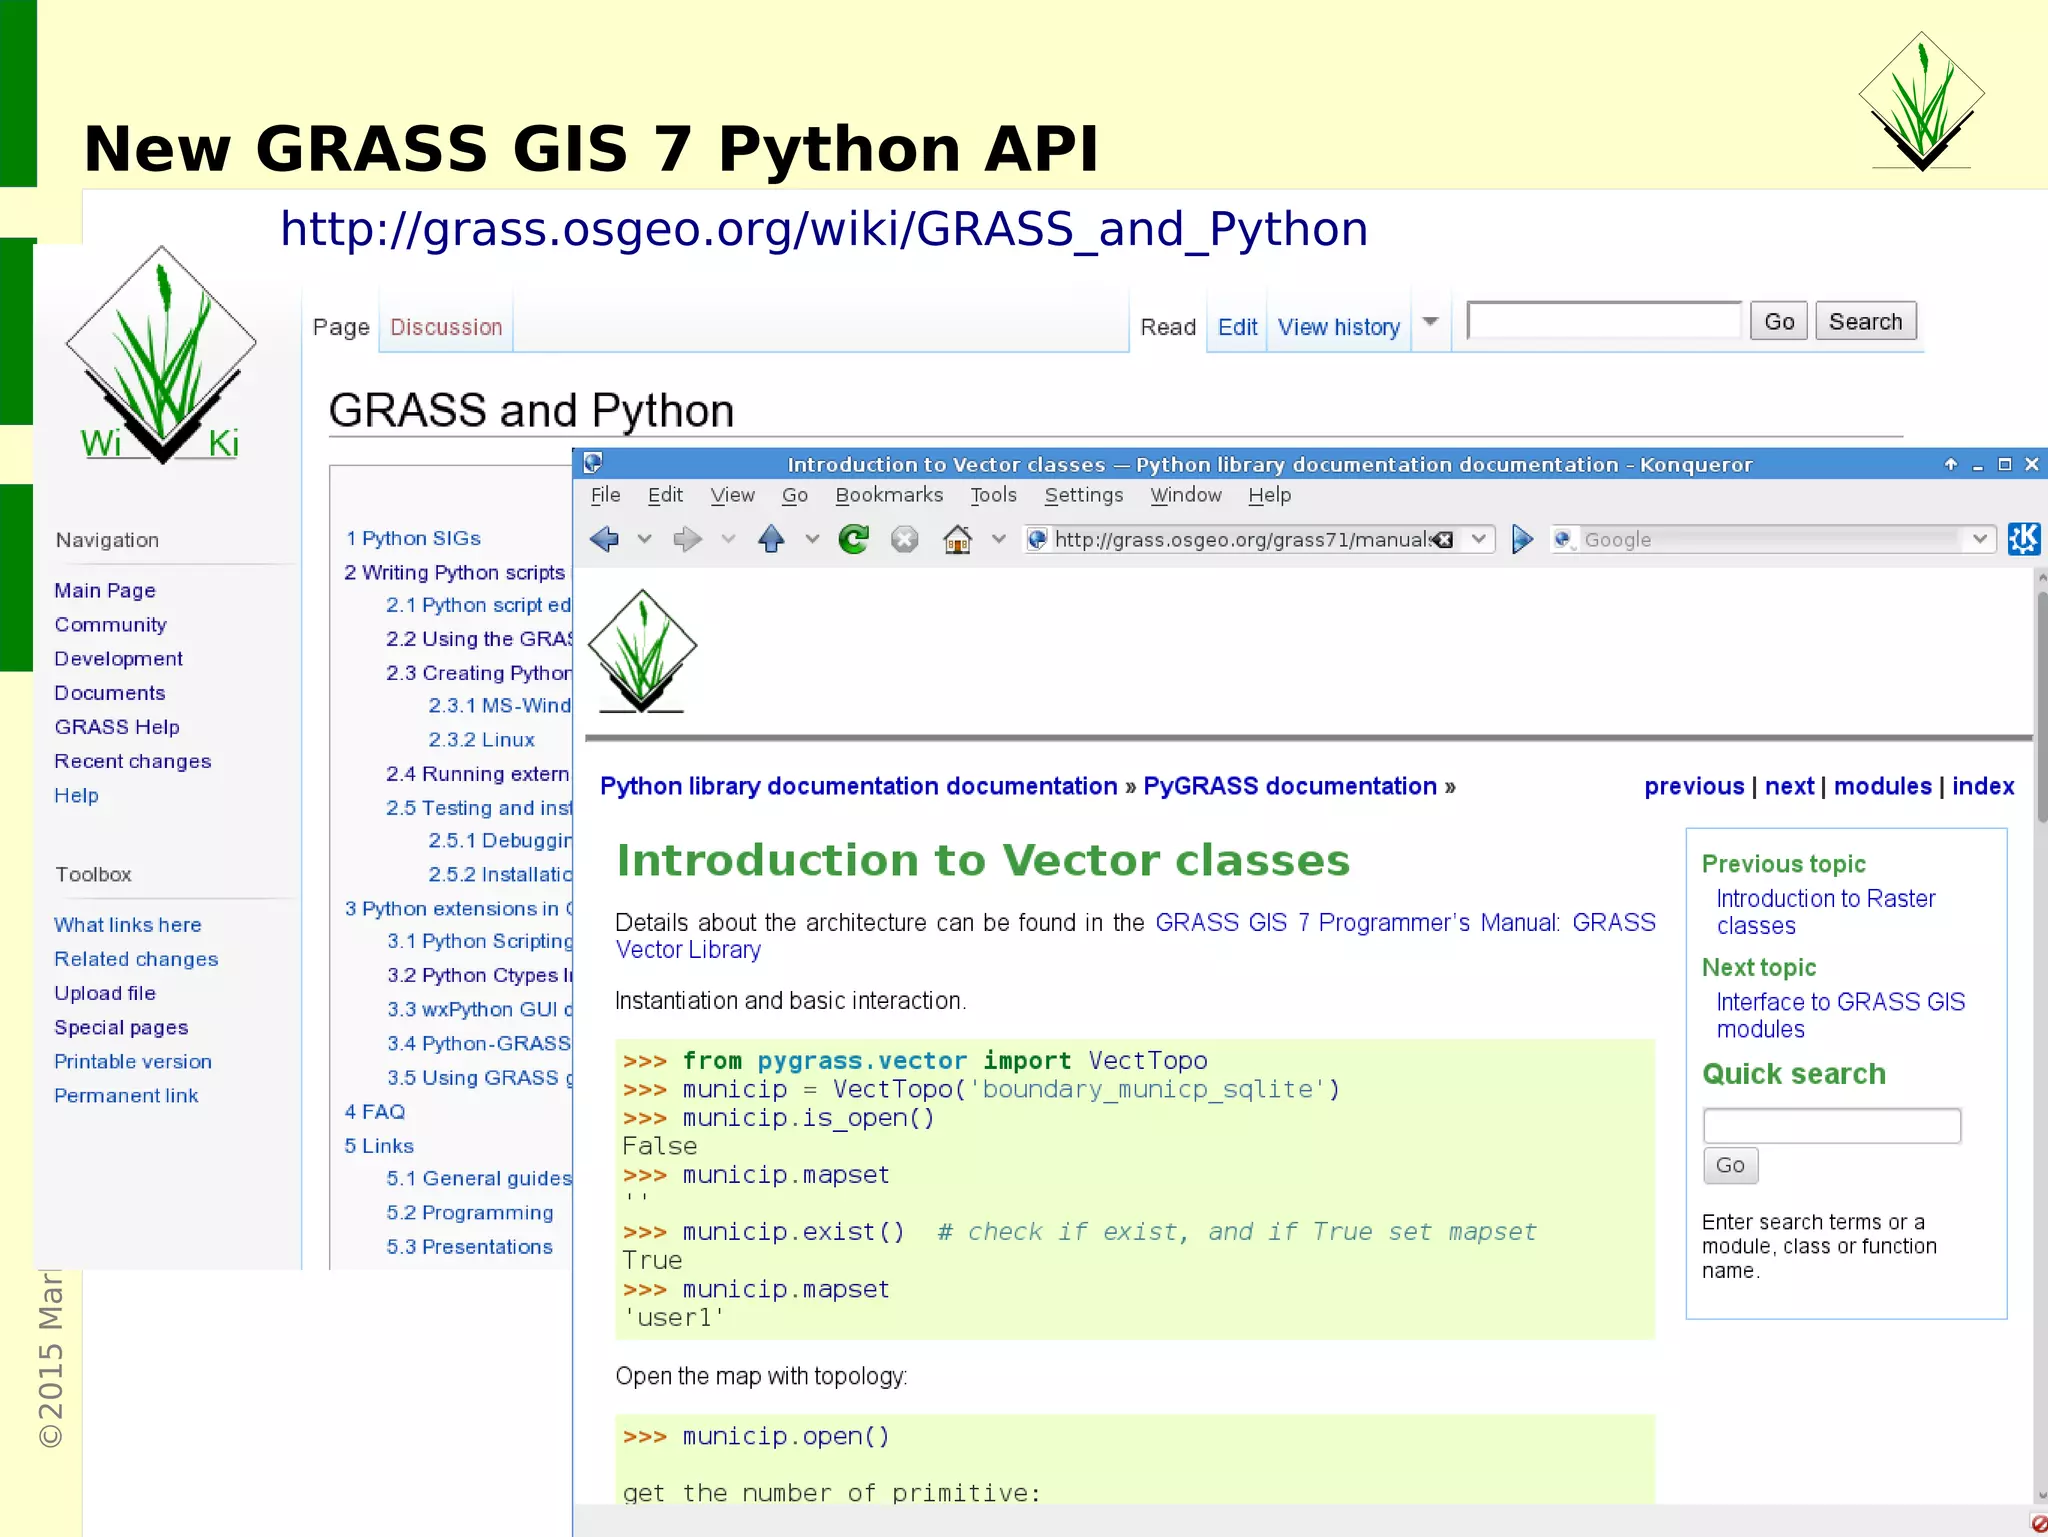
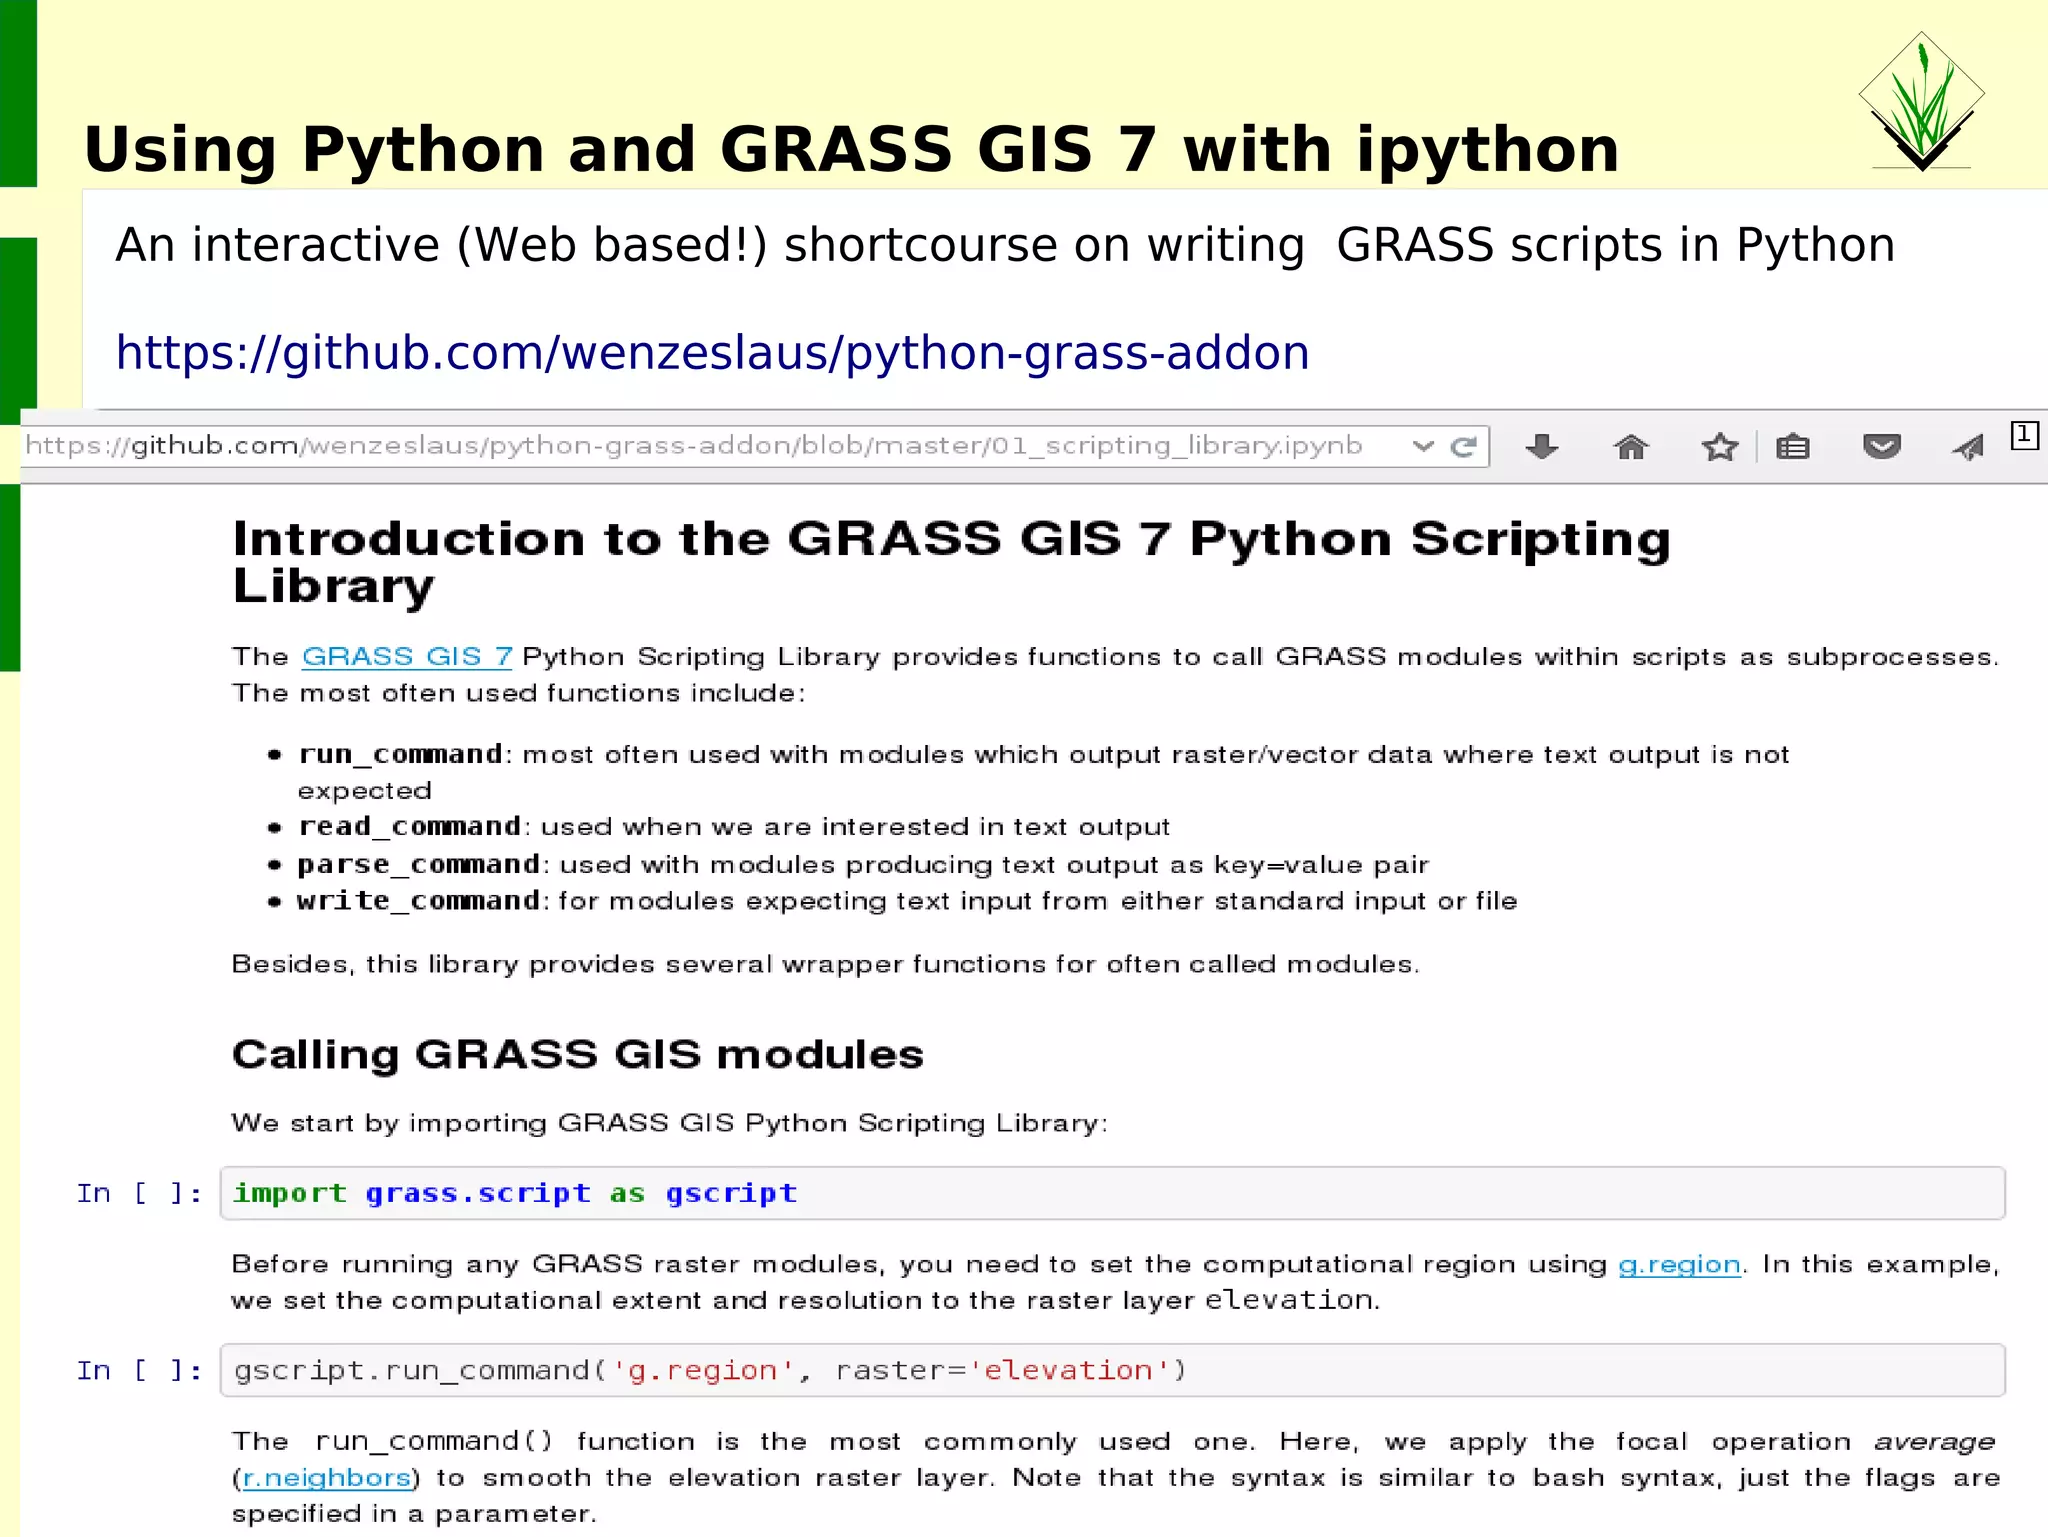
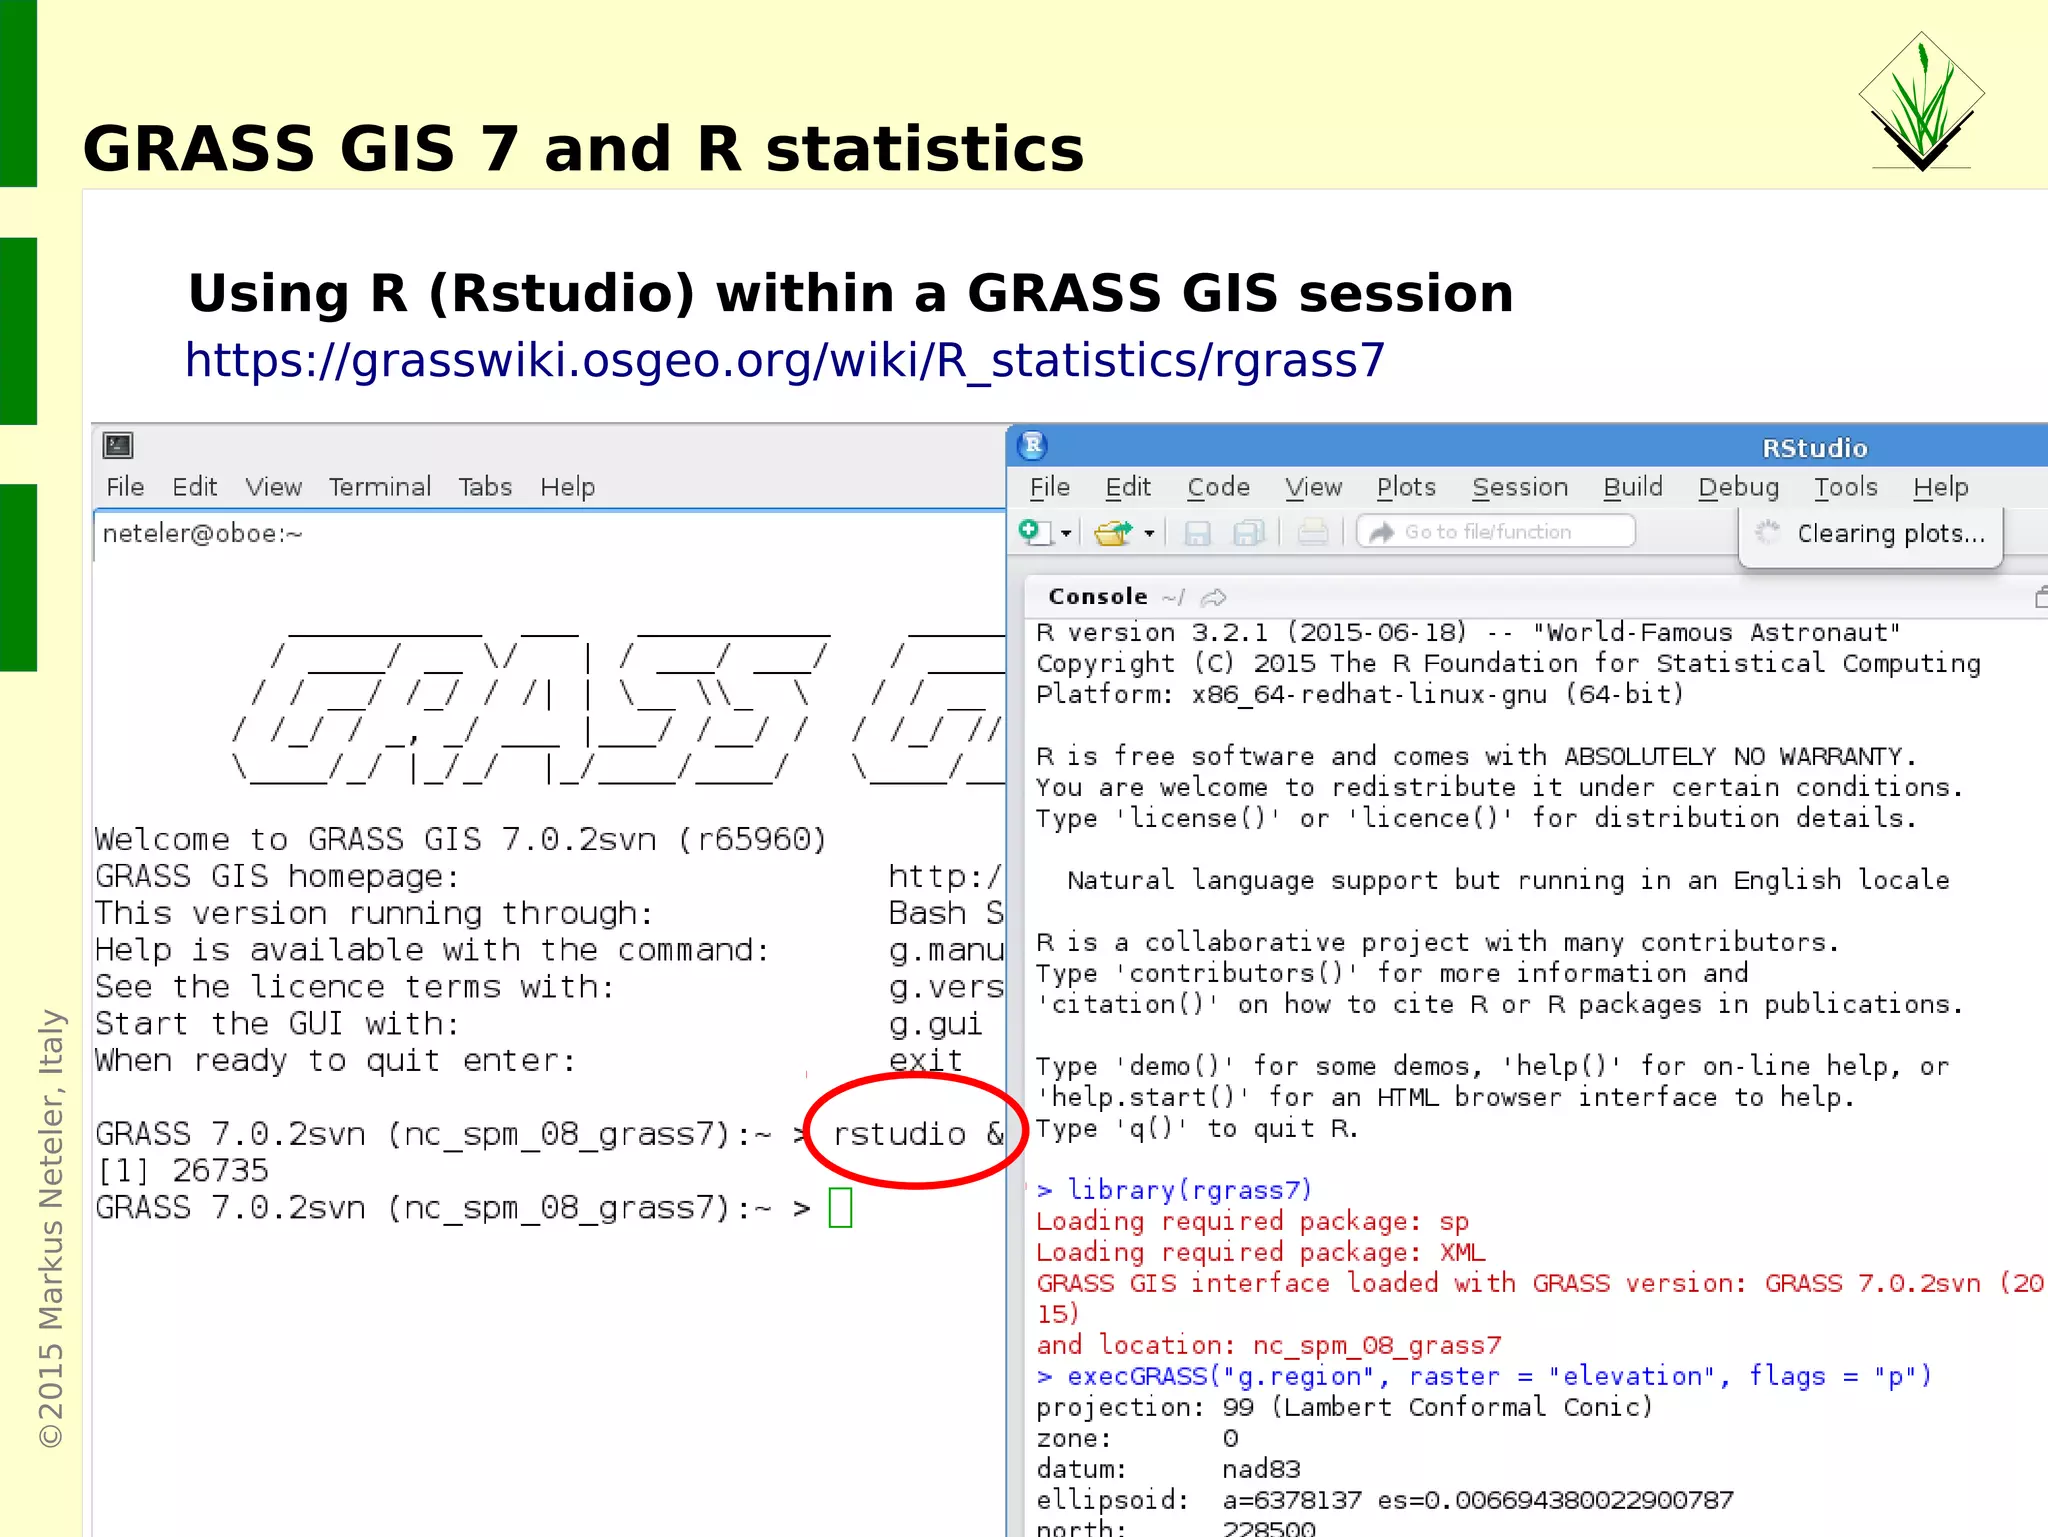
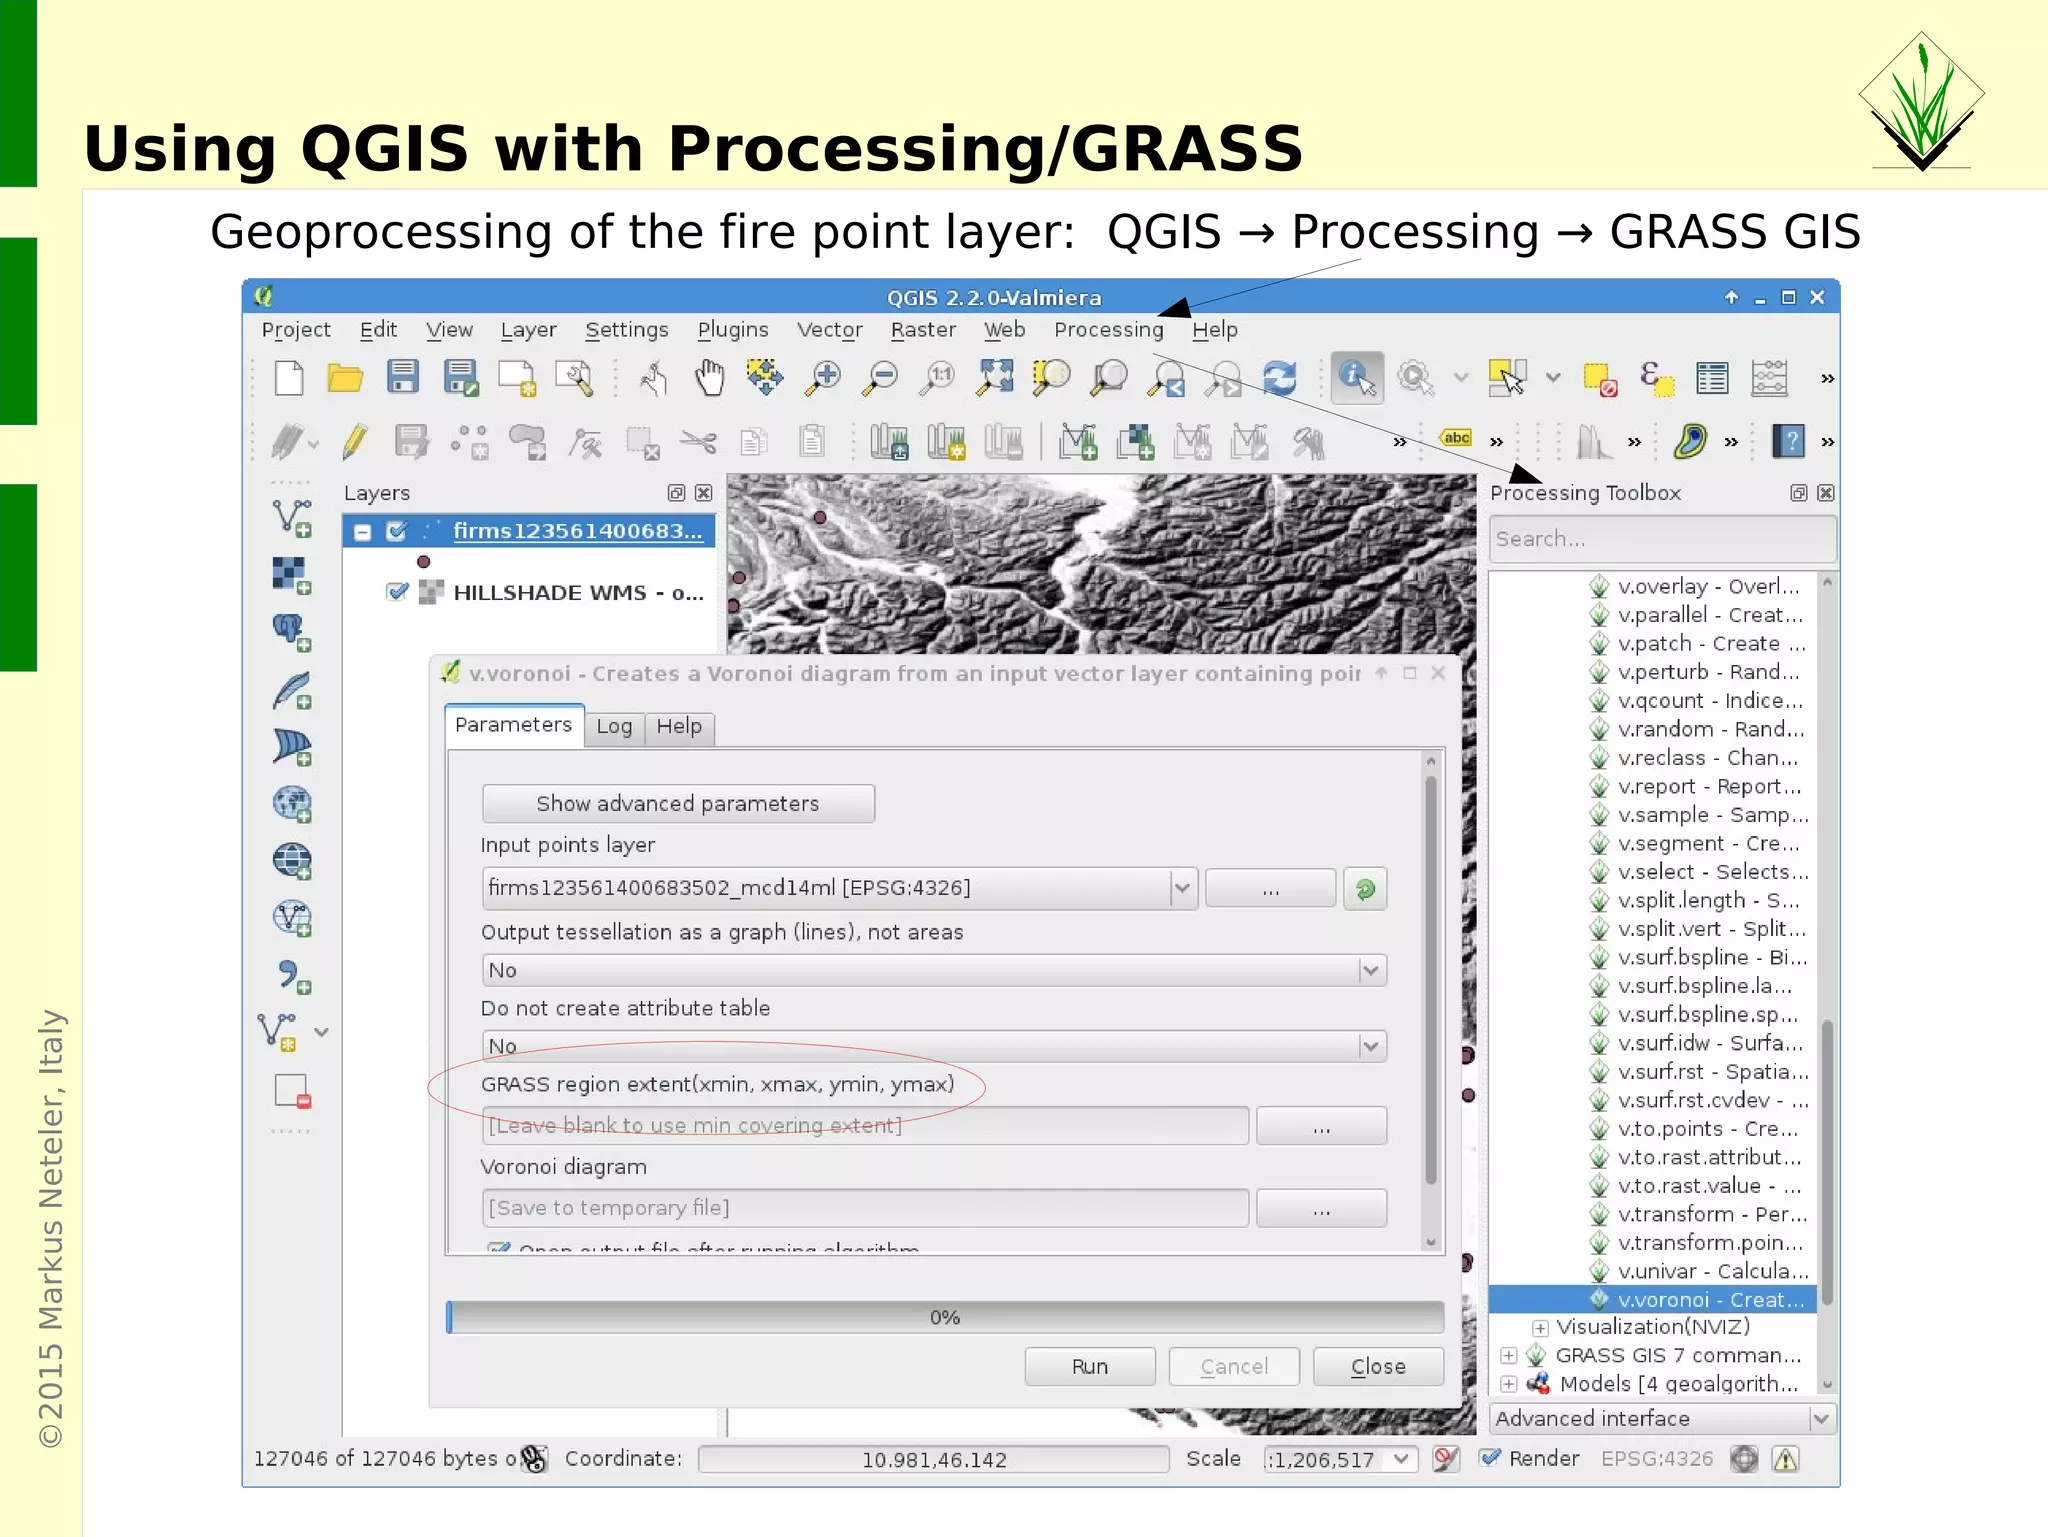
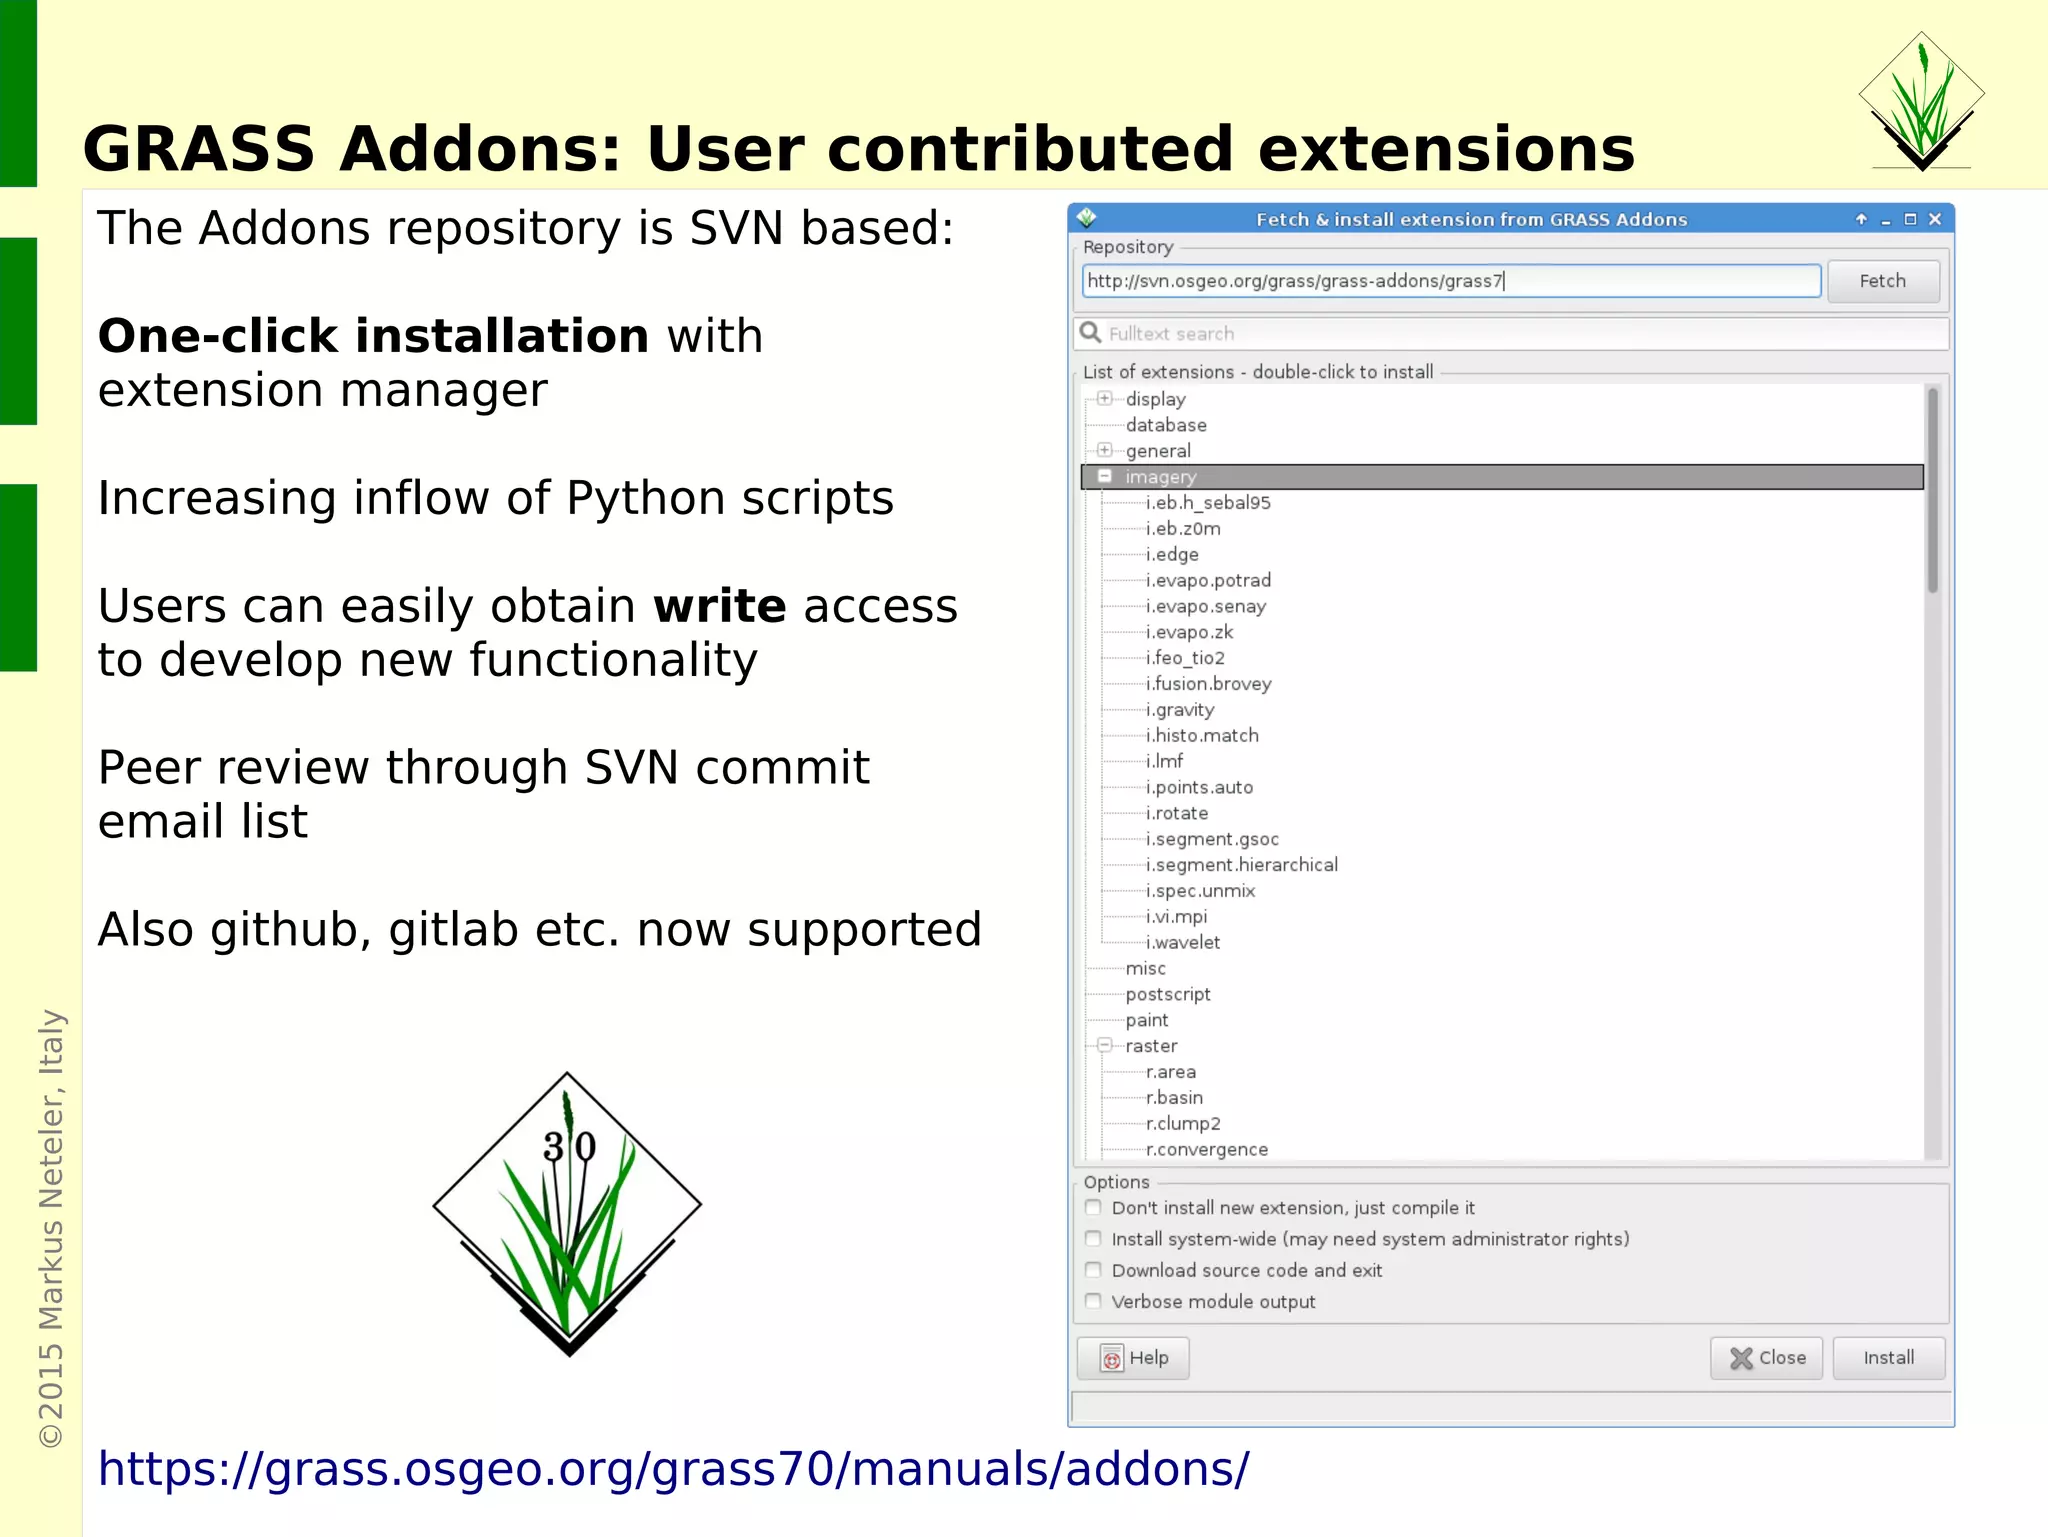
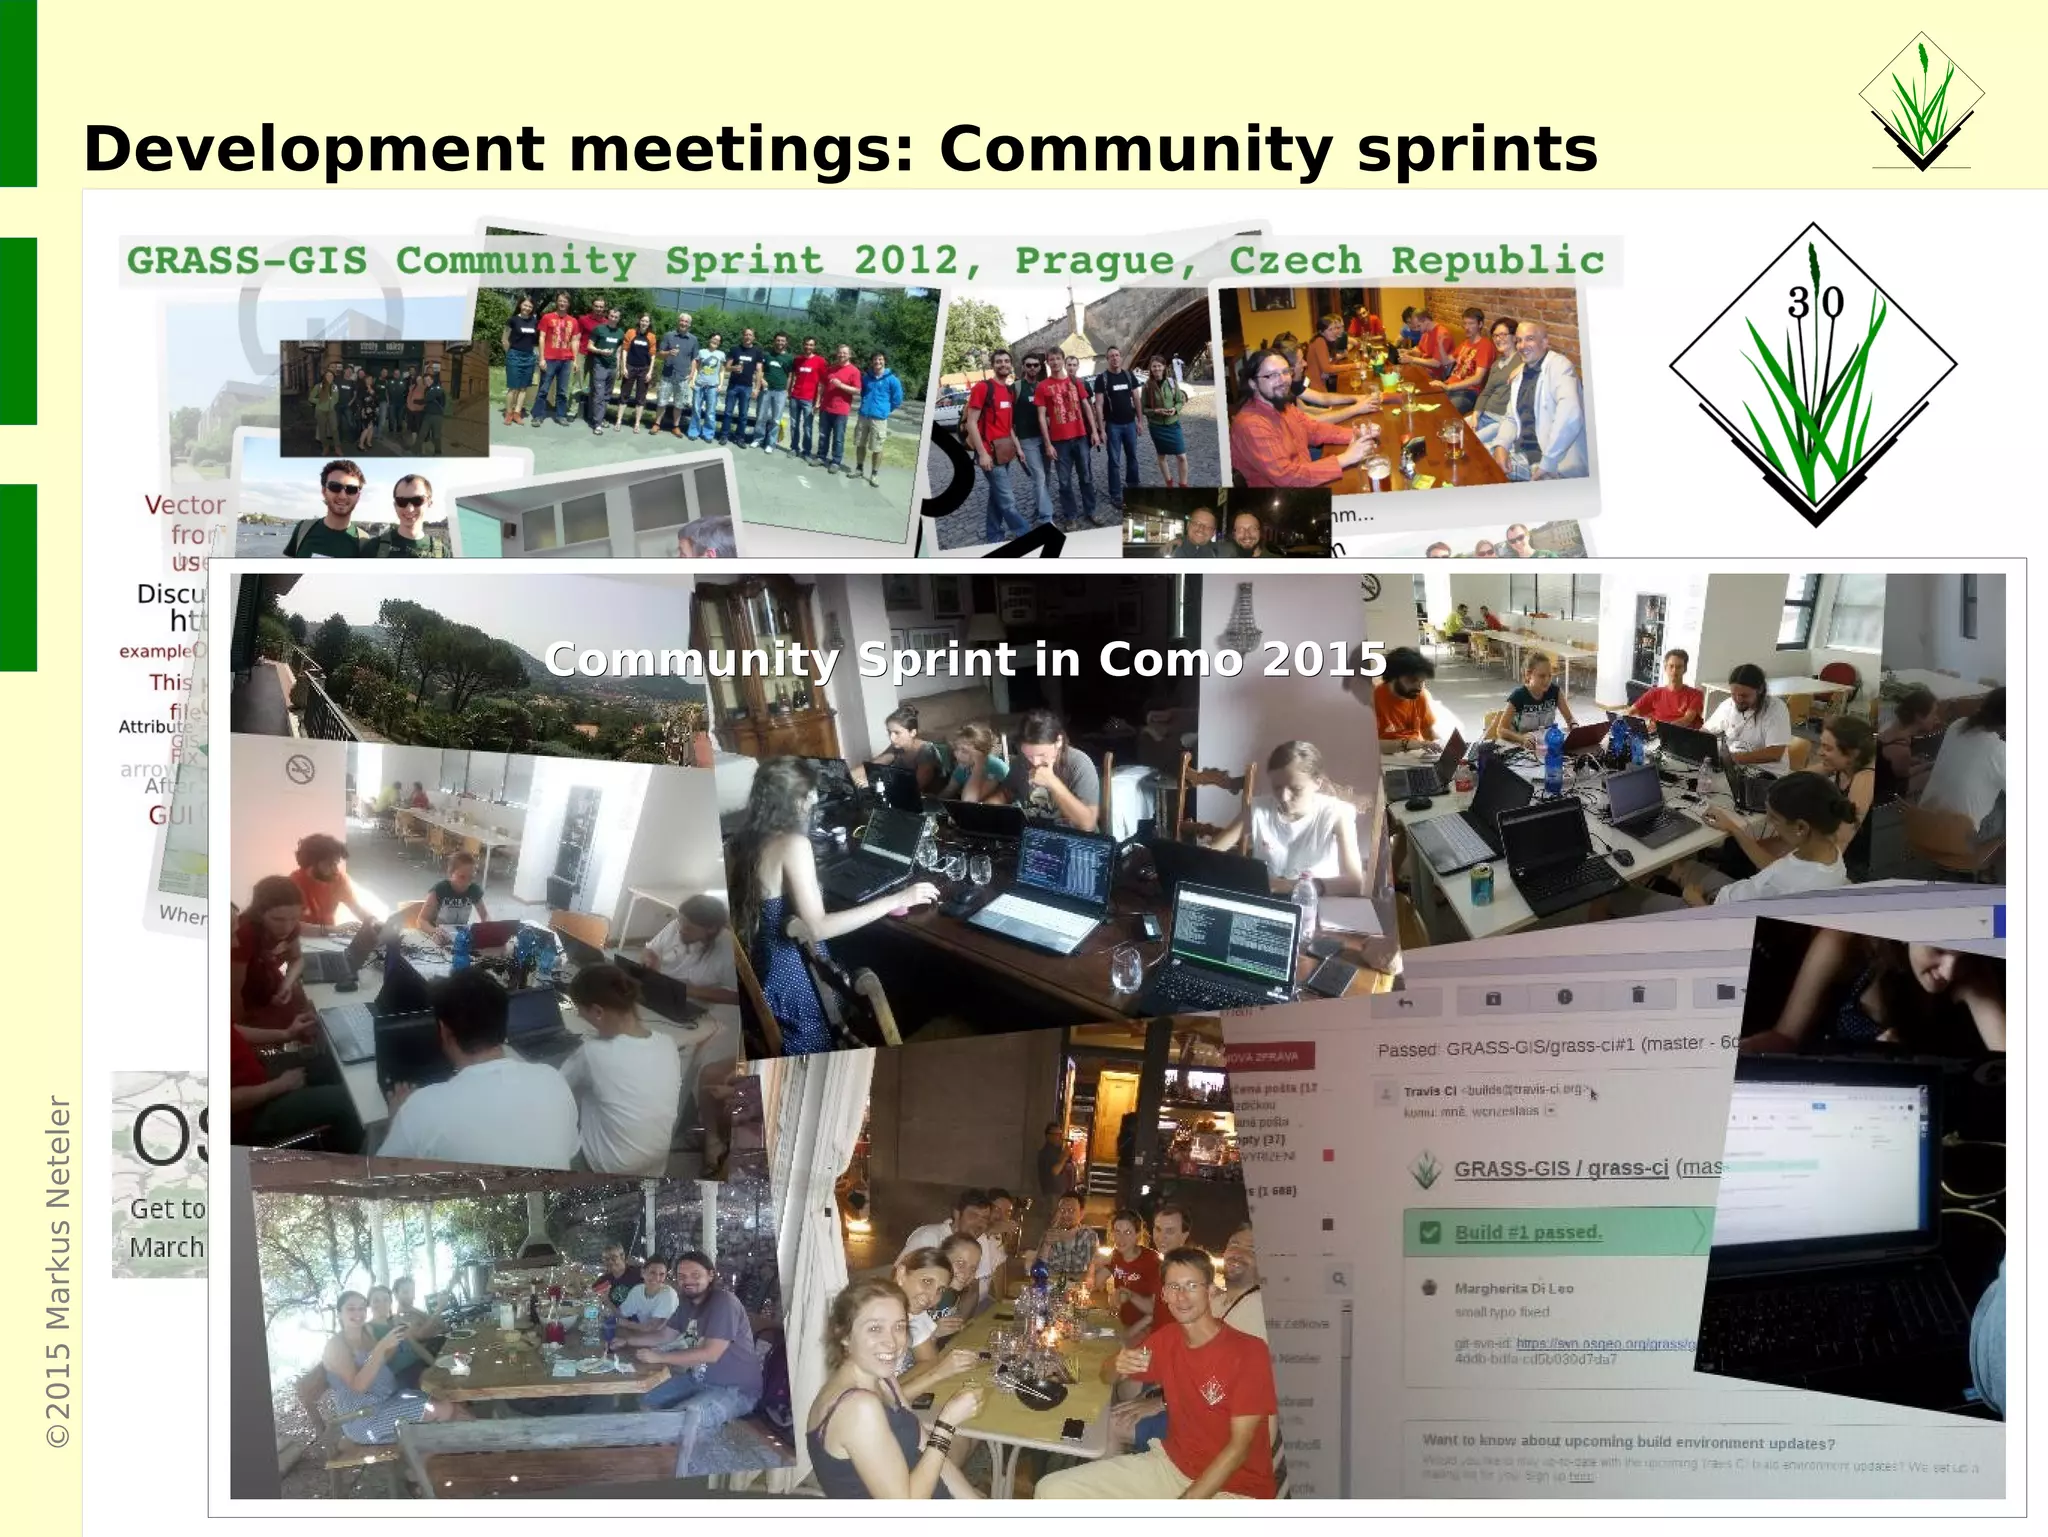
Integration of GRASS GIS with Python, R statistics, and QGIS; also highlights community contributions via addons.
Information about GRASS GIS 7 downloads, user-contributed extensions, community support, and access to free data.


![Vibe Coding vs. Spec-Driven Development [Free Meetup]](https://cdn.slidesharecdn.com/ss_thumbnails/vibecodingvsspecdrivendevelopment-251209105622-43f455e7-thumbnail.jpg?width=640&height=640&fit=bounds)


