Download as PDF, PPTX
![© 2014, Neteler et al. - http://gis.cri.fmach.it/
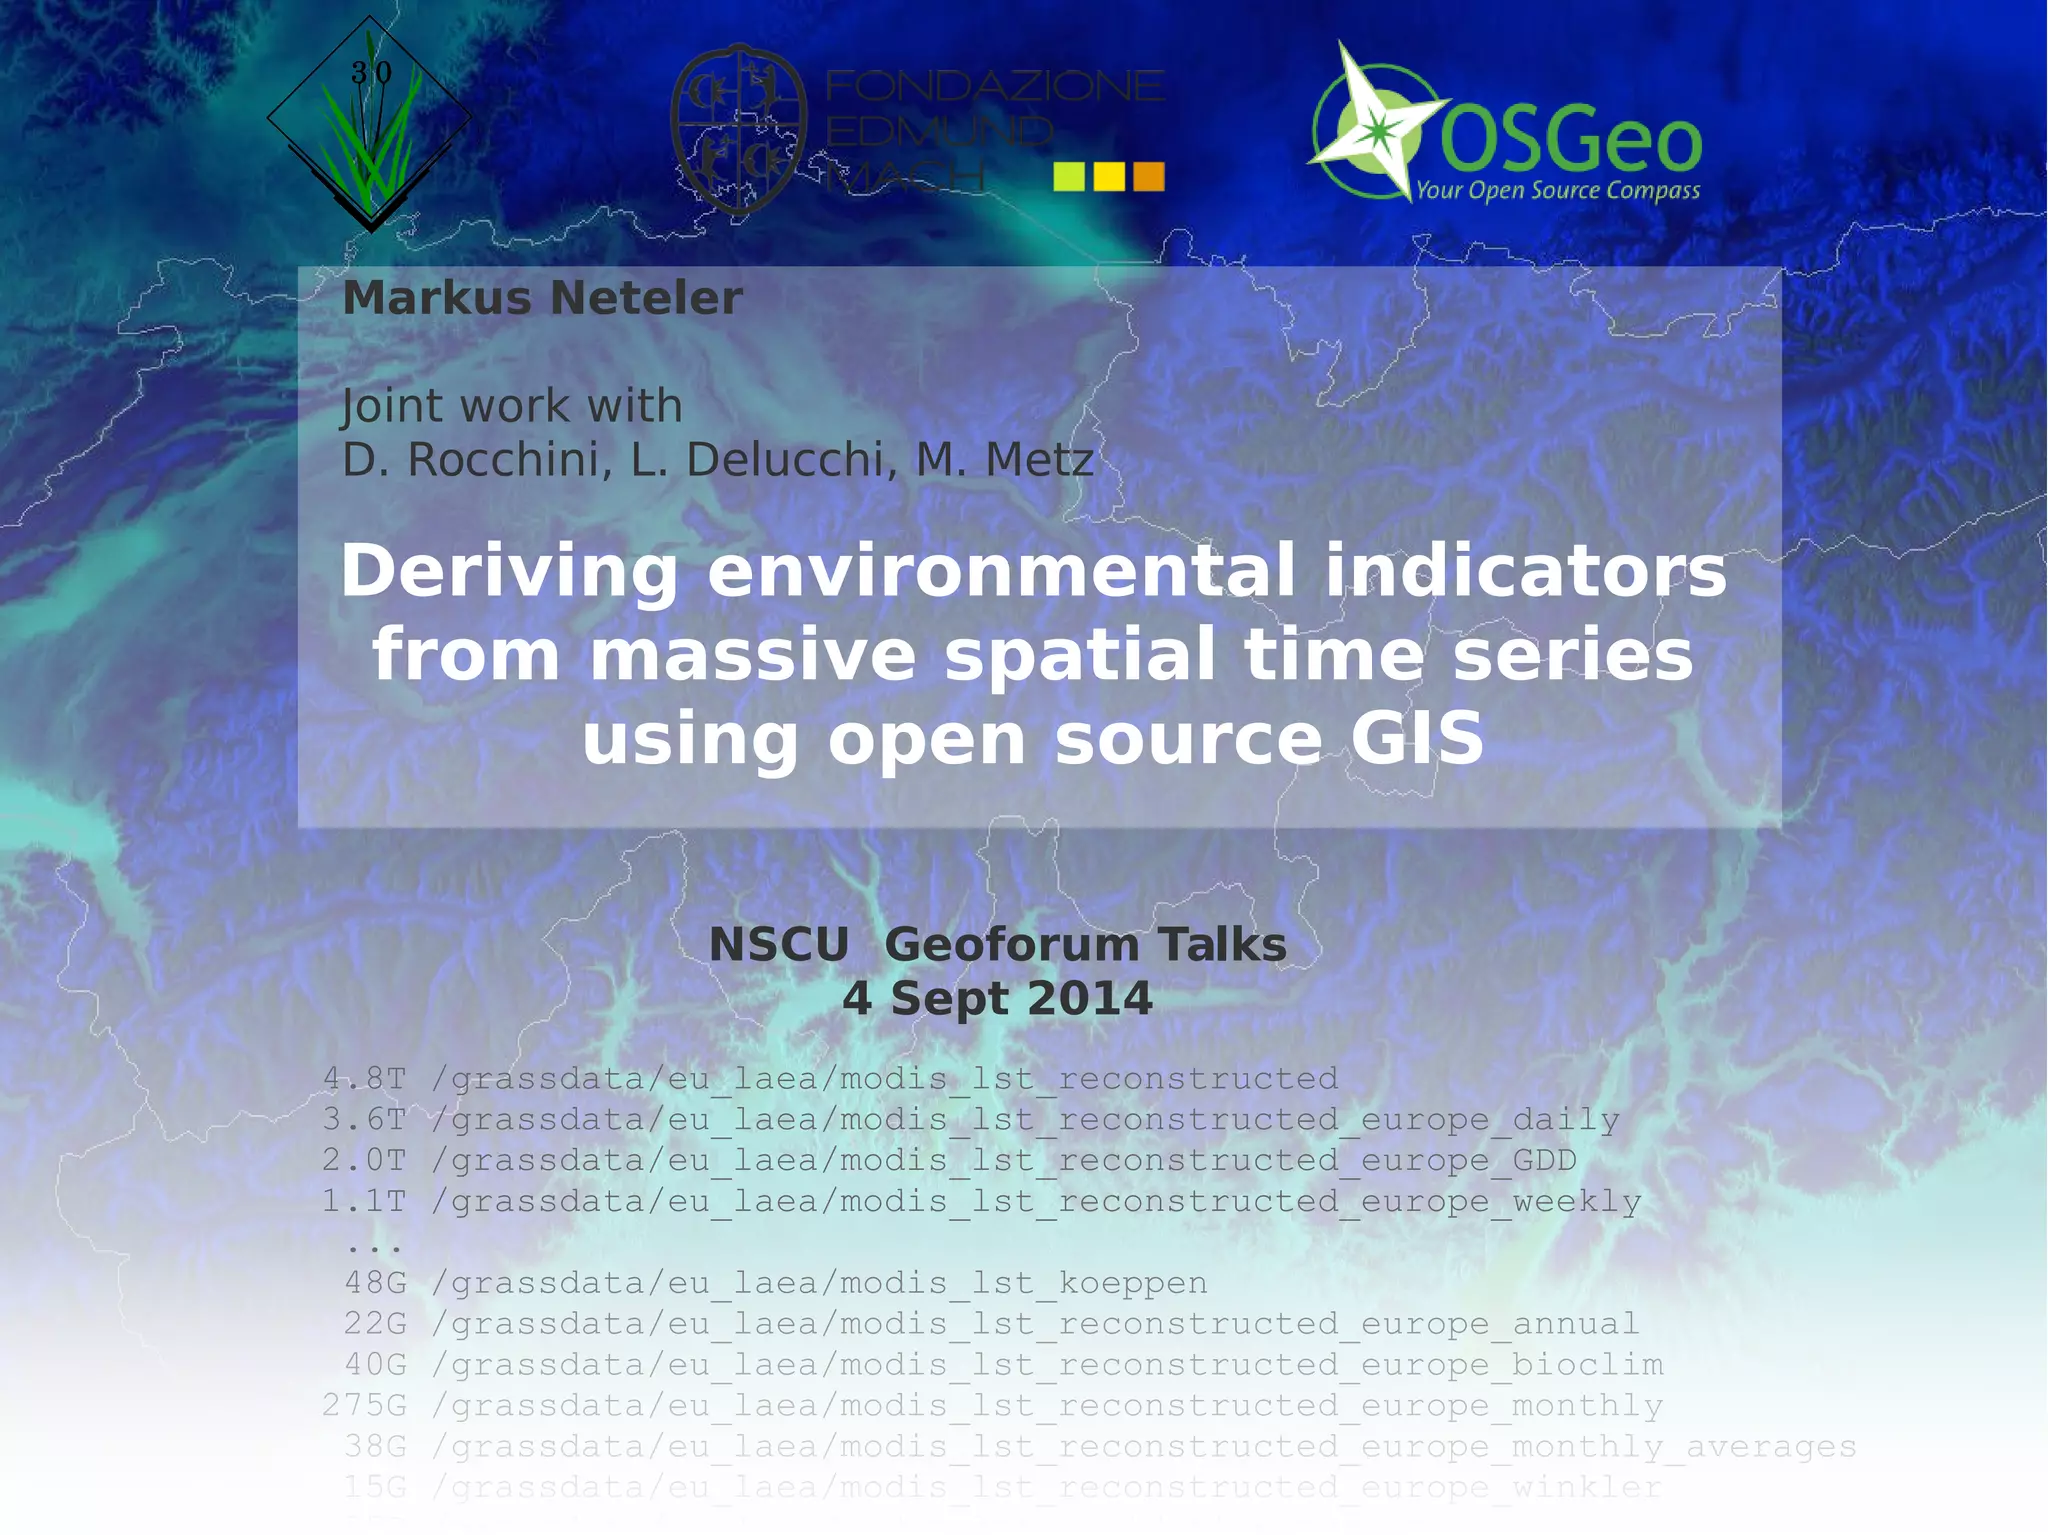
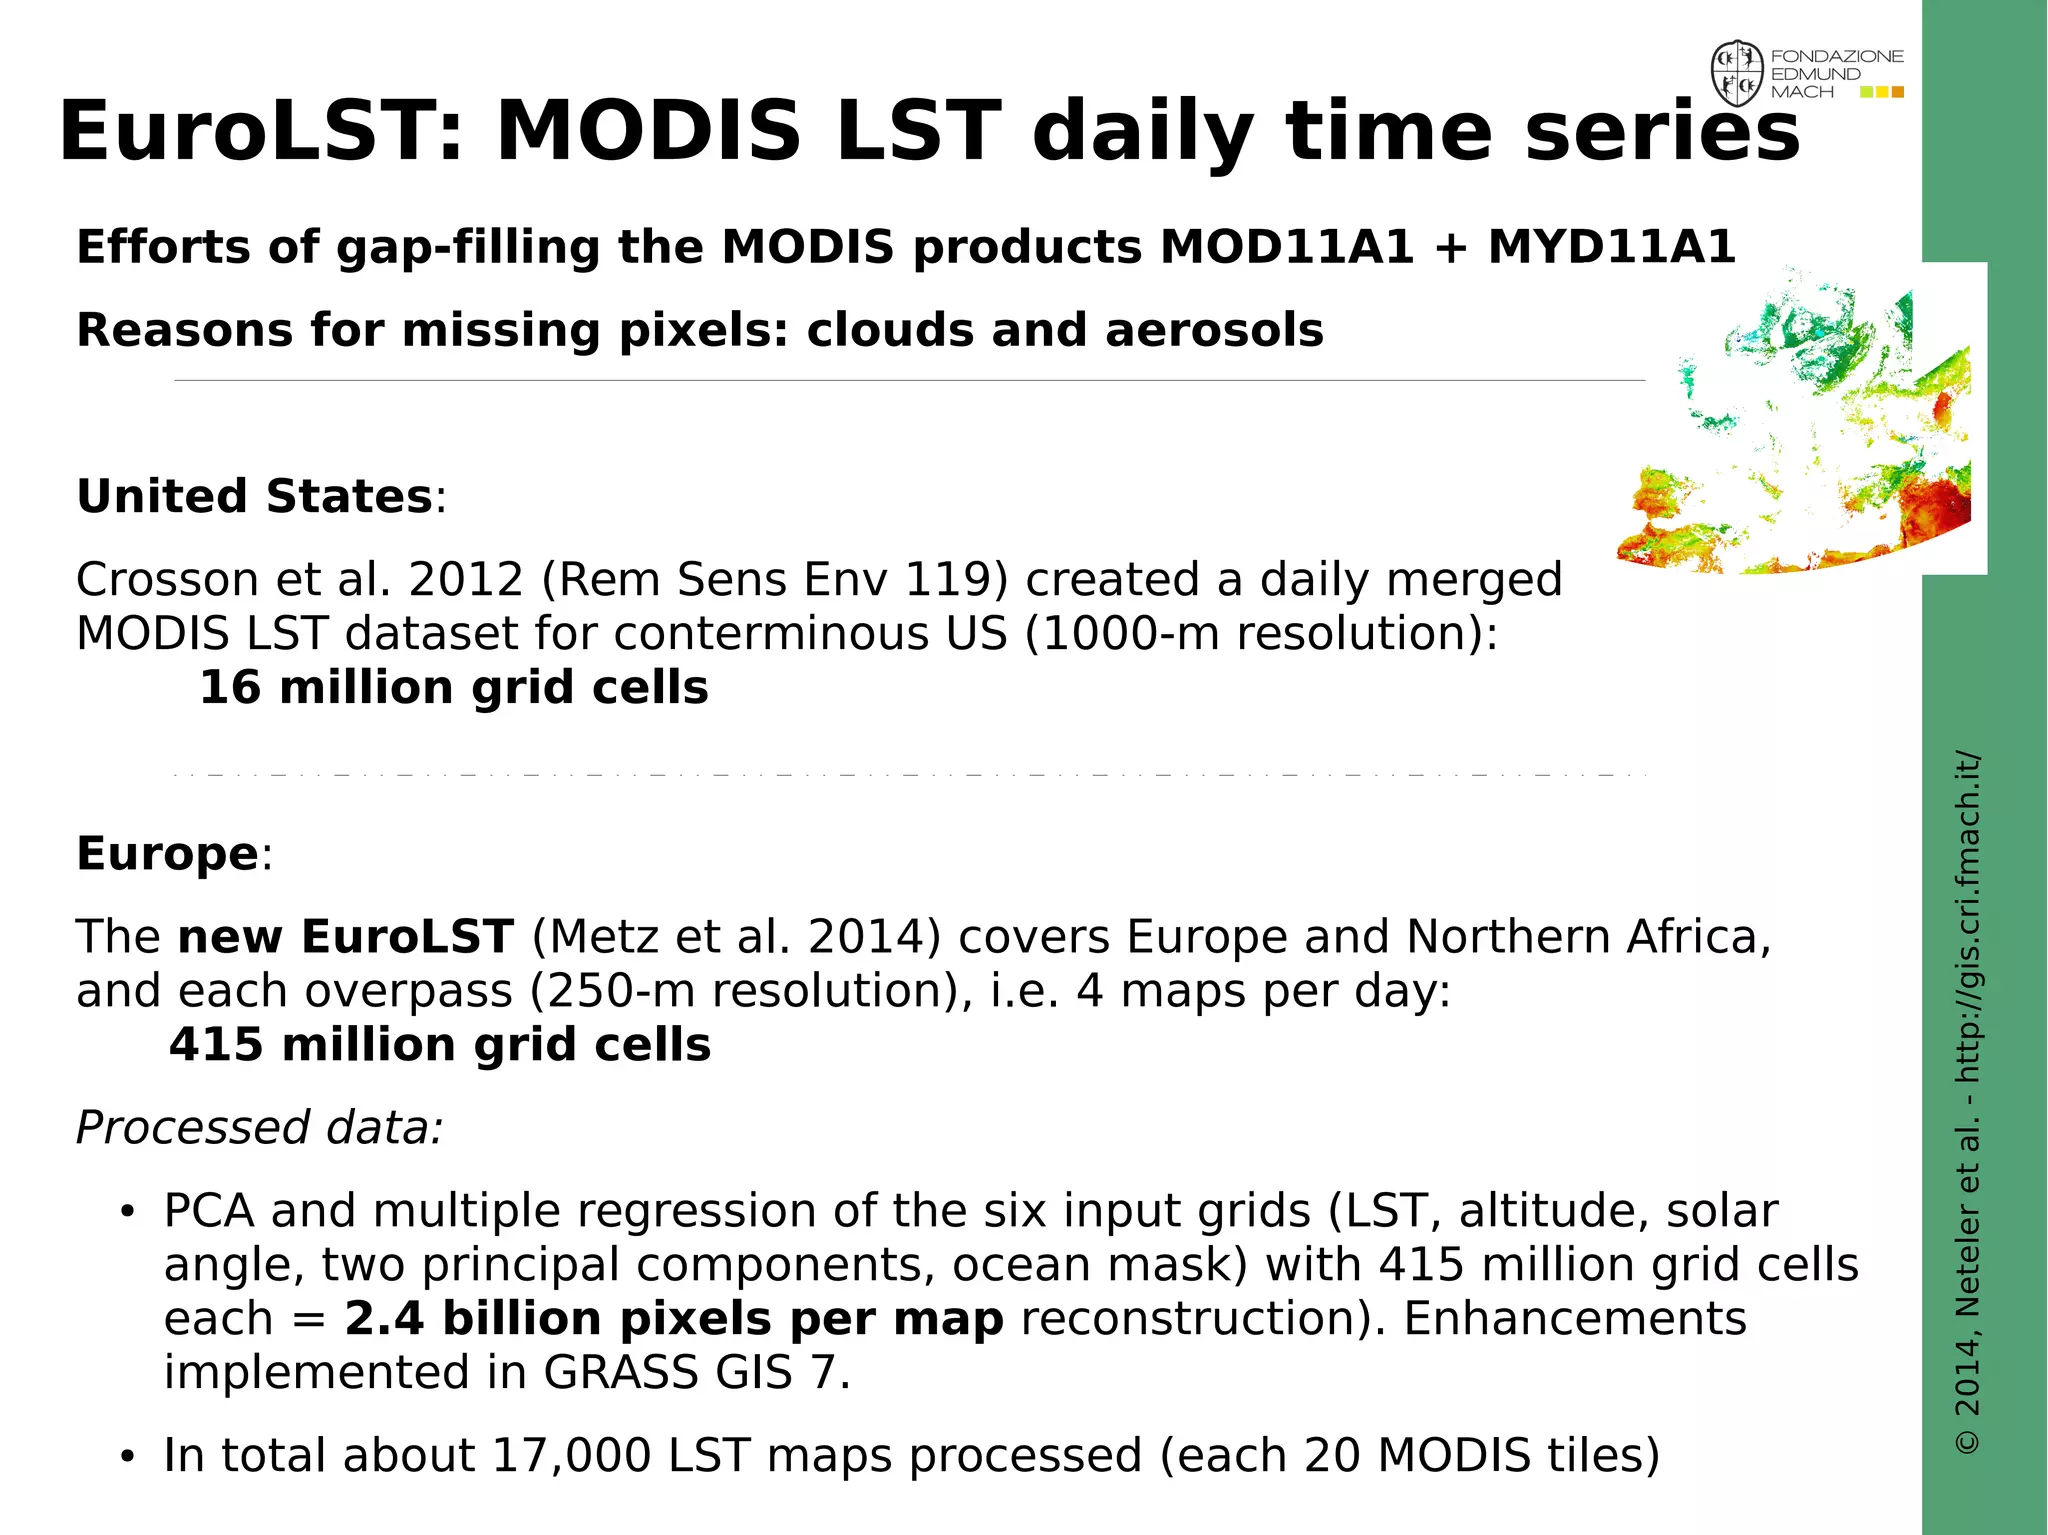
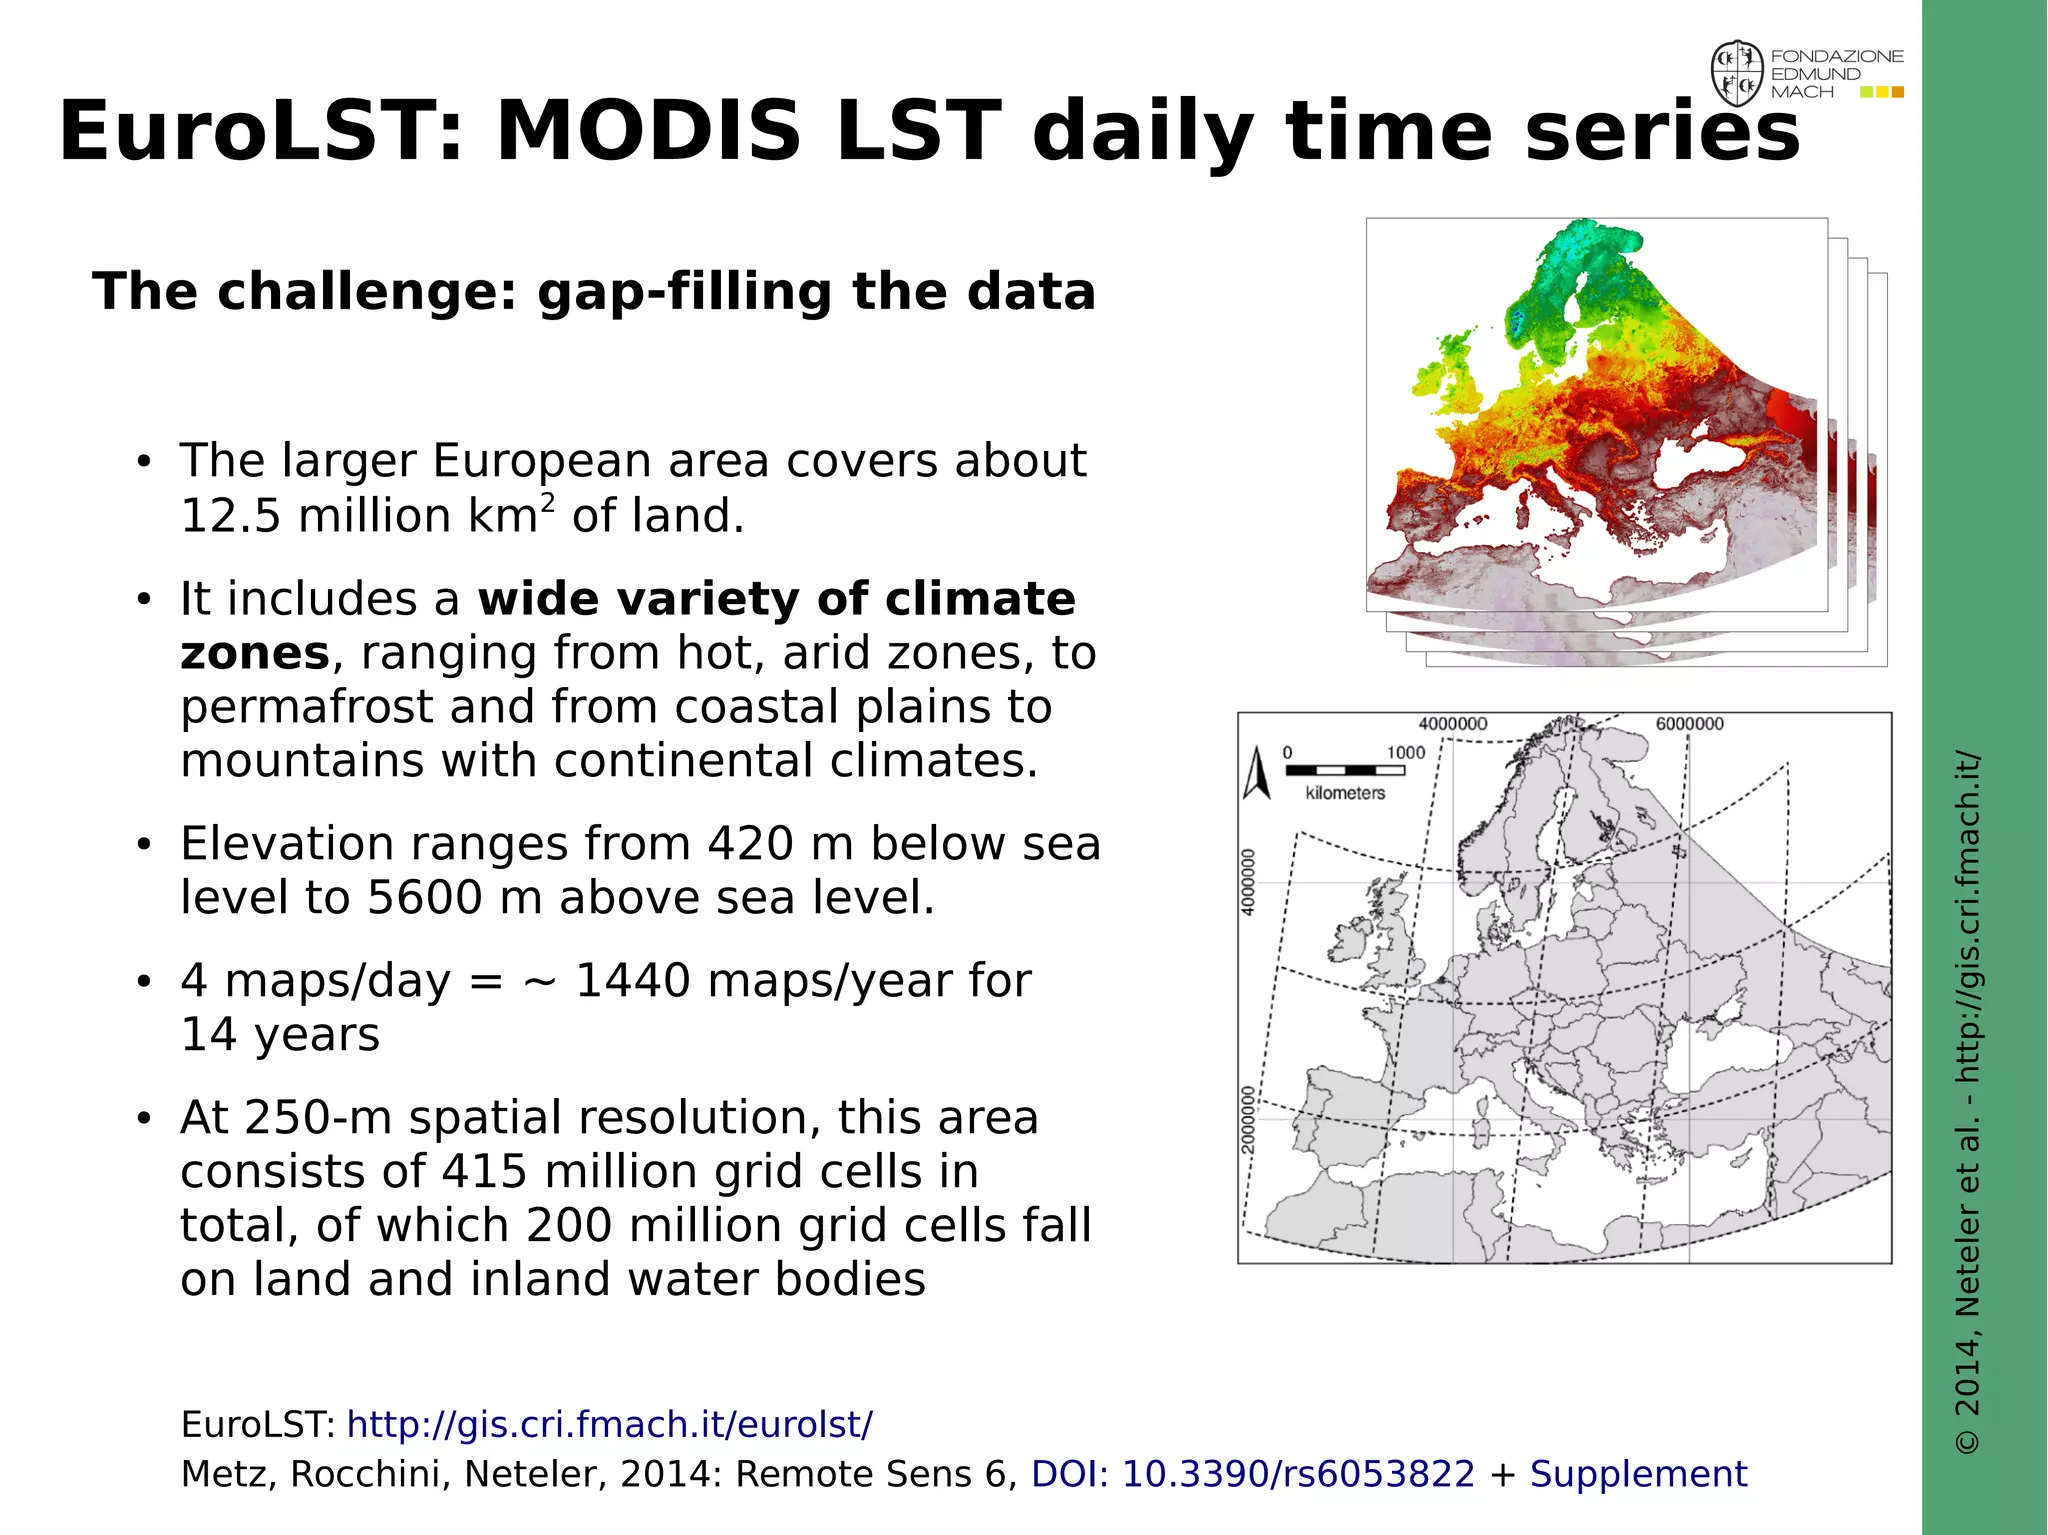
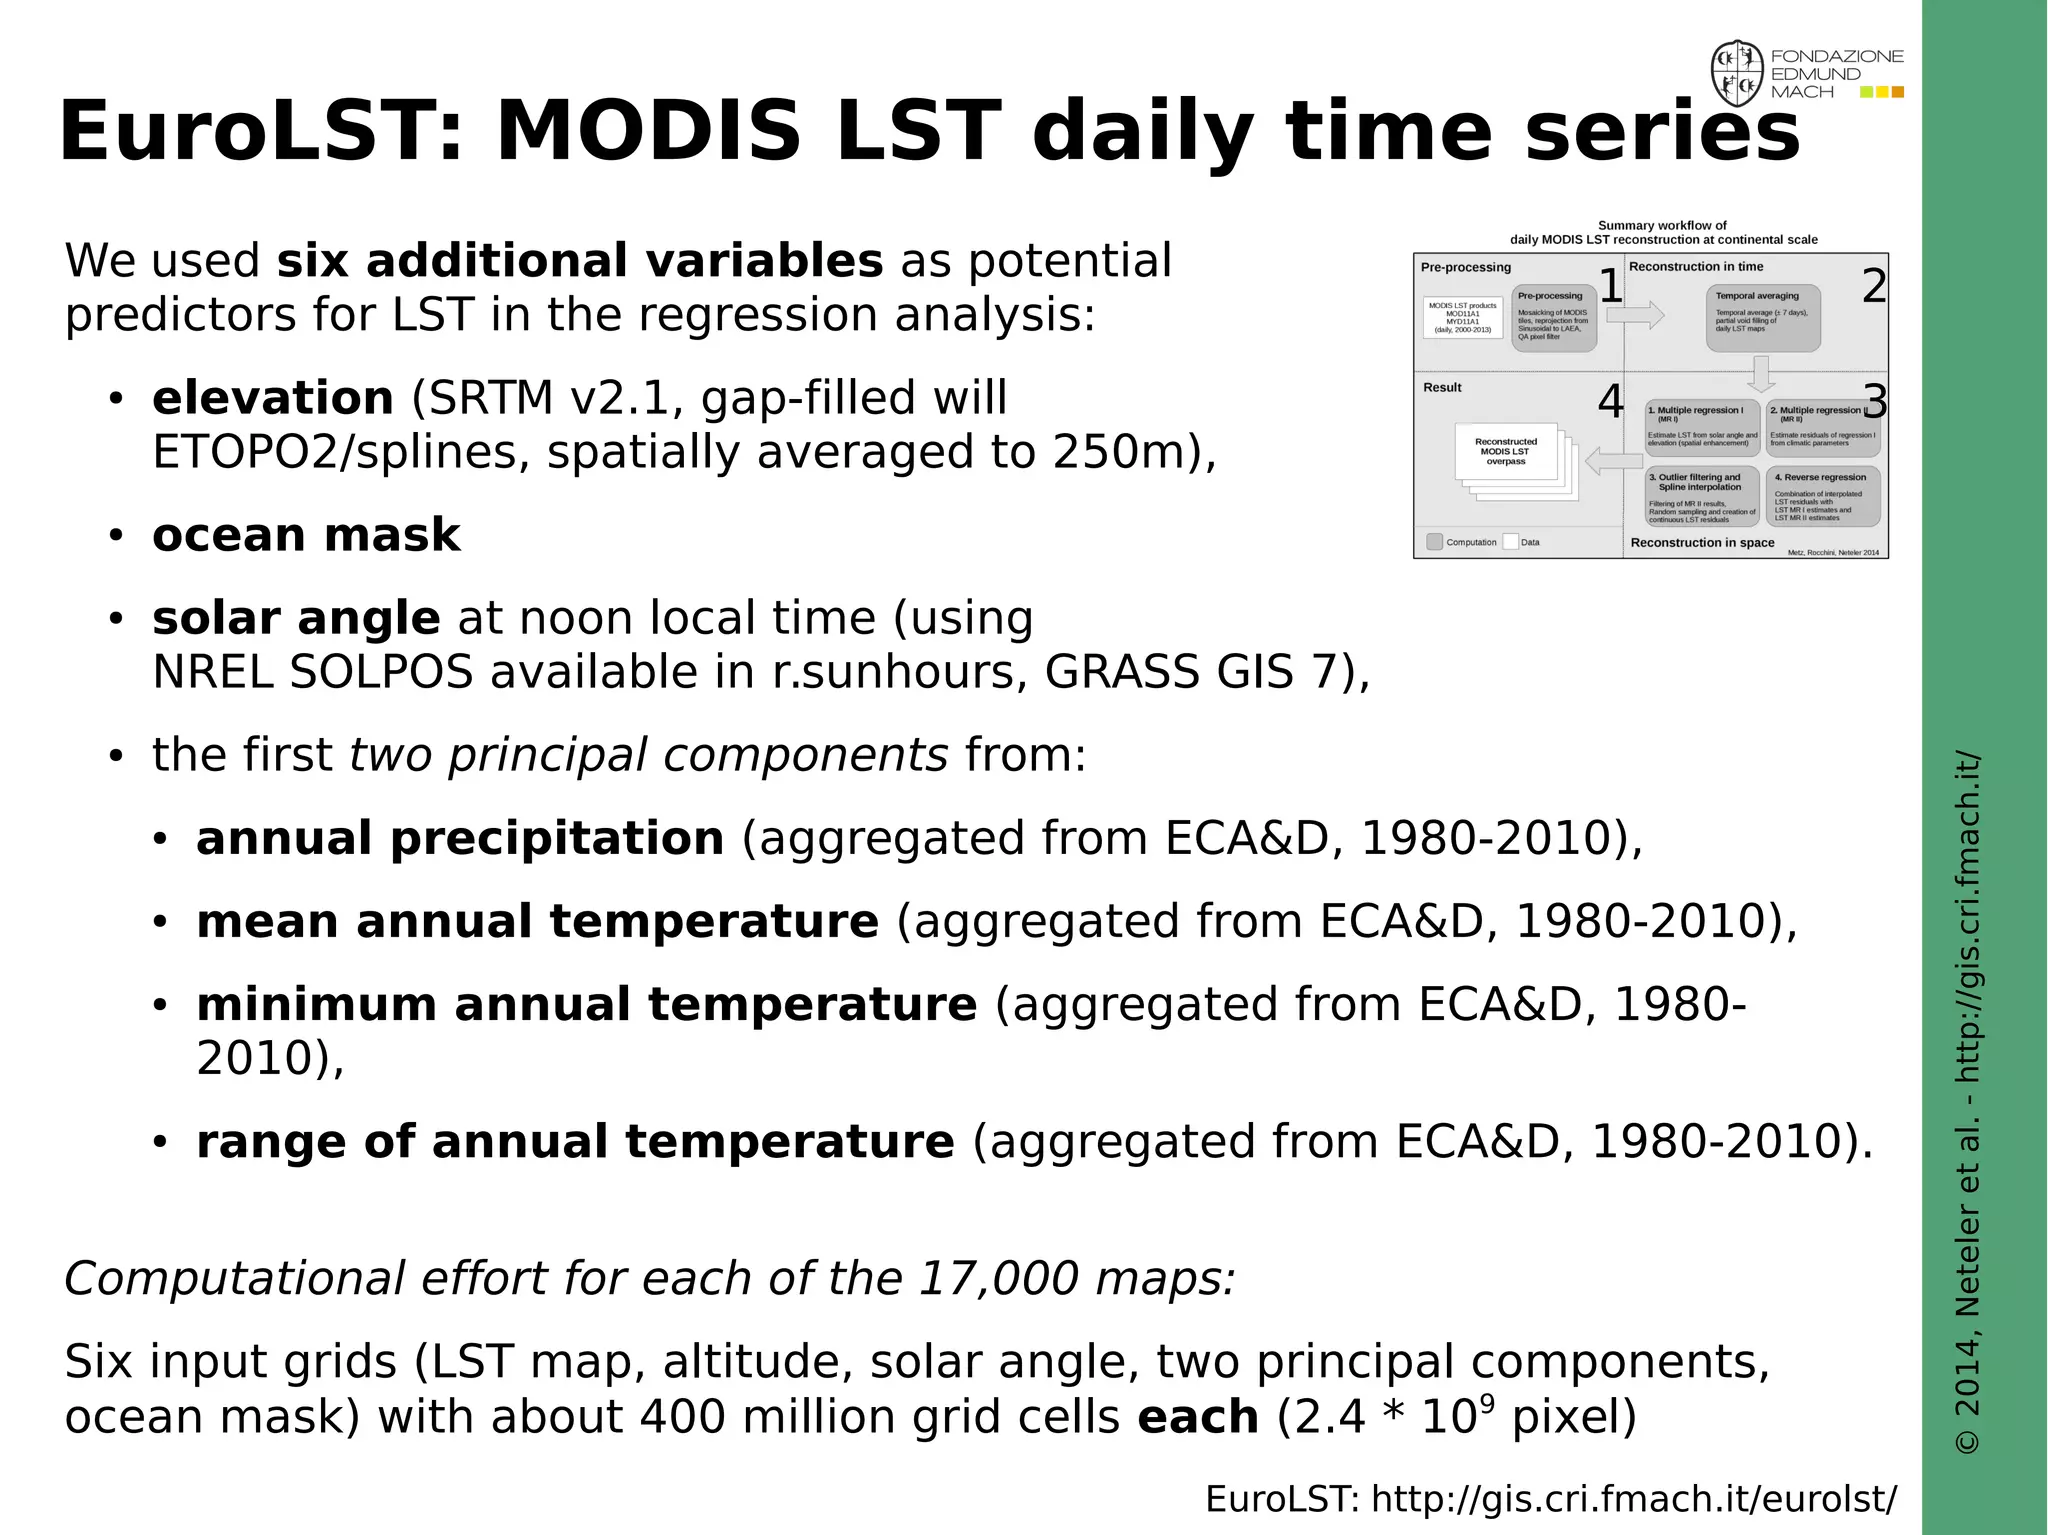
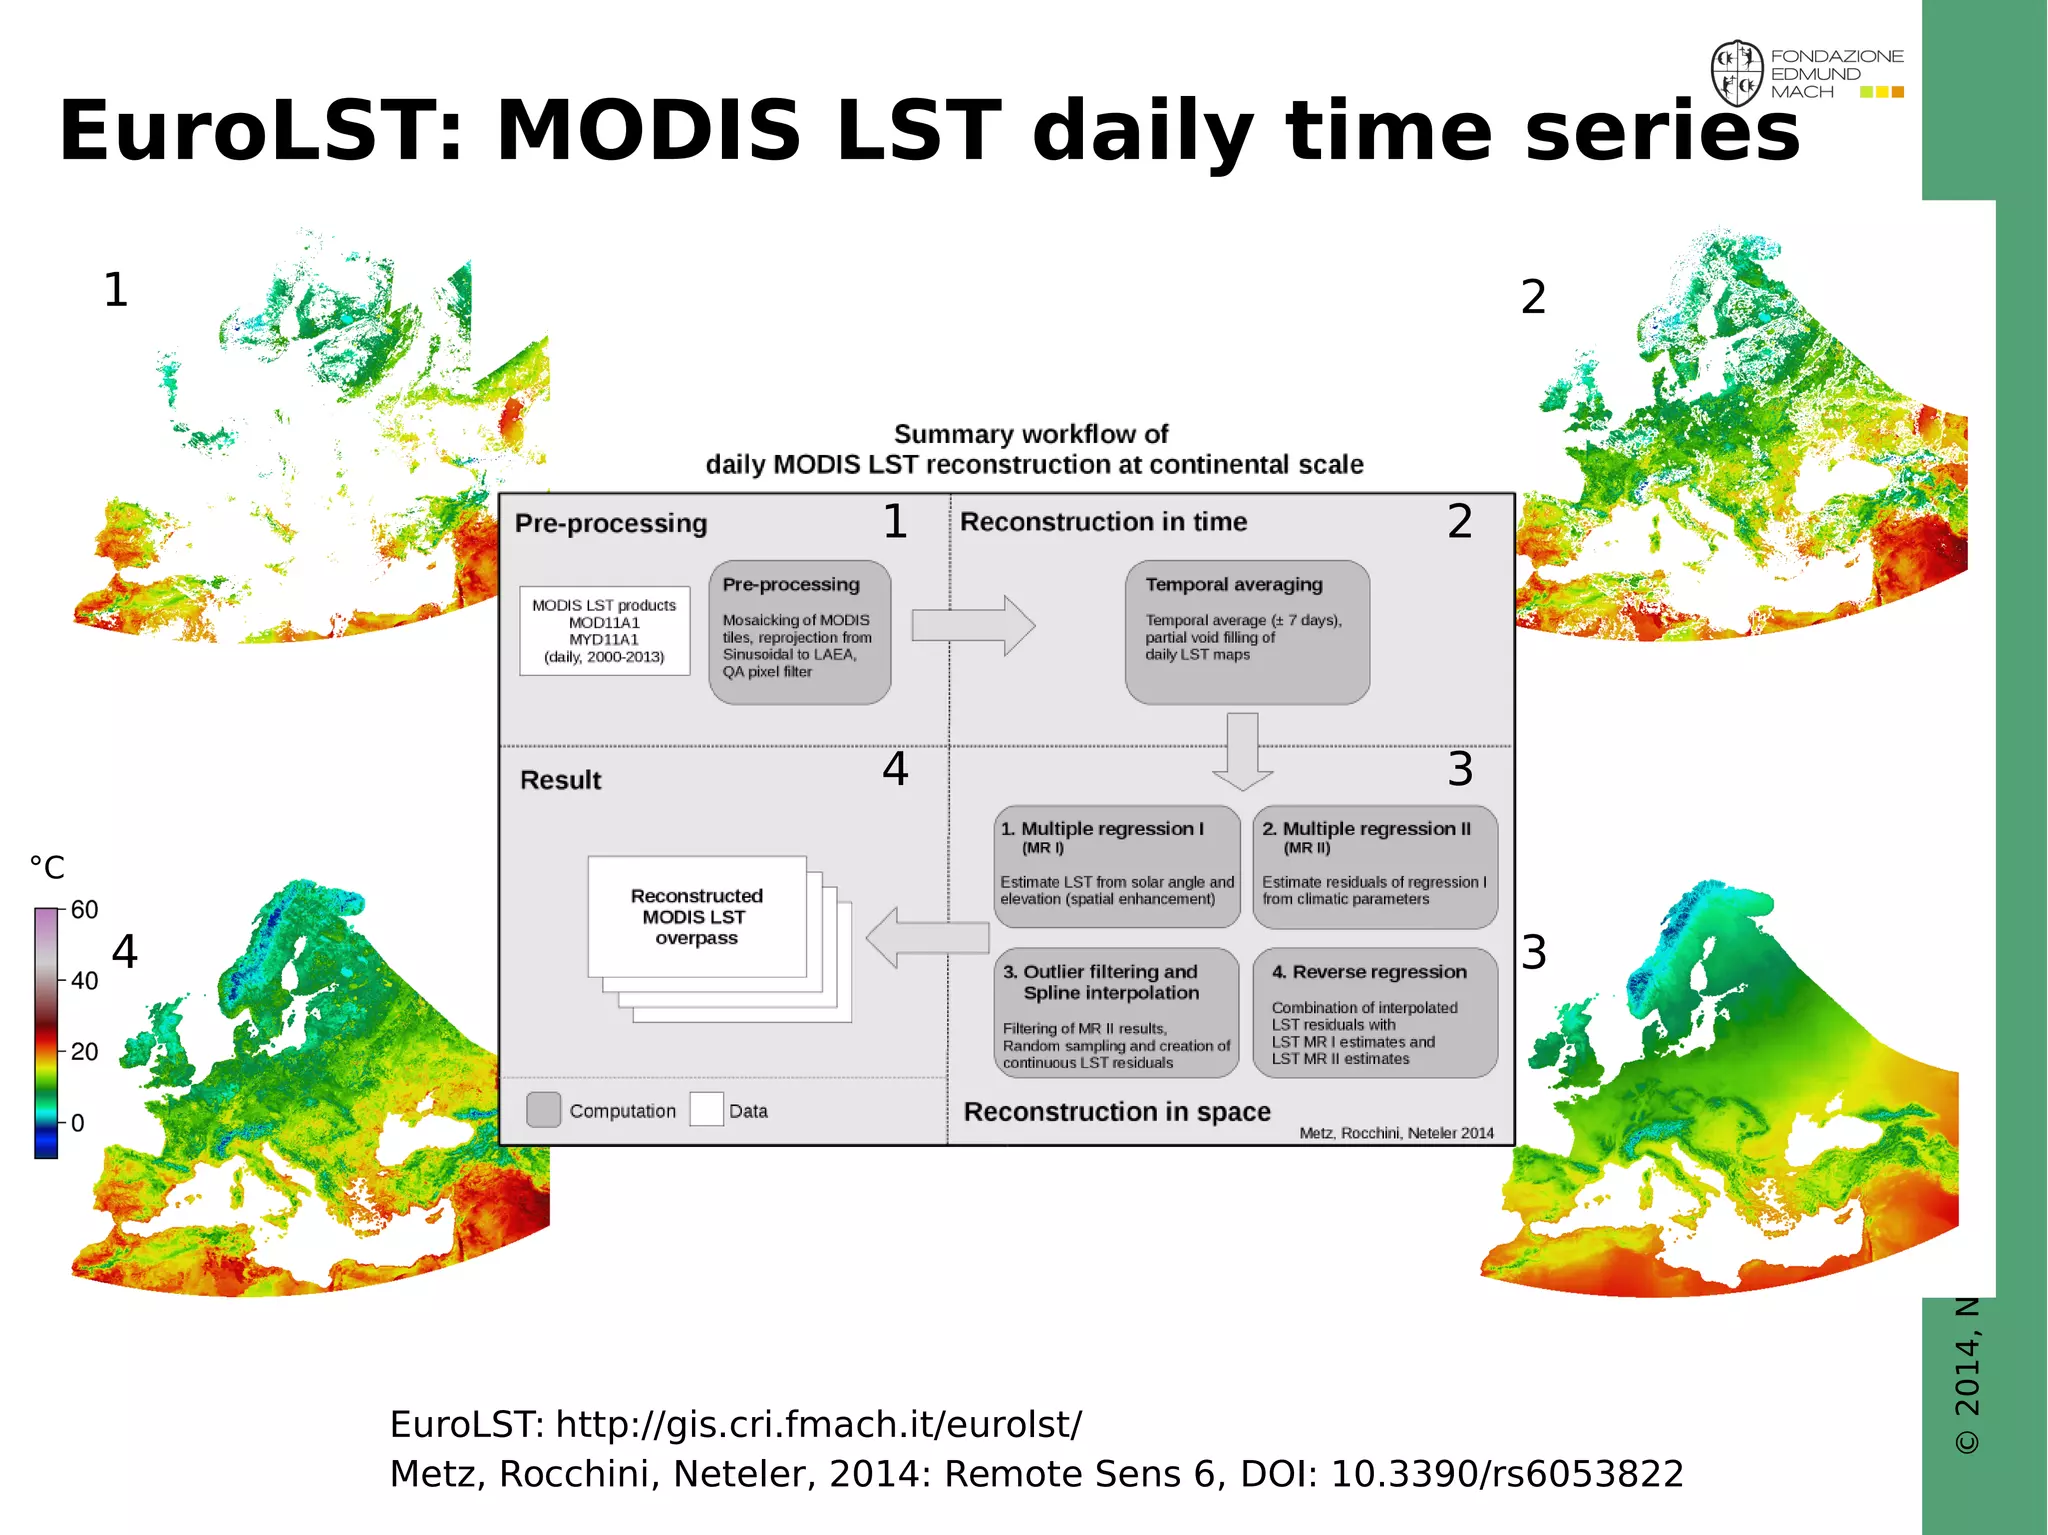
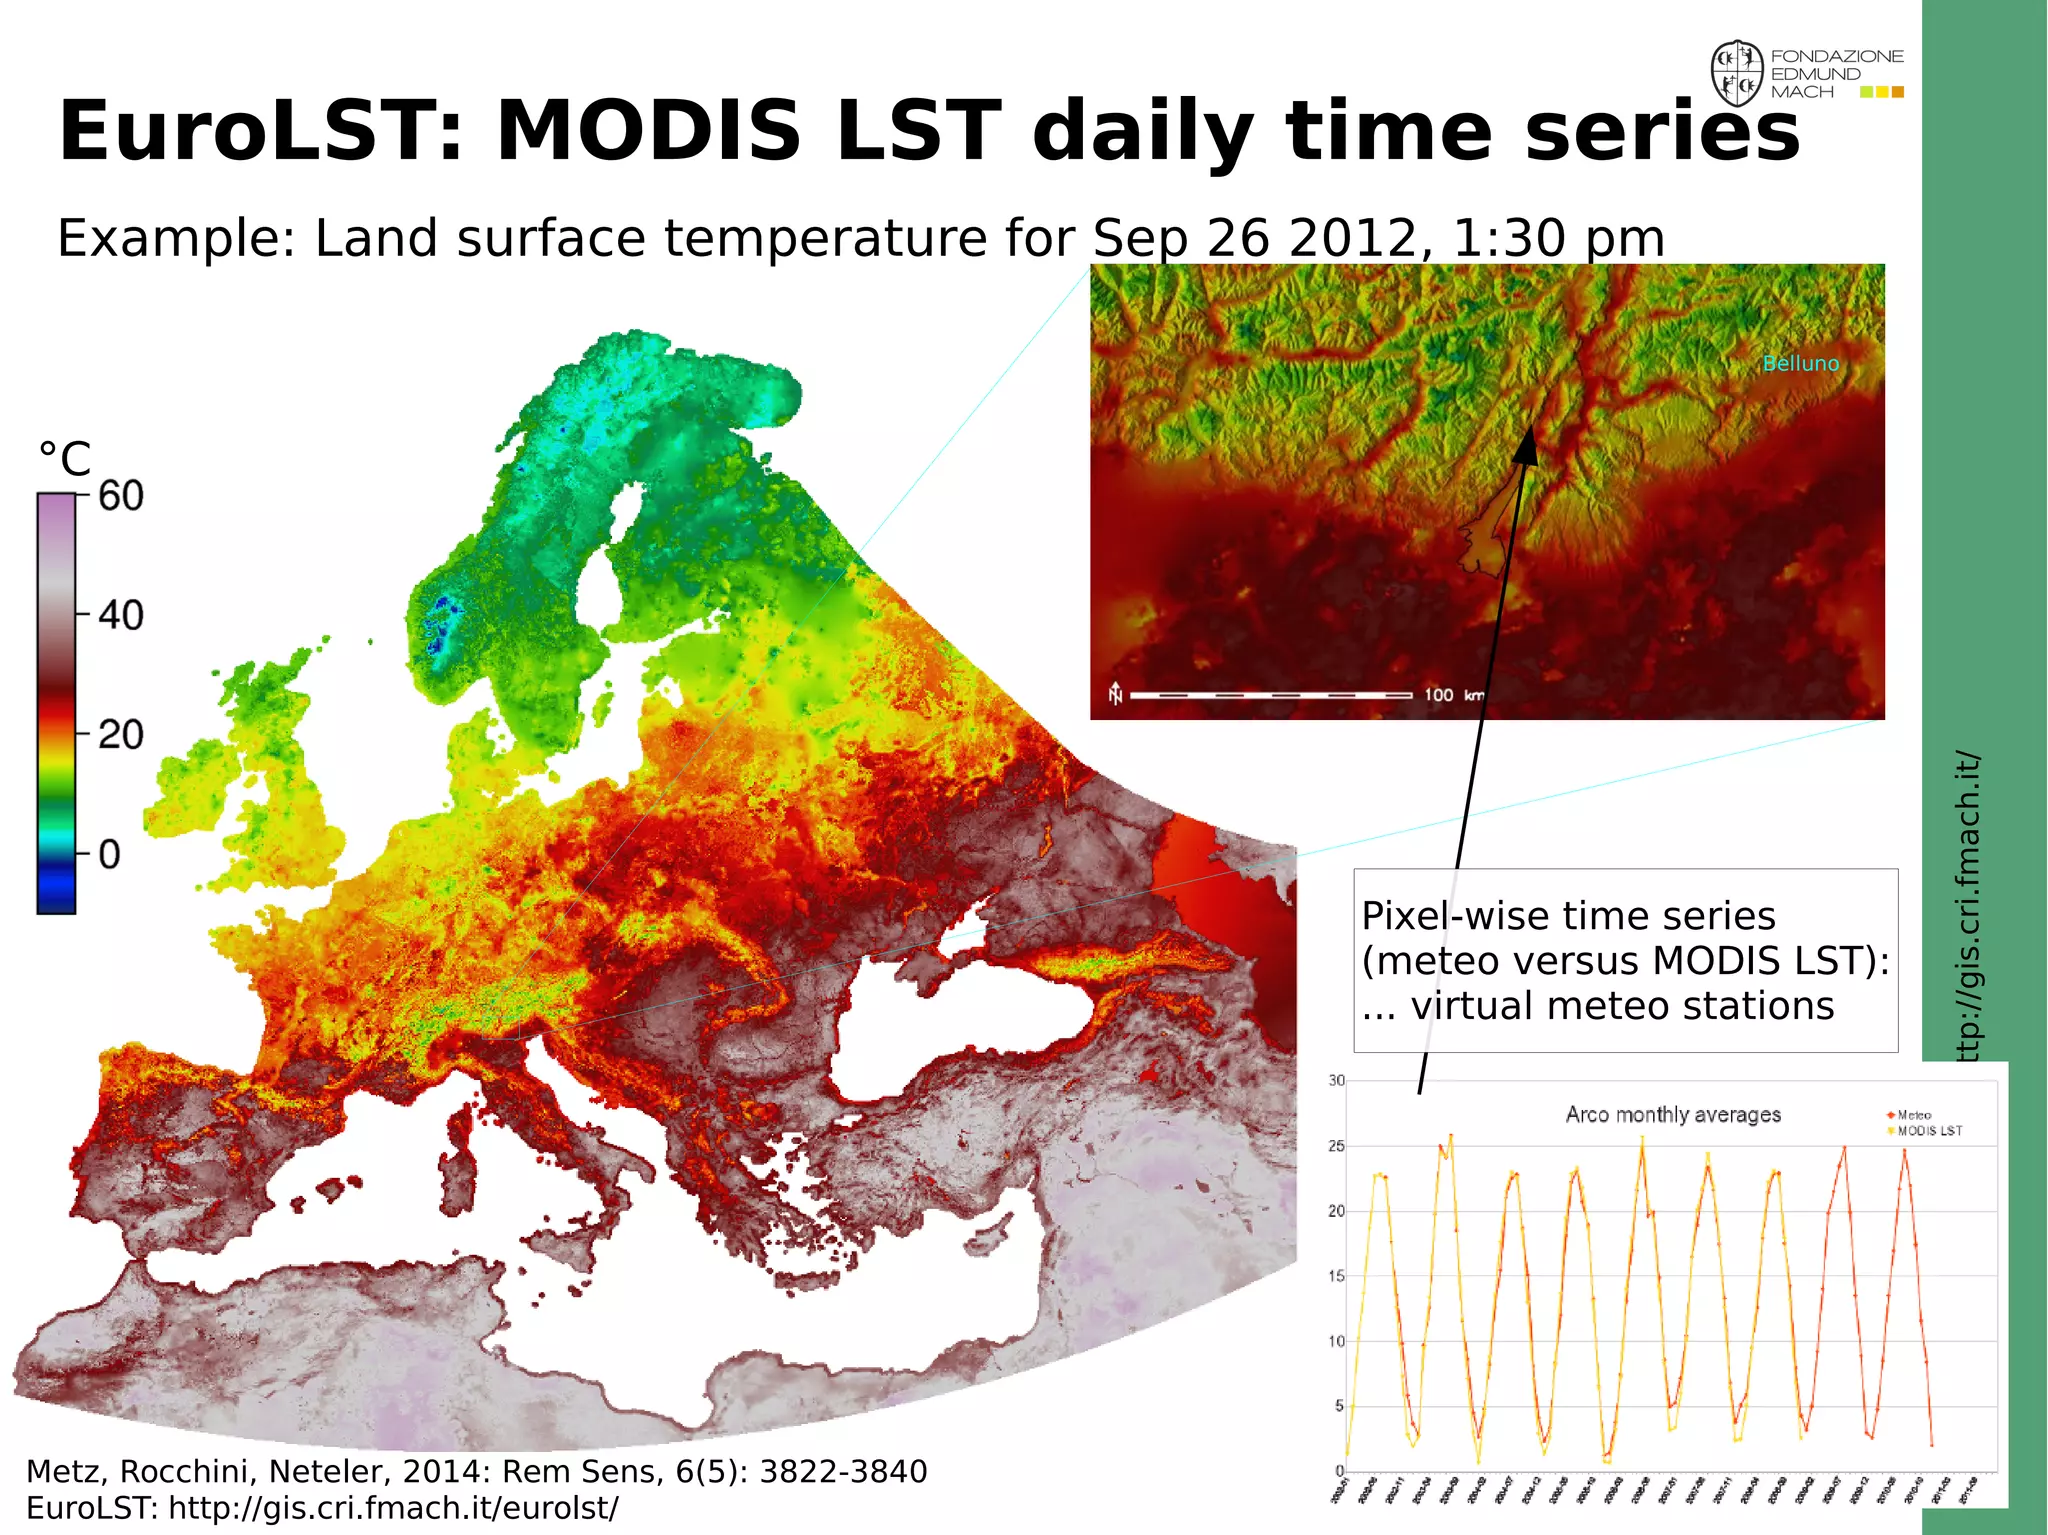
EuroLST: MODIS LST daily time series
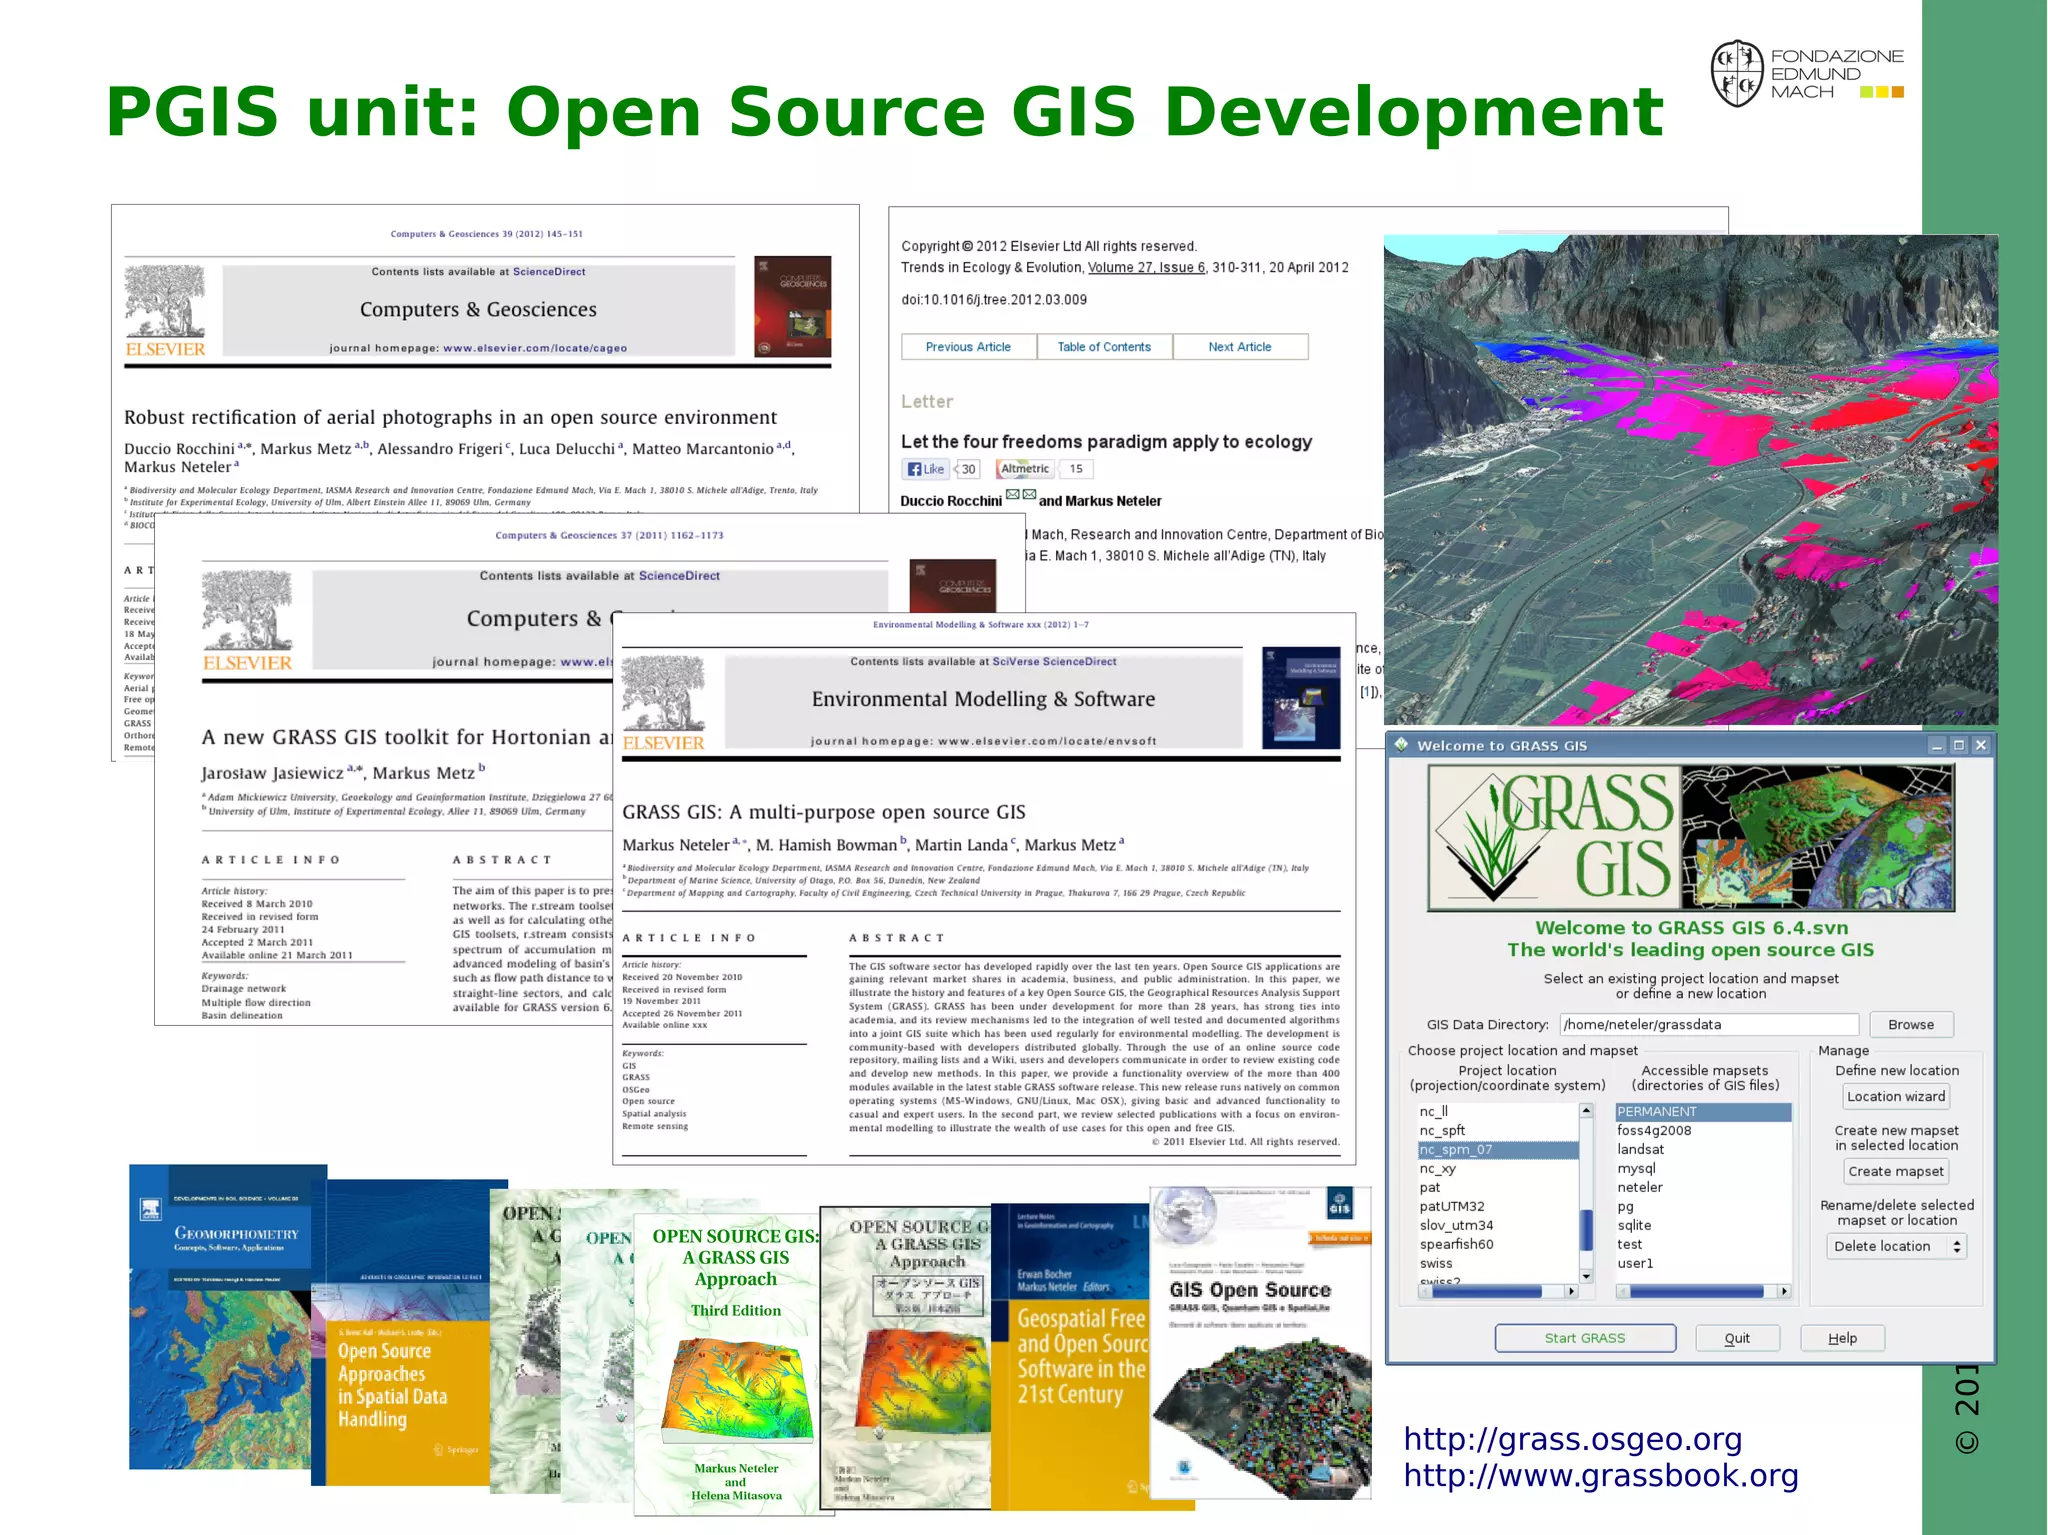
Software used for LST reconstruction
[ MODIS Reprojection Tool (MRT 4.1) ]
GDAL 1.x
PROJ.4
GRASS GIS 7
Grid Engine
(gdalwarp V1.11/VRT is much faster than MRT) [1]
Scientific Linux 6.x
PostGISomics
[1] Mosaiking of 20 MODIS LST tiles
* 17,000 overpasses reduced from
1 week to 1 day](https://image.slidesharecdn.com/vmjxbv6jr026ssy7lfnd-signature-b0e44b47cdbba60abca9752a7dbe340a7a13ec97a751914ba18df638d4e1c39a-poli-141005160649-conversion-gate01/75/Deriving-environmental-indicators-from-massive-spatial-time-series-using-open-source-GIS-13-2048.jpg)
![© 2014, Neteler et al. - http://gis.cri.fmach.it/
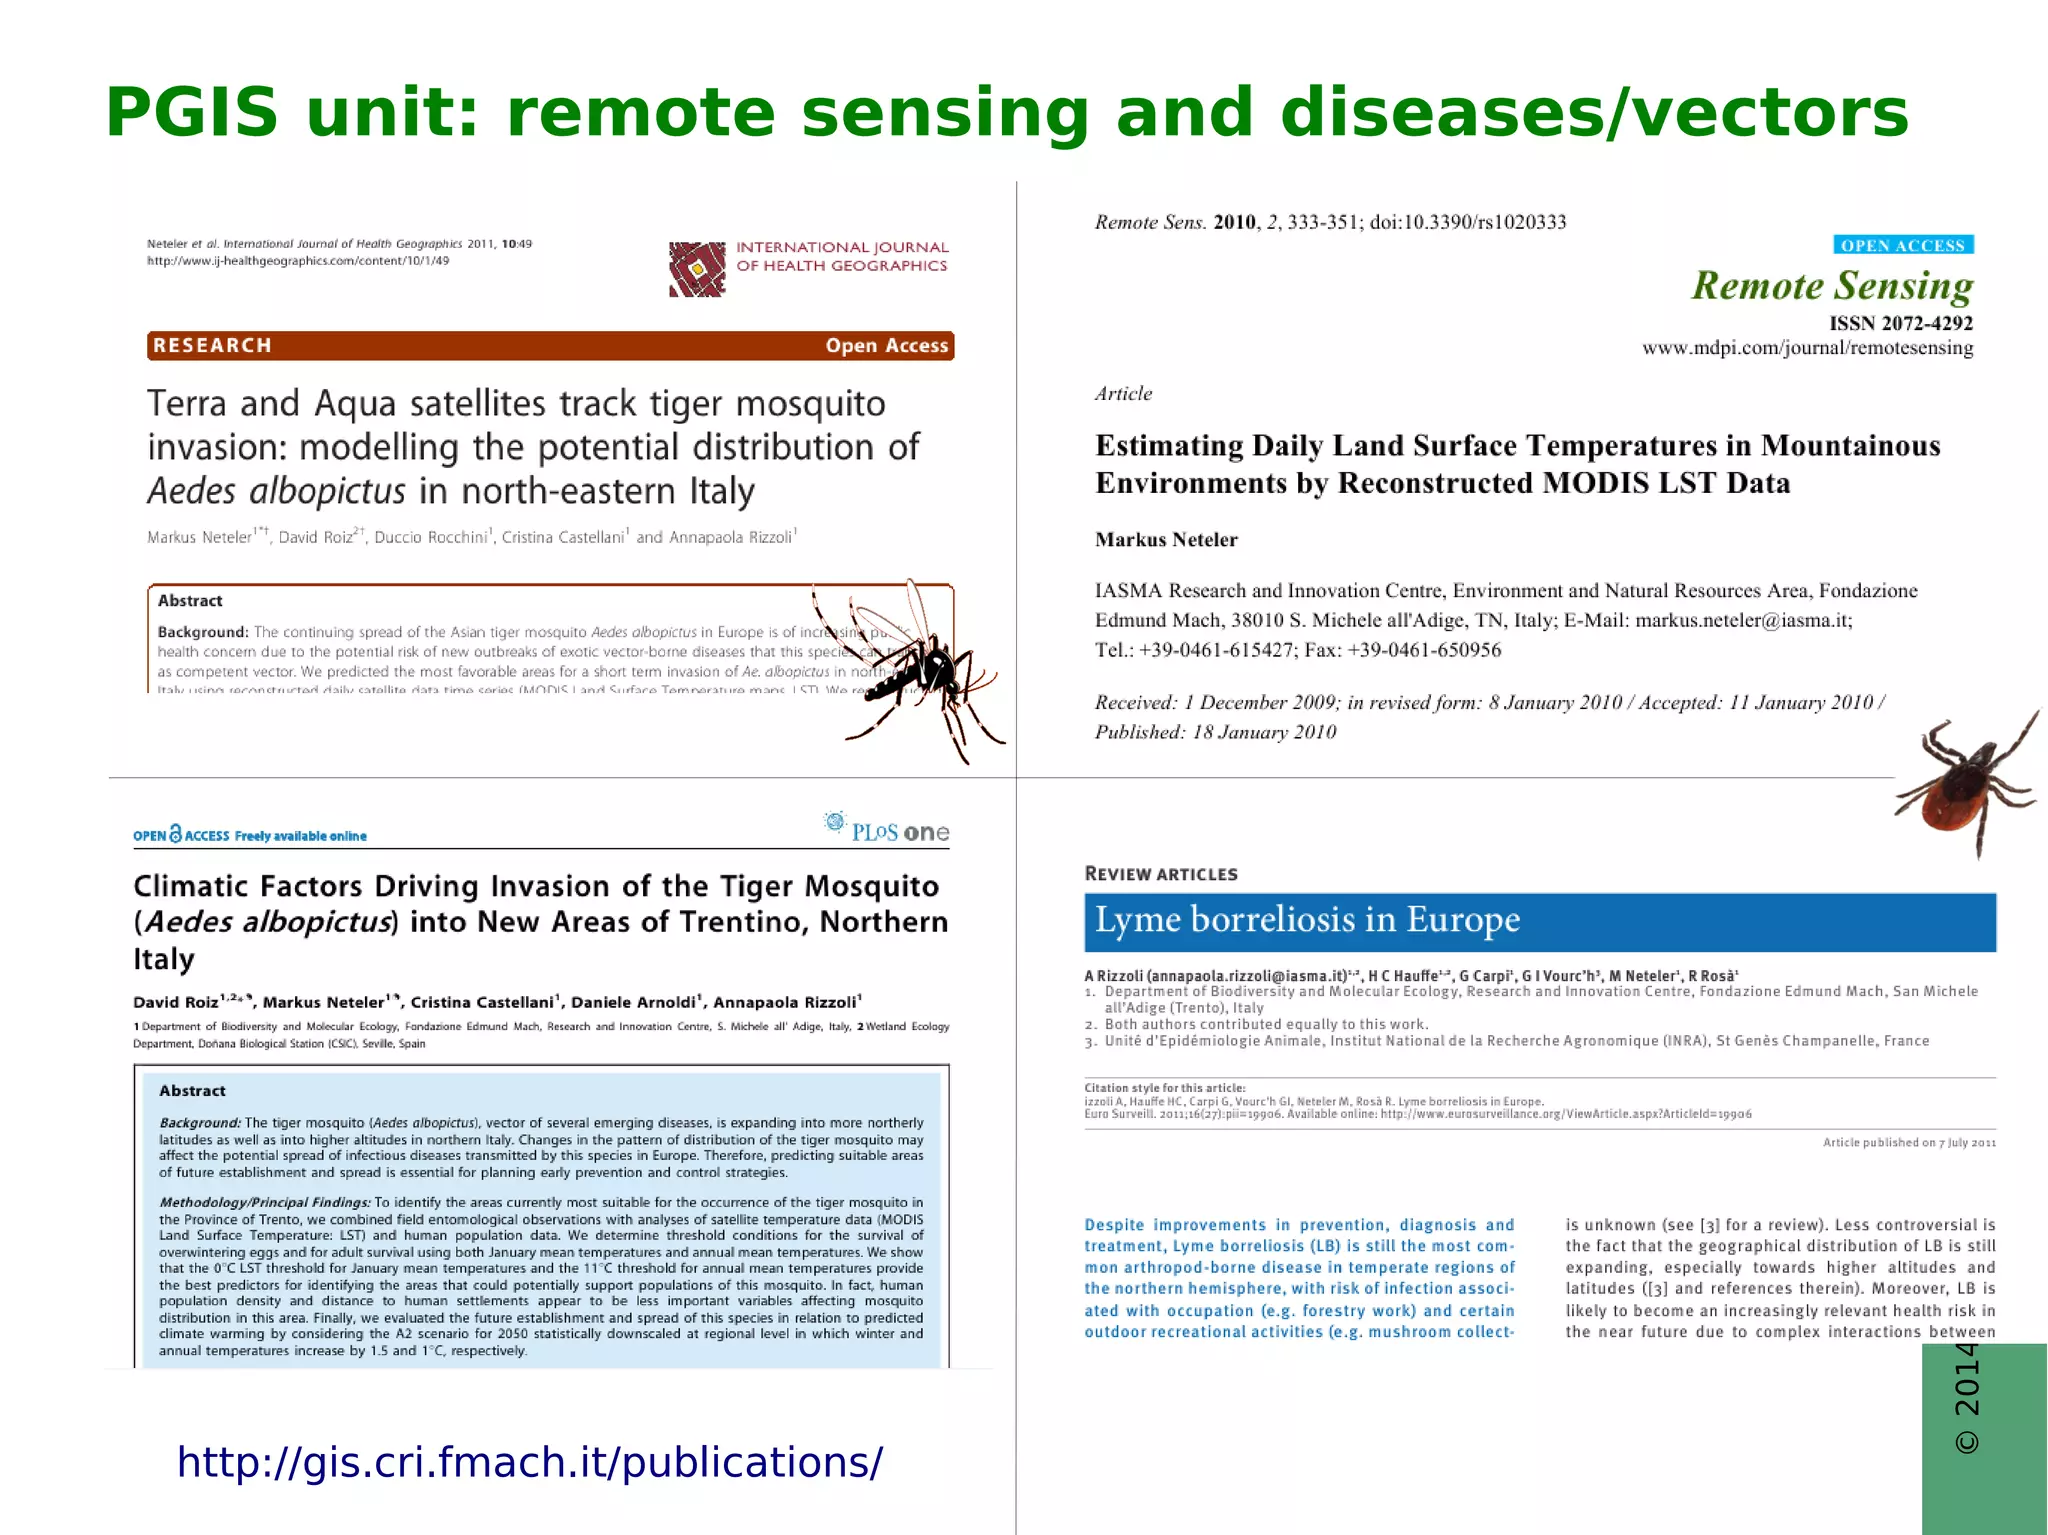
MODIS Land Surface Temperature
Examples:
“Hot” year 2003
and effects in
January 2004
January 2004: Lake Garda still “warm” after hot 2003 summer
--> local heating effect = insect overwintering facilitated
Neteler et al. (2013). PLoS ONE, 8(12): e82090 [DOI]](https://image.slidesharecdn.com/vmjxbv6jr026ssy7lfnd-signature-b0e44b47cdbba60abca9752a7dbe340a7a13ec97a751914ba18df638d4e1c39a-poli-141005160649-conversion-gate01/75/Deriving-environmental-indicators-from-massive-spatial-time-series-using-open-source-GIS-16-2048.jpg)

![© 2014, Neteler et al. - http://gis.cri.fmach.it/
Assessing urban heat islands
The example of Milan city, Italy in 2003
Number of combined hot days (>35 °C)
and warm nights (>20 °C)
ECA&D data set EuroLST (MODIS LST)
~ 25km resolution 250m resolution
SRS EPSG: 3035
Refs:
● EEA, http://www.eea.europa.eu/data-and-maps/explore-interactive-maps/heat-wave-risk-of-european-cities-1
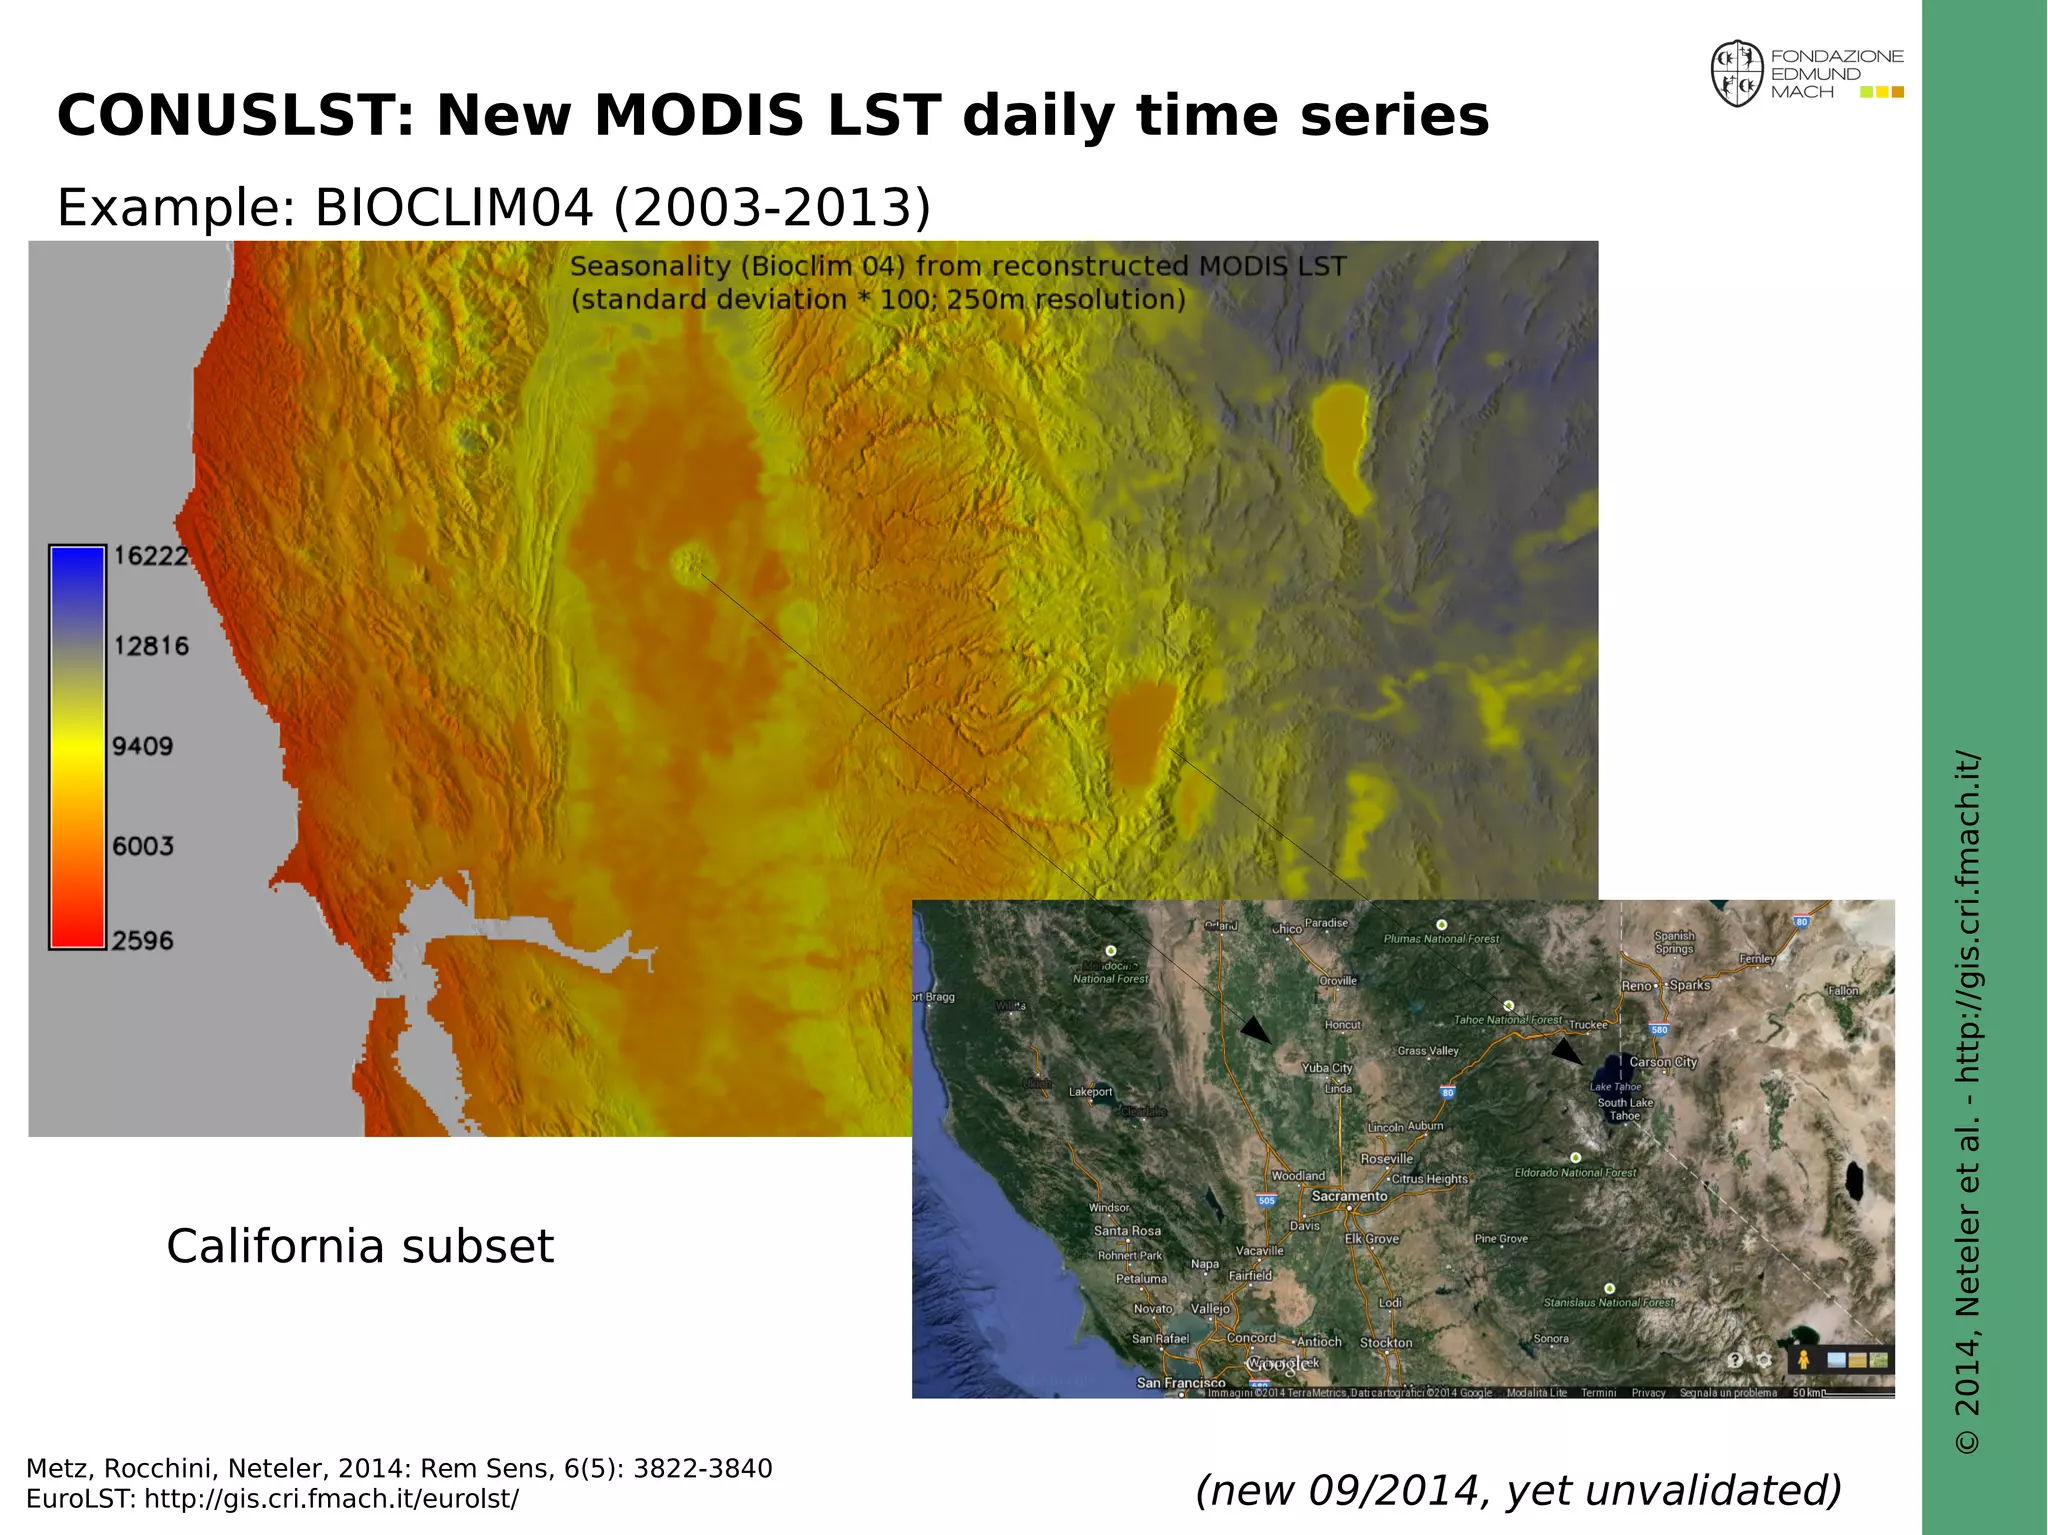
● Metz, Rocchini, Neteler, 2014: Rem Sens, 6(5): 3822-3840 [DOI]](https://image.slidesharecdn.com/vmjxbv6jr026ssy7lfnd-signature-b0e44b47cdbba60abca9752a7dbe340a7a13ec97a751914ba18df638d4e1c39a-poli-141005160649-conversion-gate01/75/Deriving-environmental-indicators-from-massive-spatial-time-series-using-open-source-GIS-31-2048.jpg)
![© 2014, Neteler et al. - http://gis.cri.fmach.it/
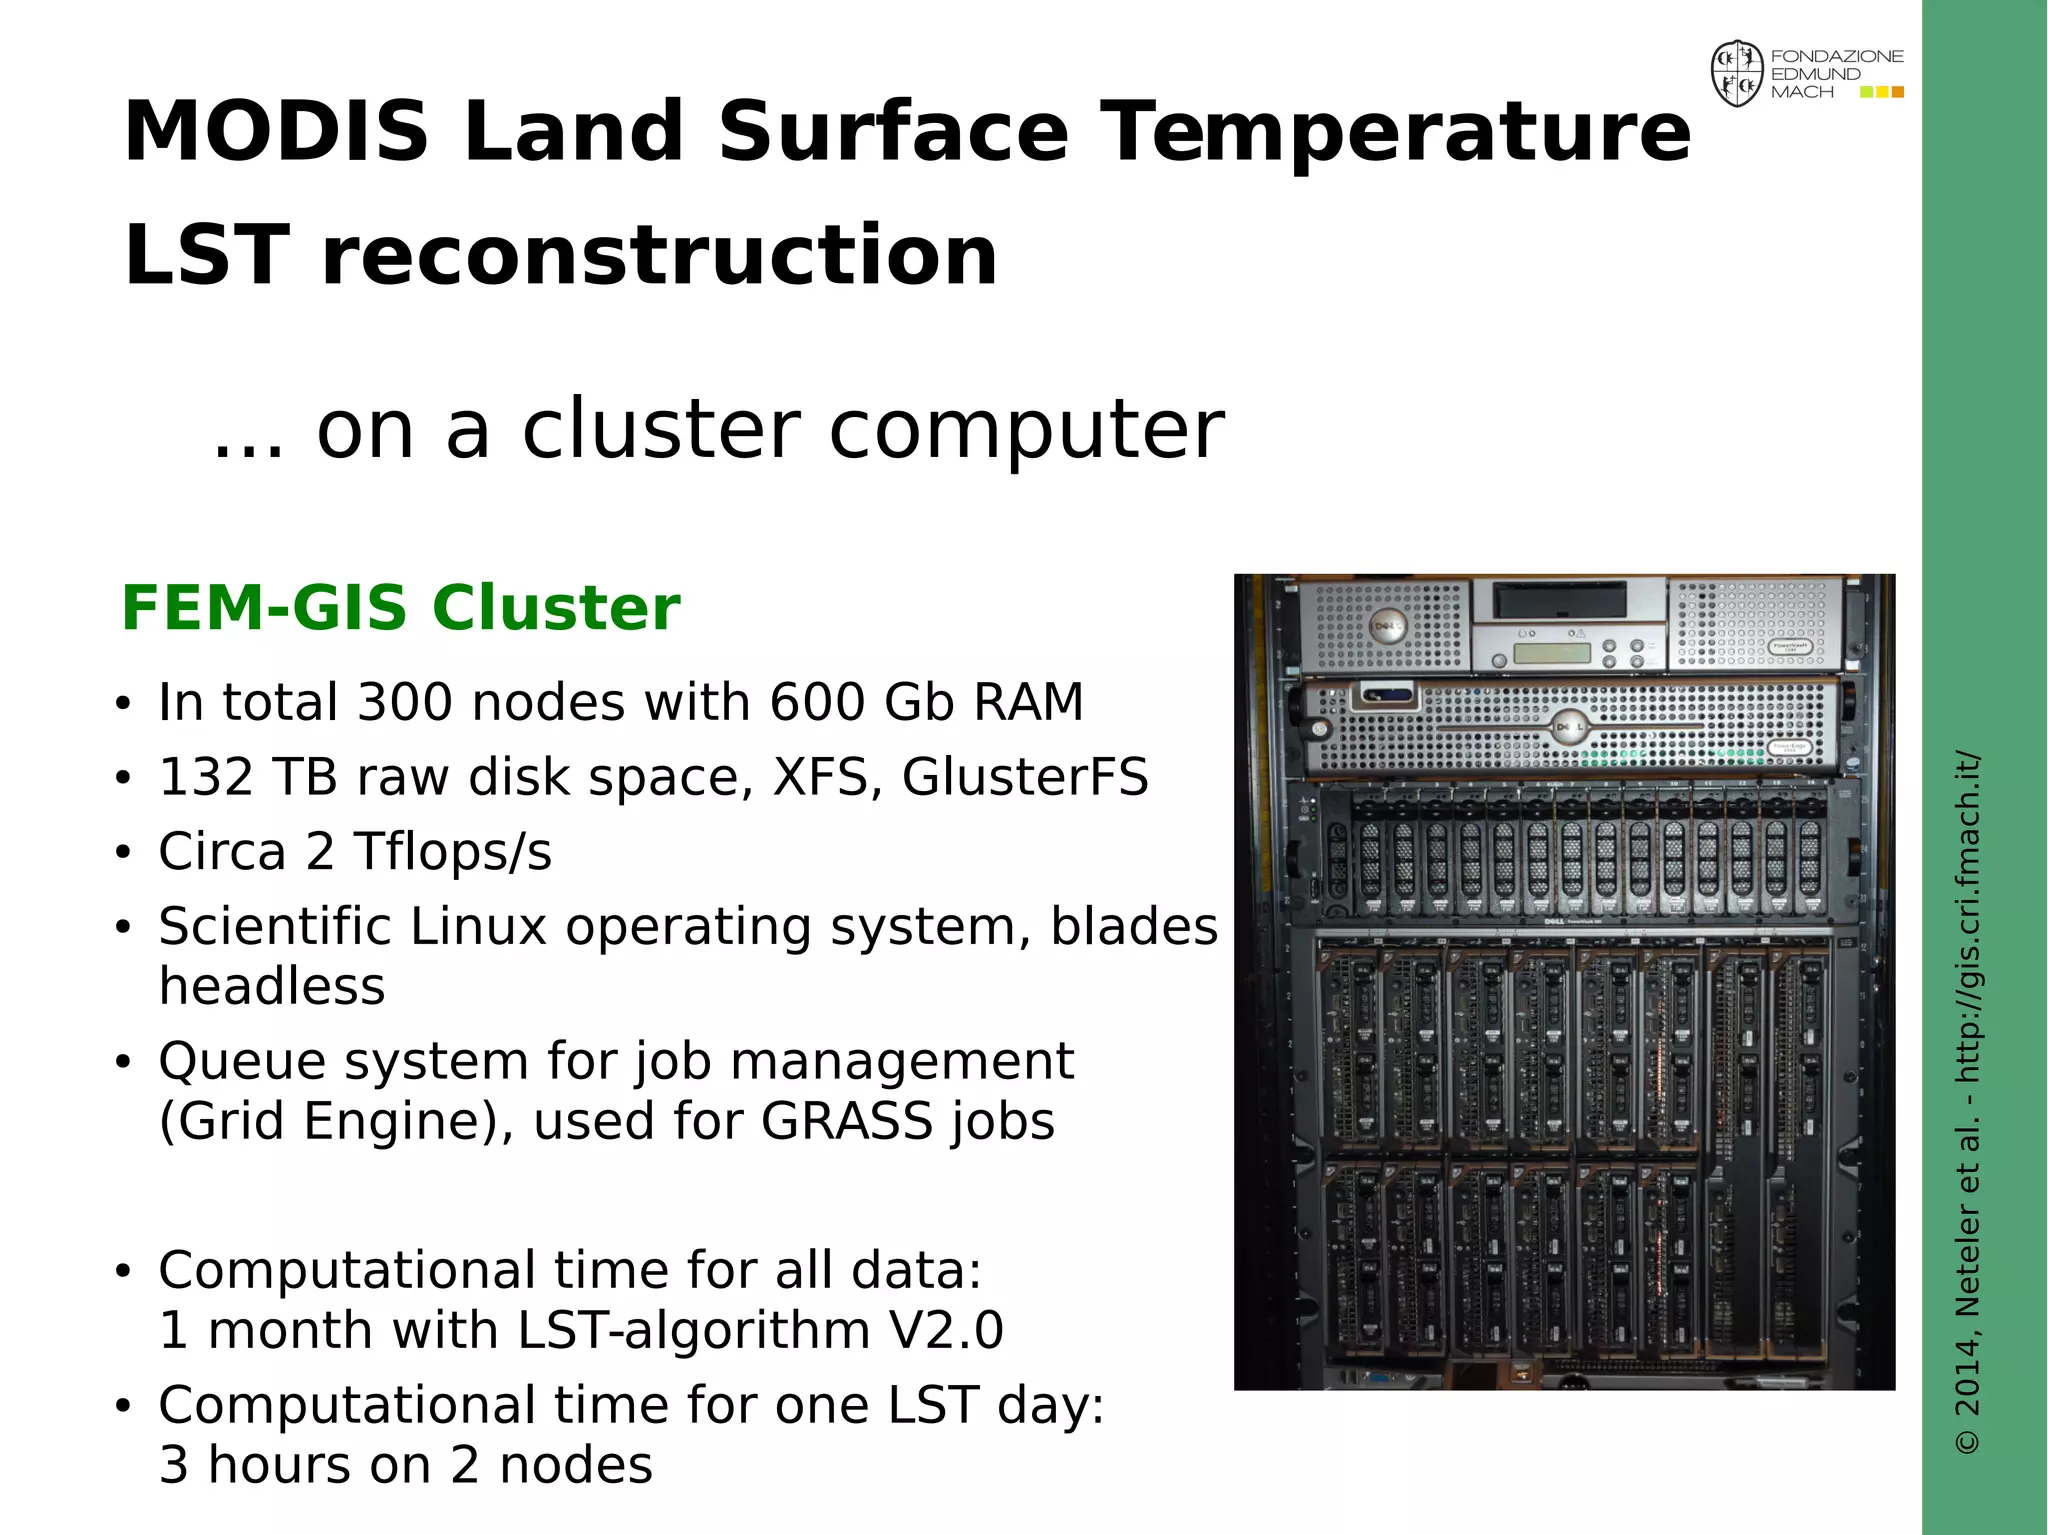
“Big data” challenges on a cluster
GRASS GIS – LST data processing “evolution”:
● 2008: internal 10Gb network connection way to slow...
Solution: TCP jumbo frames enabled (MTU > 8000) to
speed up the internal NFS transfer
● 2009: hitting an ext3 filesystem limitation (not more than
32k subdirectories but more files in cell_misc/ – each raster
maps consists of multiple files)
Solution: adopting XFS filesystem [err, reformat everything]
● 2012: Free inodes on XFS exceeded
Solution: Update XFS version [err, reformat everything again]
● 2013: I/O saturation in NFS connection between chassis and
blades
Solution: reduction to one job per blade (queue management),
21 blades * 2.5 billion input pixels + 415 million output pixels
● GlusterFS saturation
Solution: New 48 port switch, 8-channel trunking (= 8 Gb/s)
](https://image.slidesharecdn.com/vmjxbv6jr026ssy7lfnd-signature-b0e44b47cdbba60abca9752a7dbe340a7a13ec97a751914ba18df638d4e1c39a-poli-141005160649-conversion-gate01/75/Deriving-environmental-indicators-from-massive-spatial-time-series-using-open-source-GIS-38-2048.jpg)

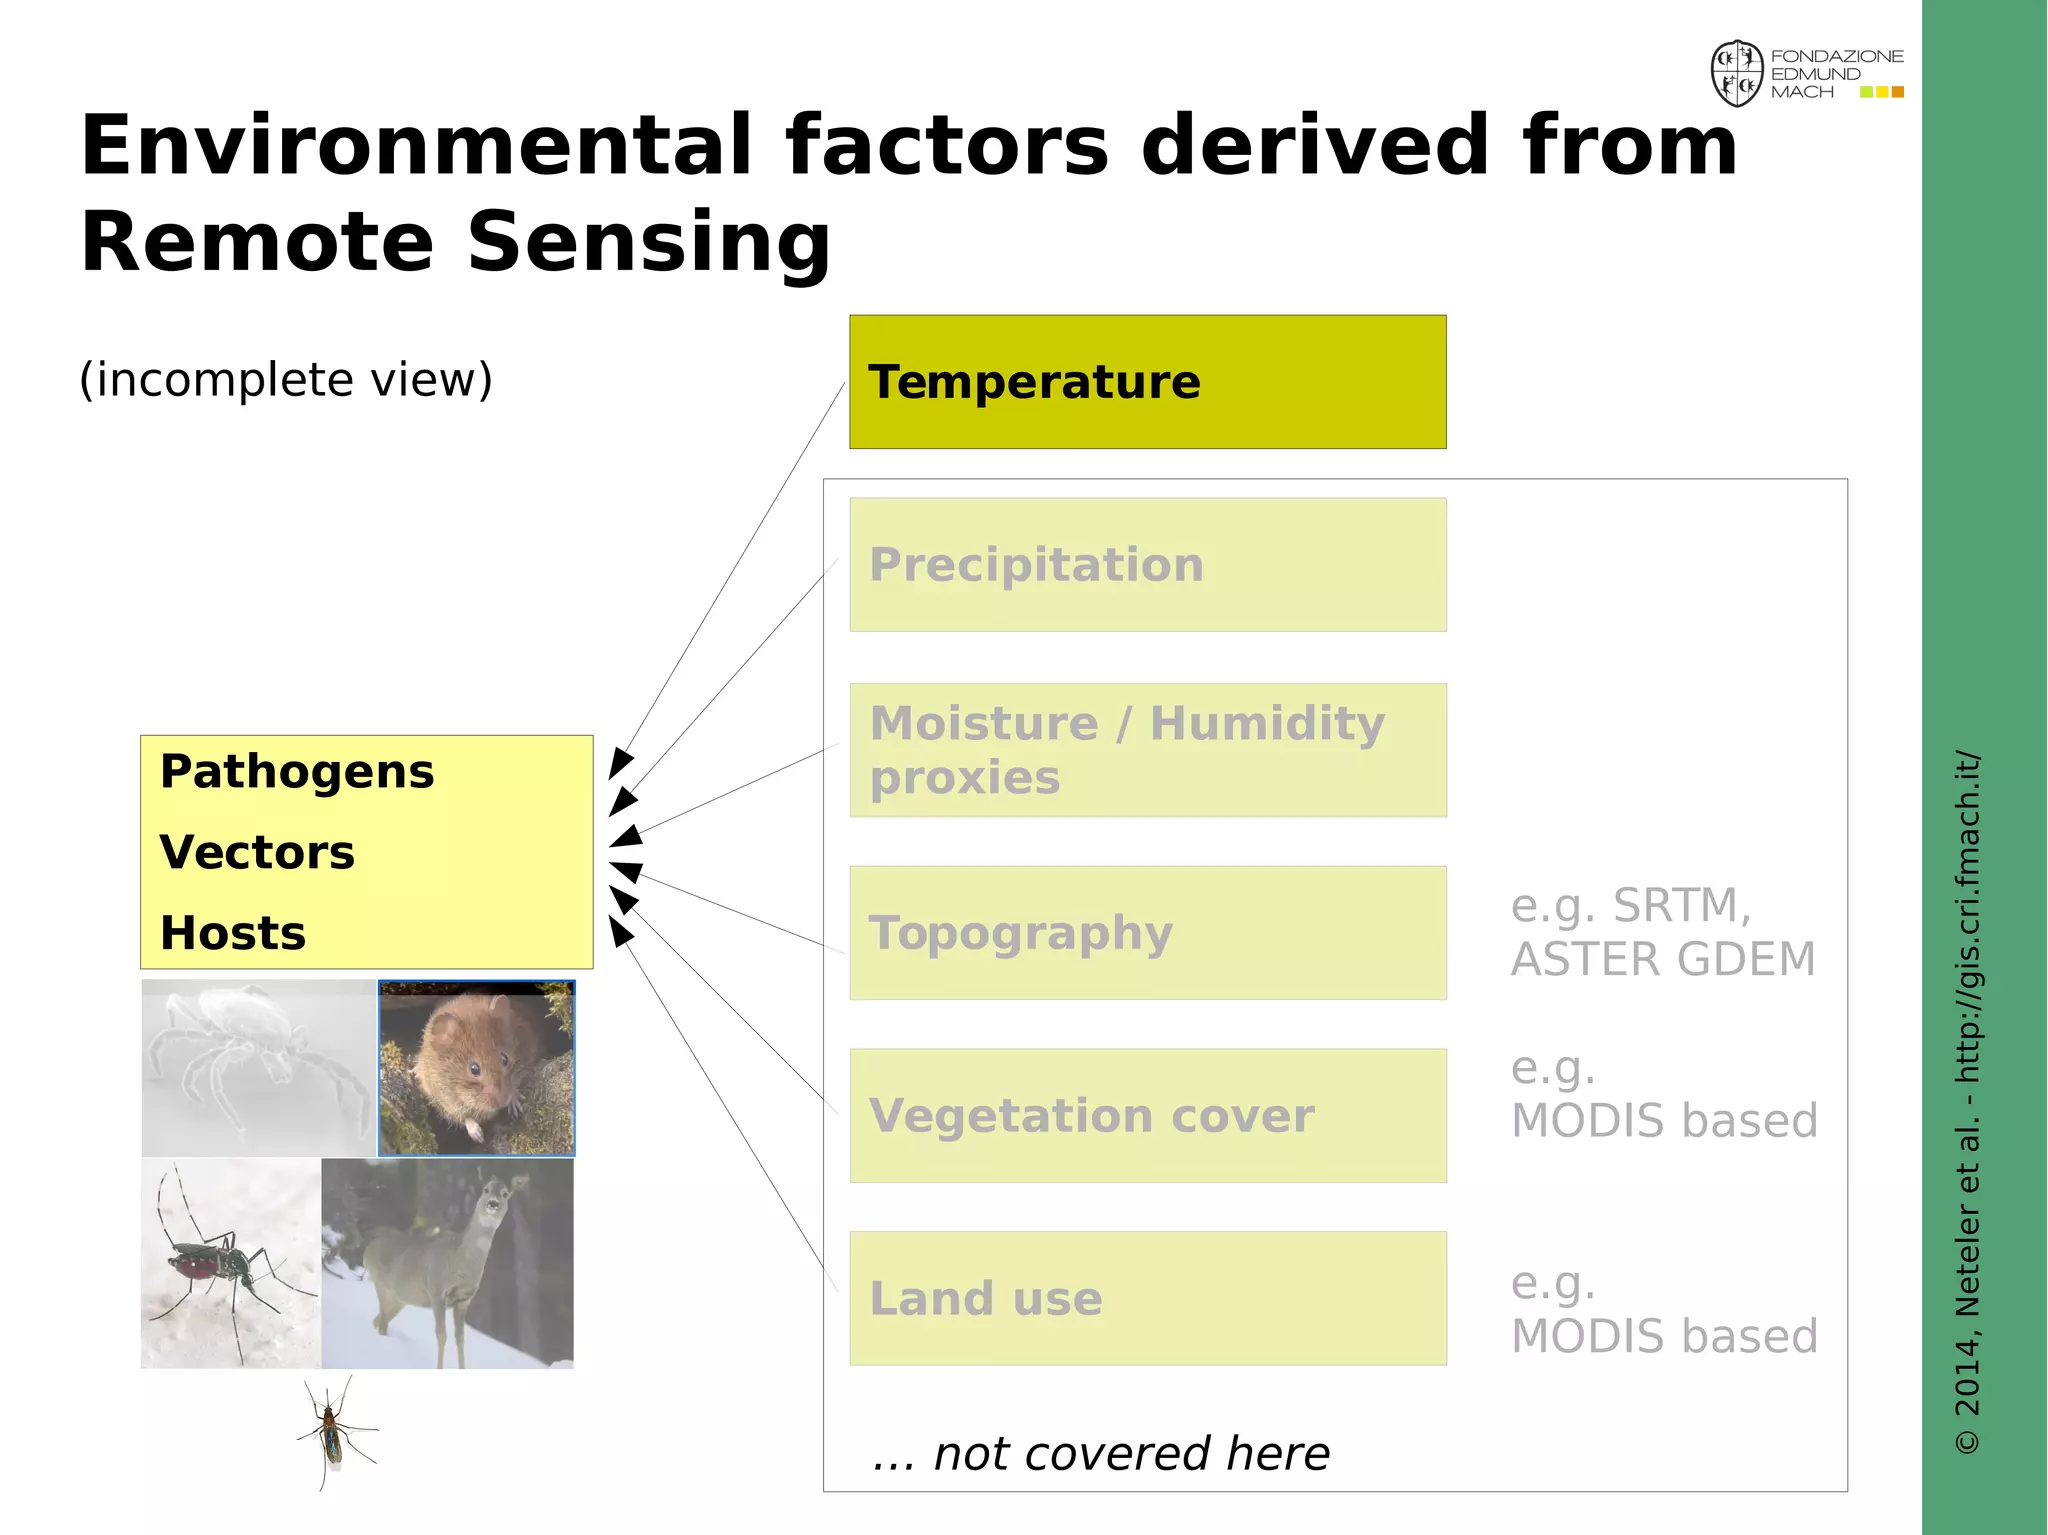
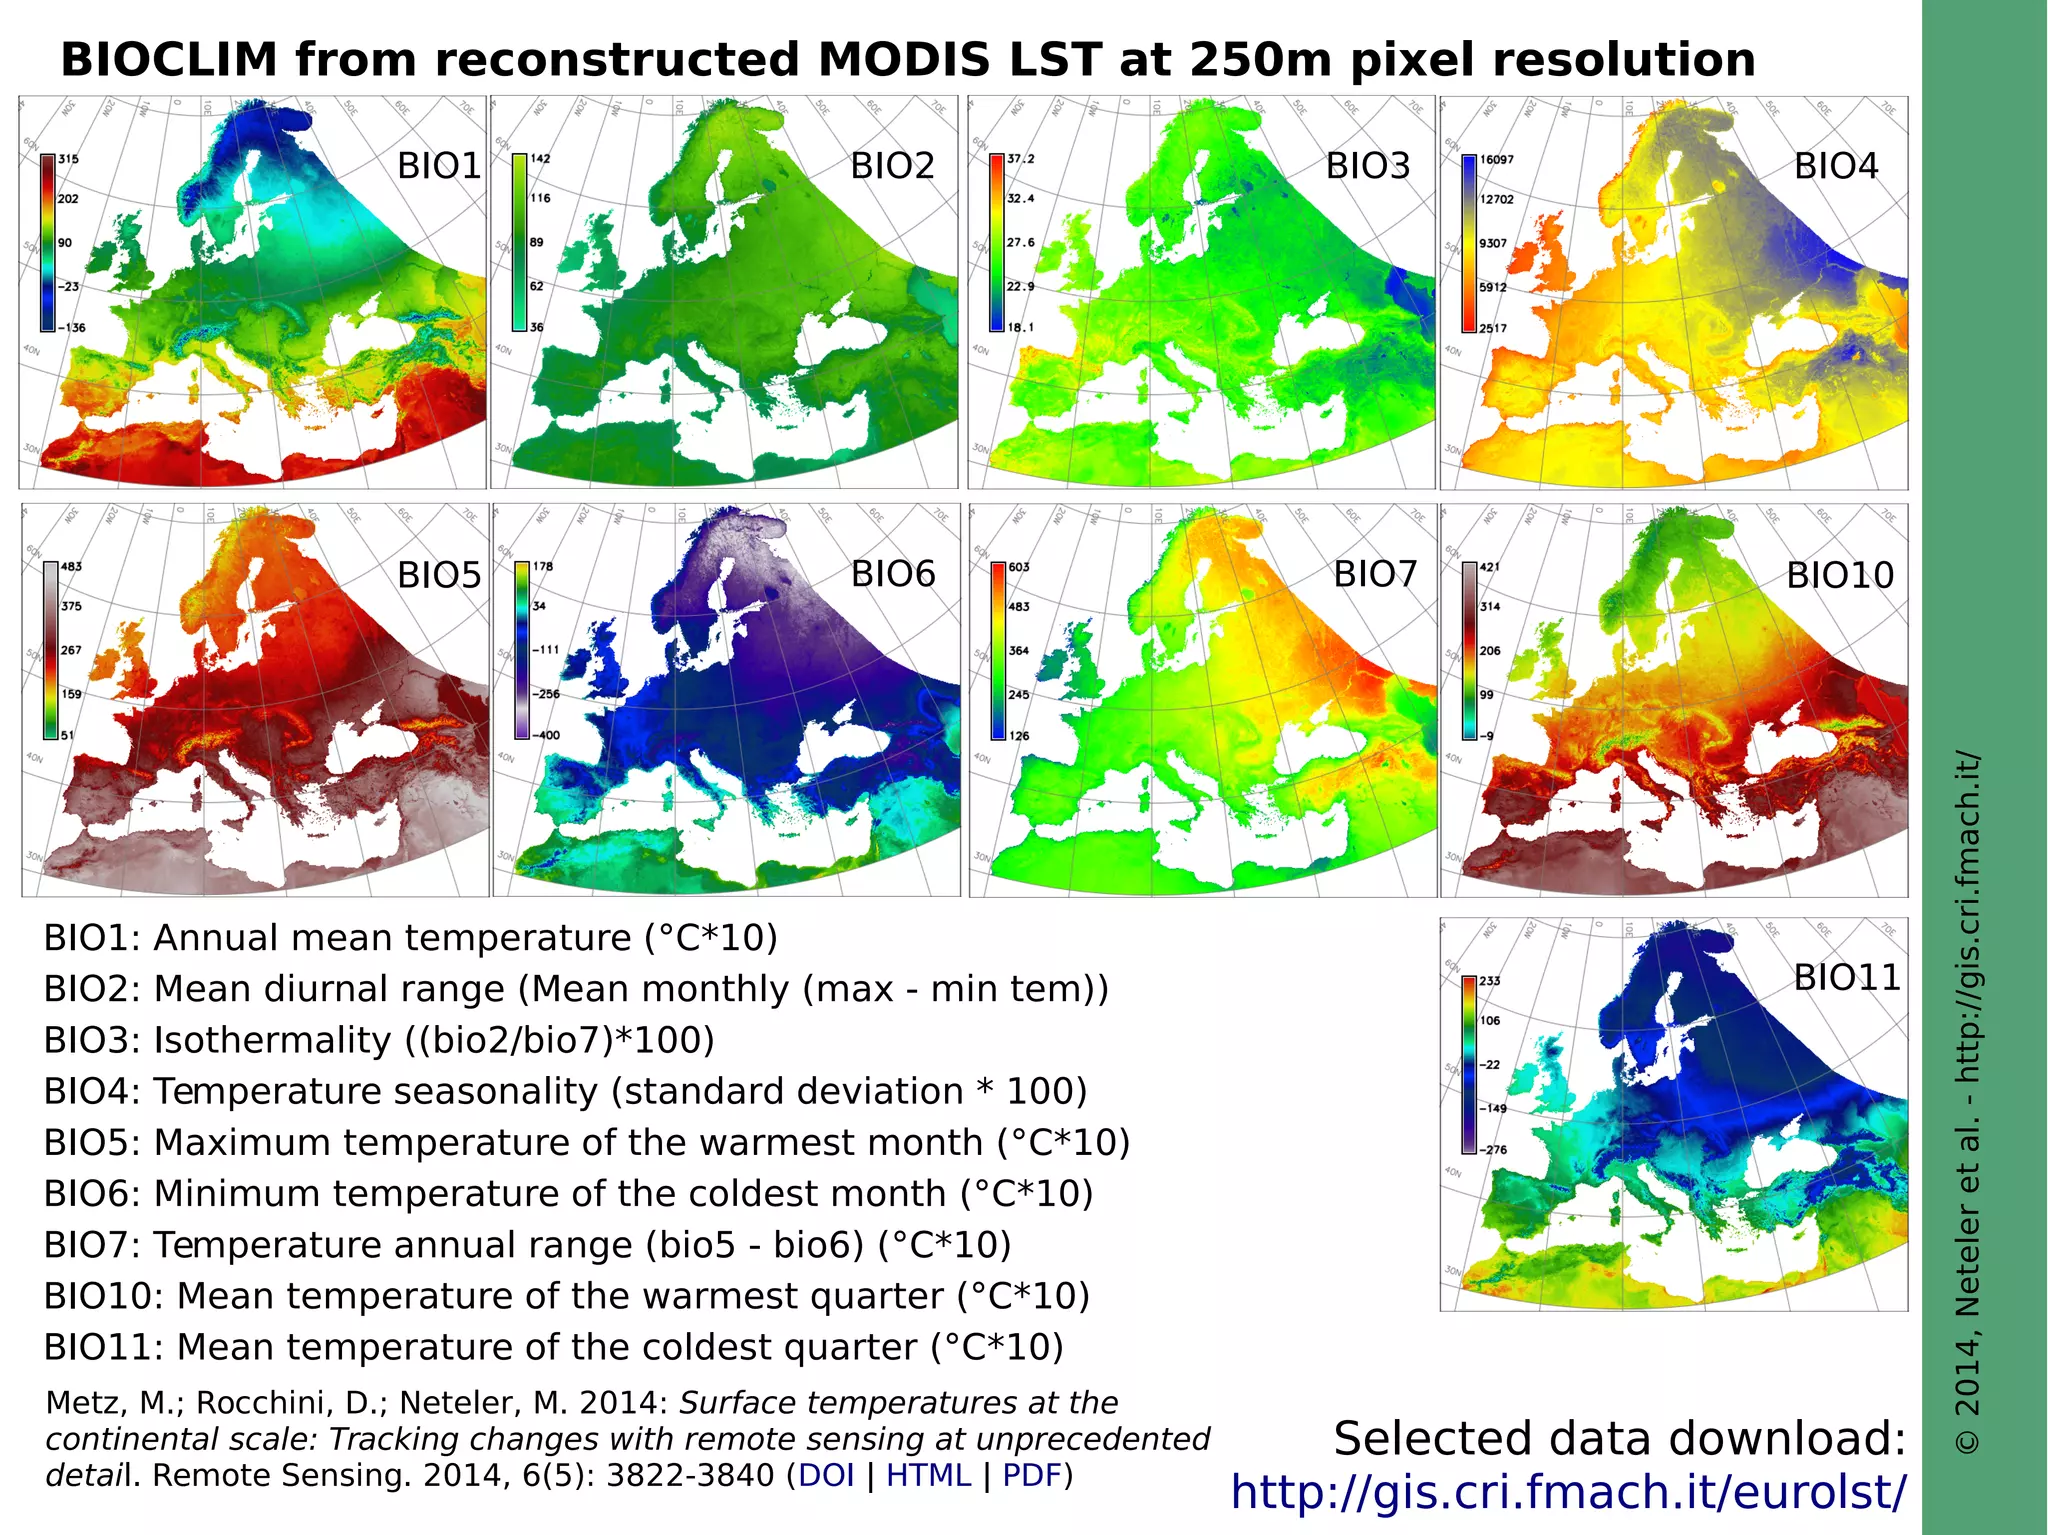
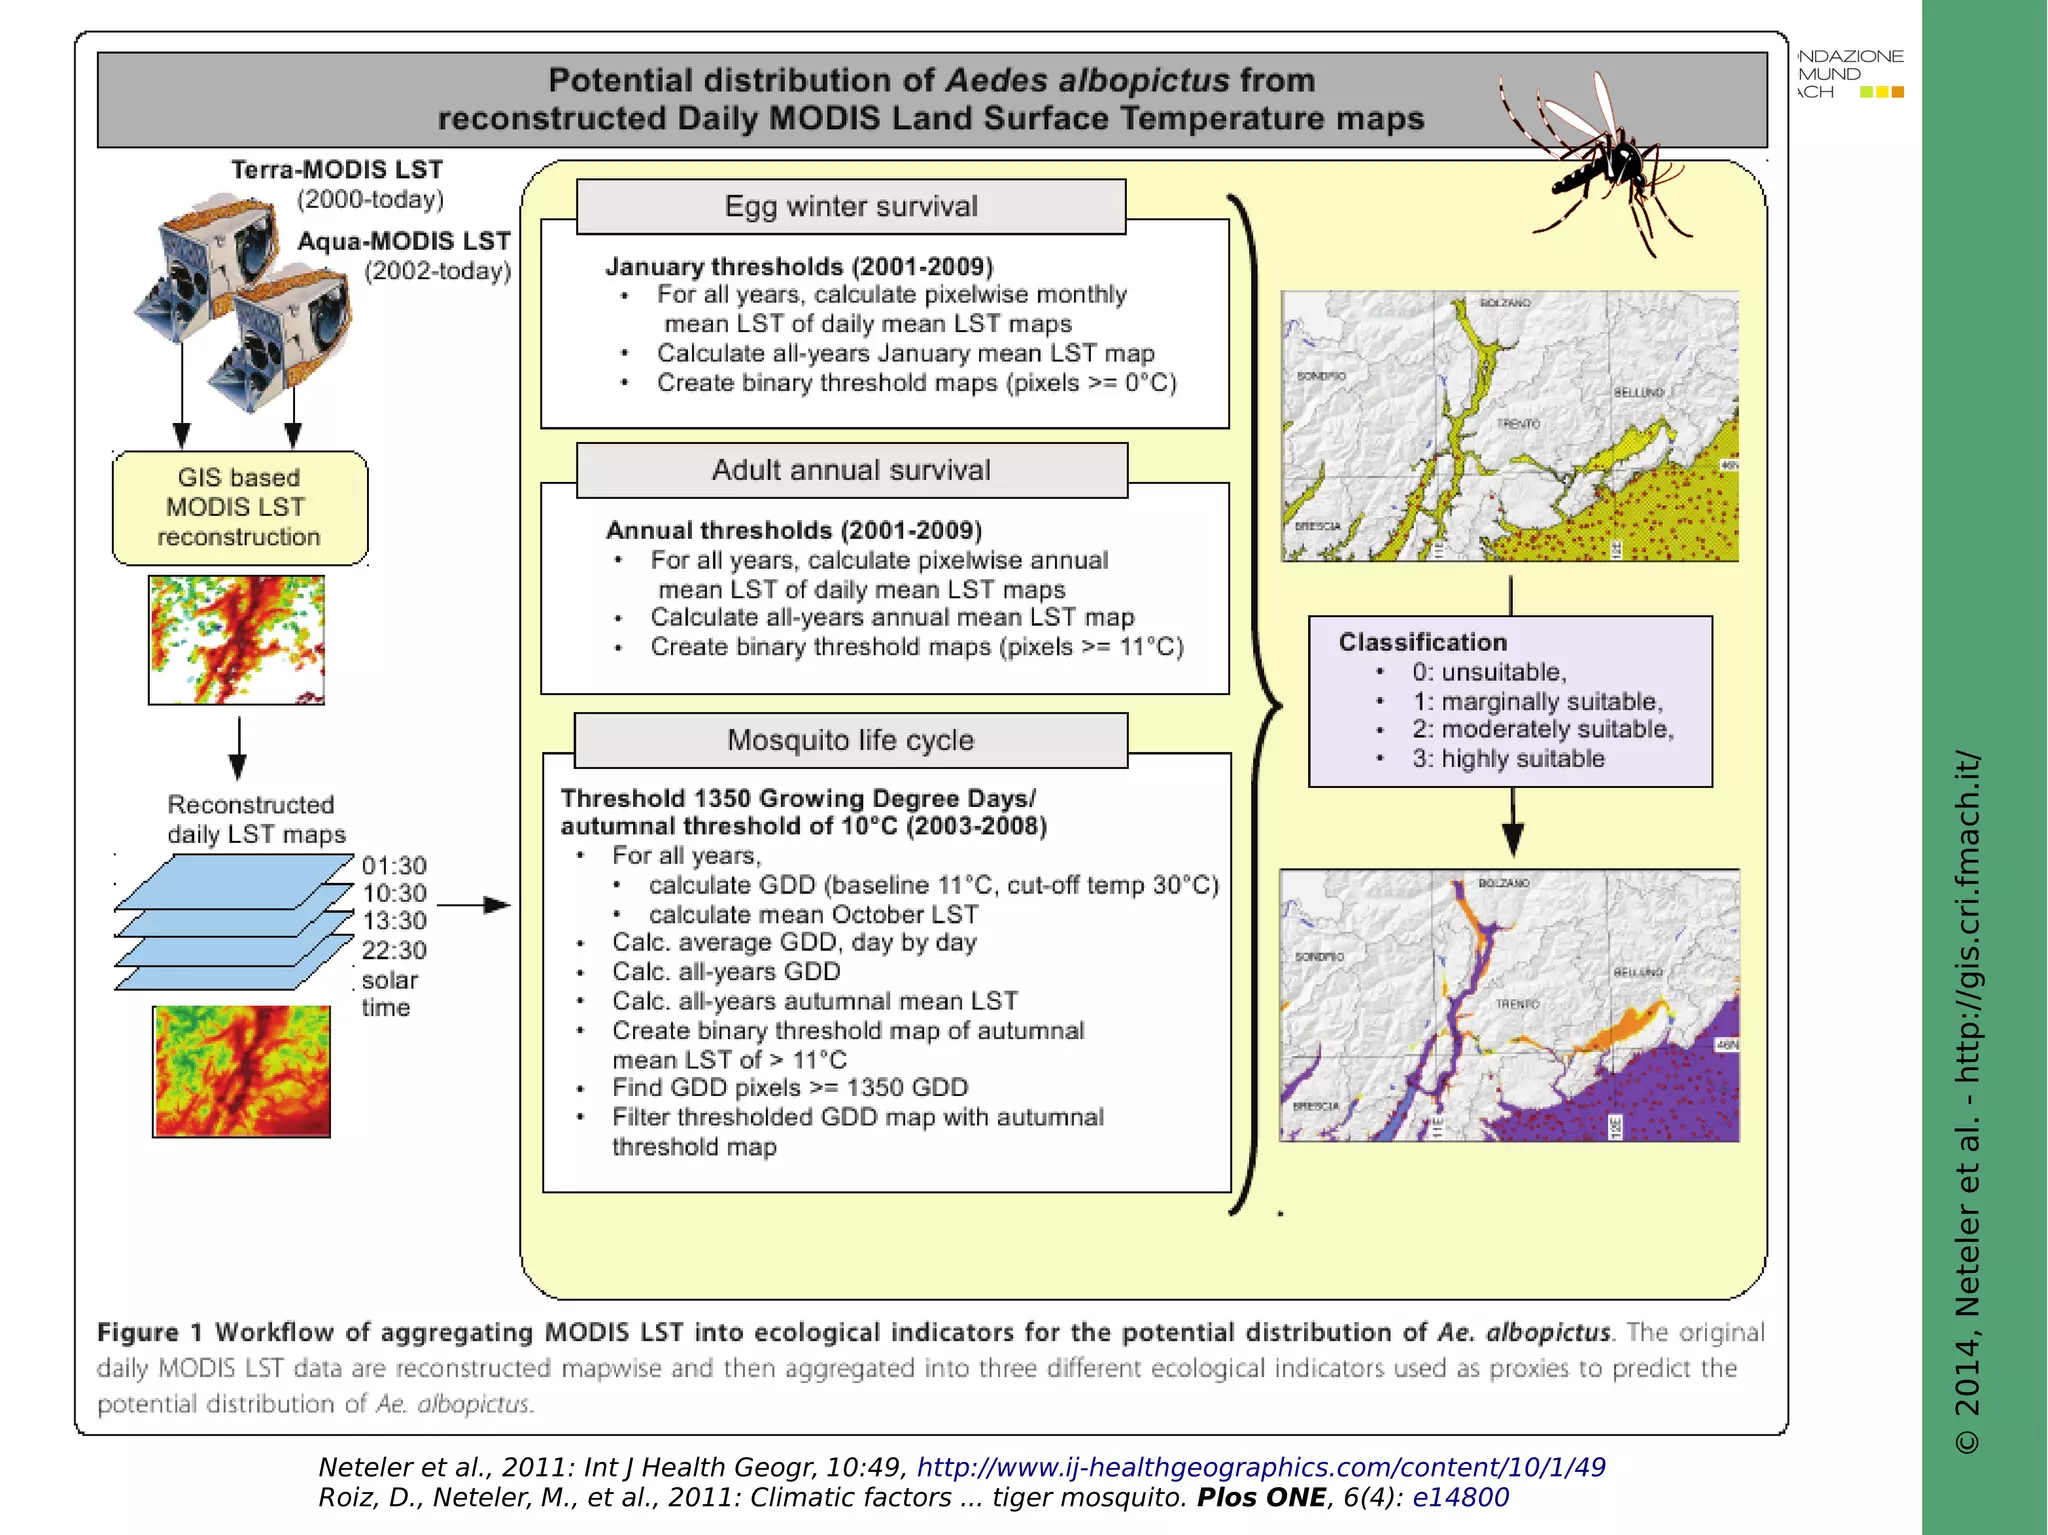
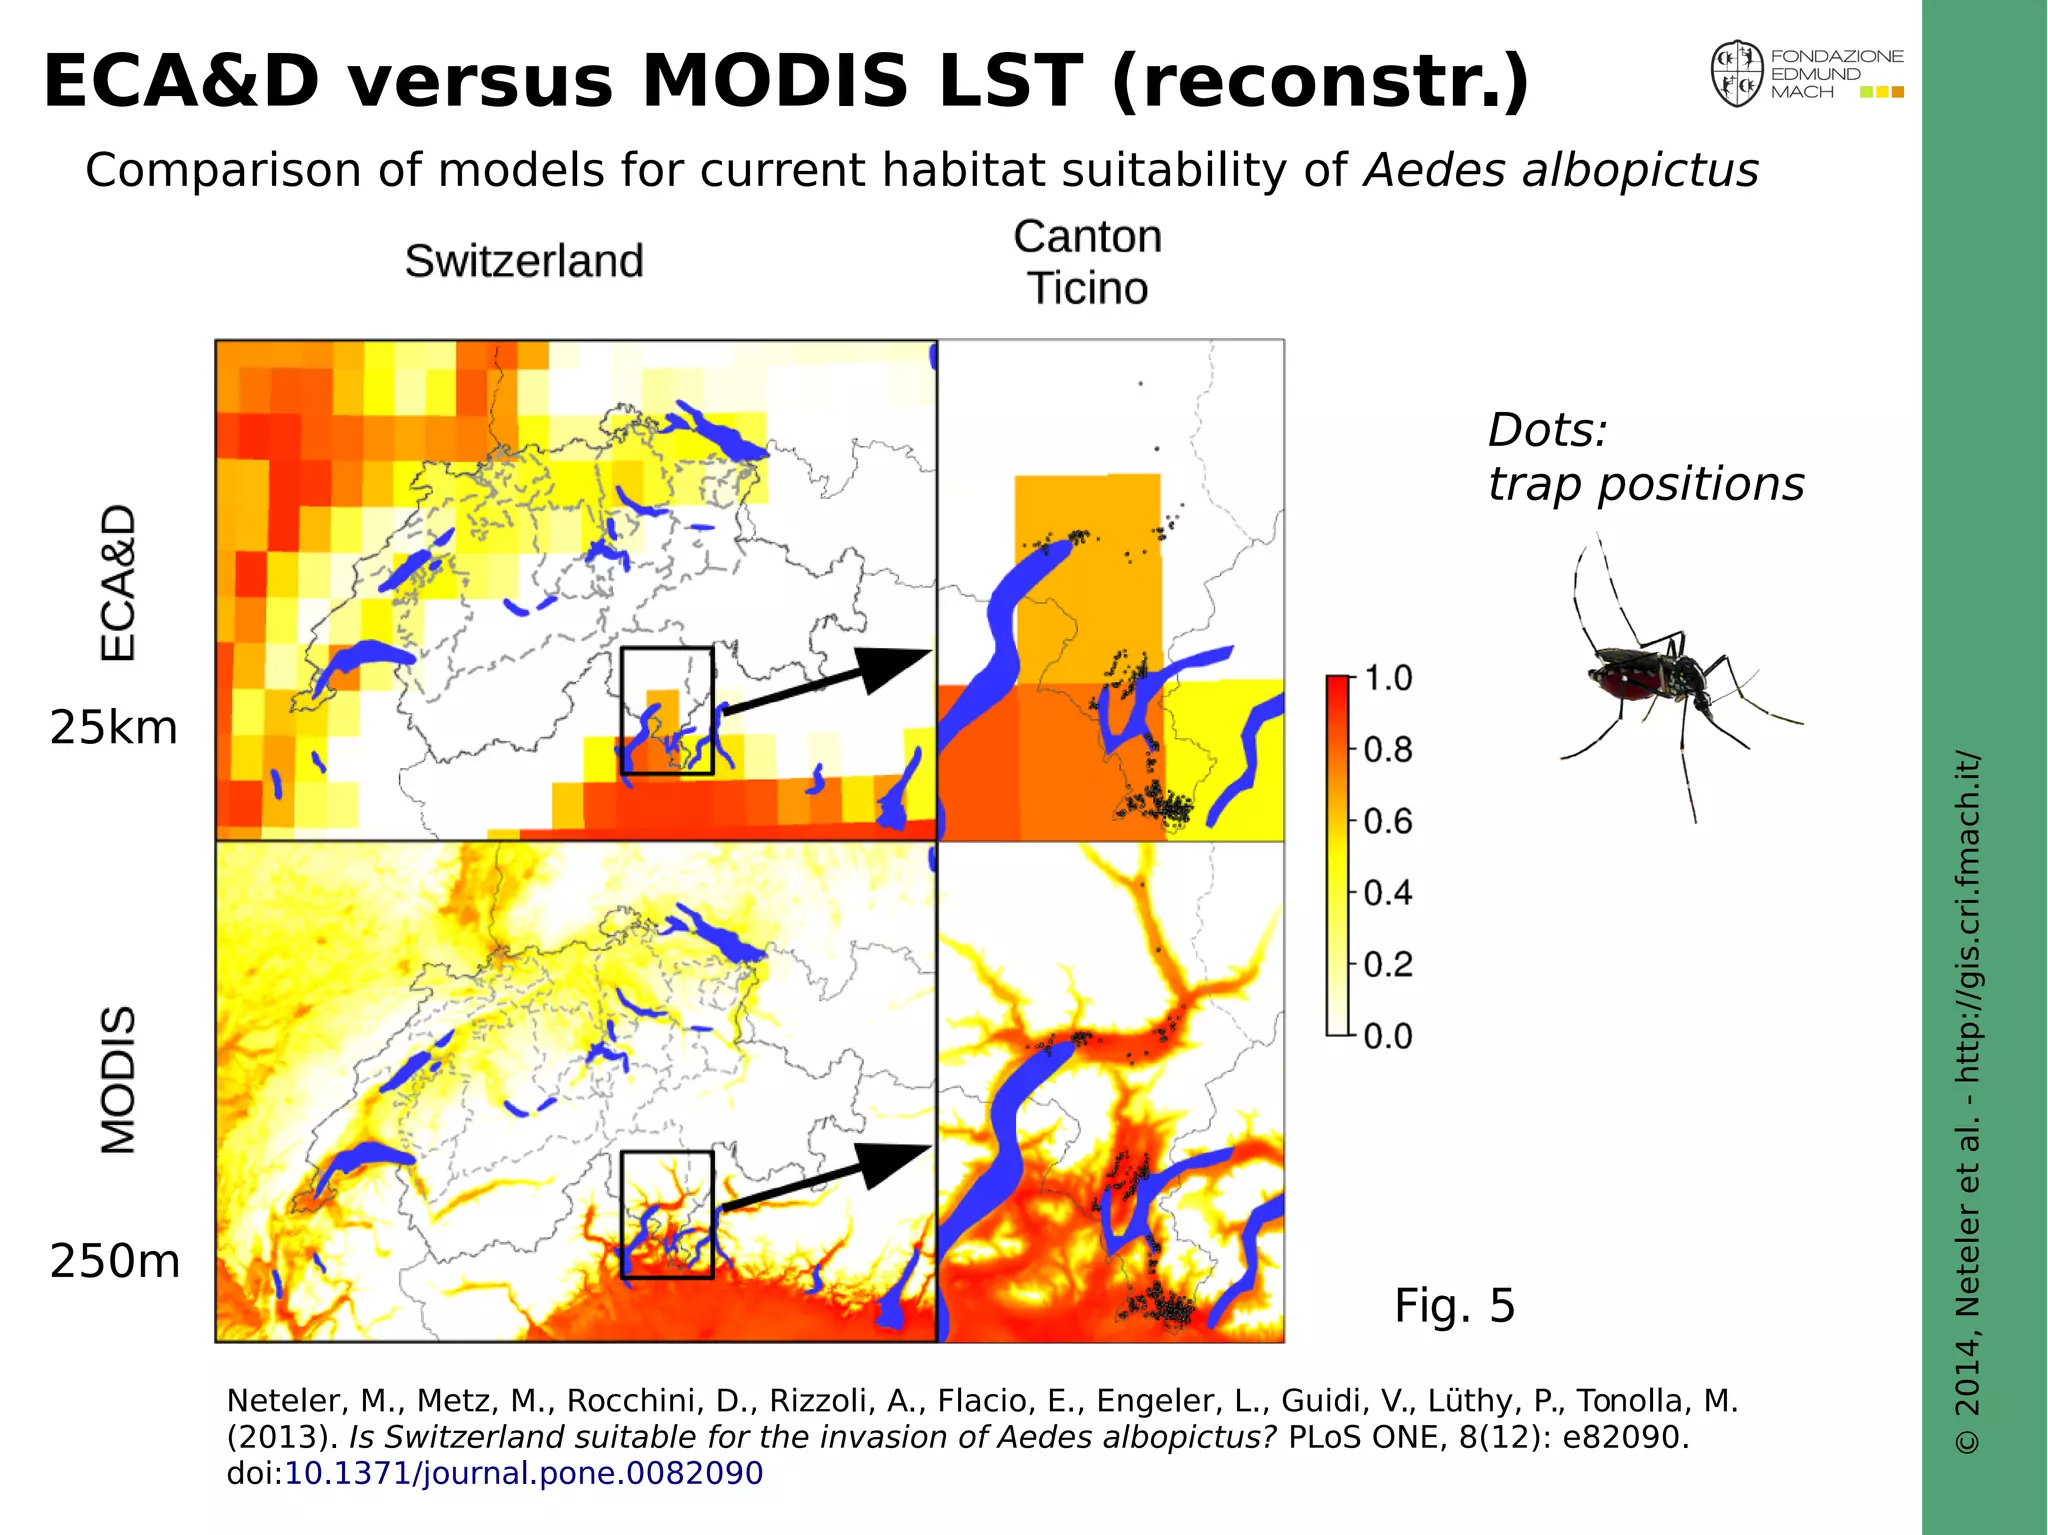
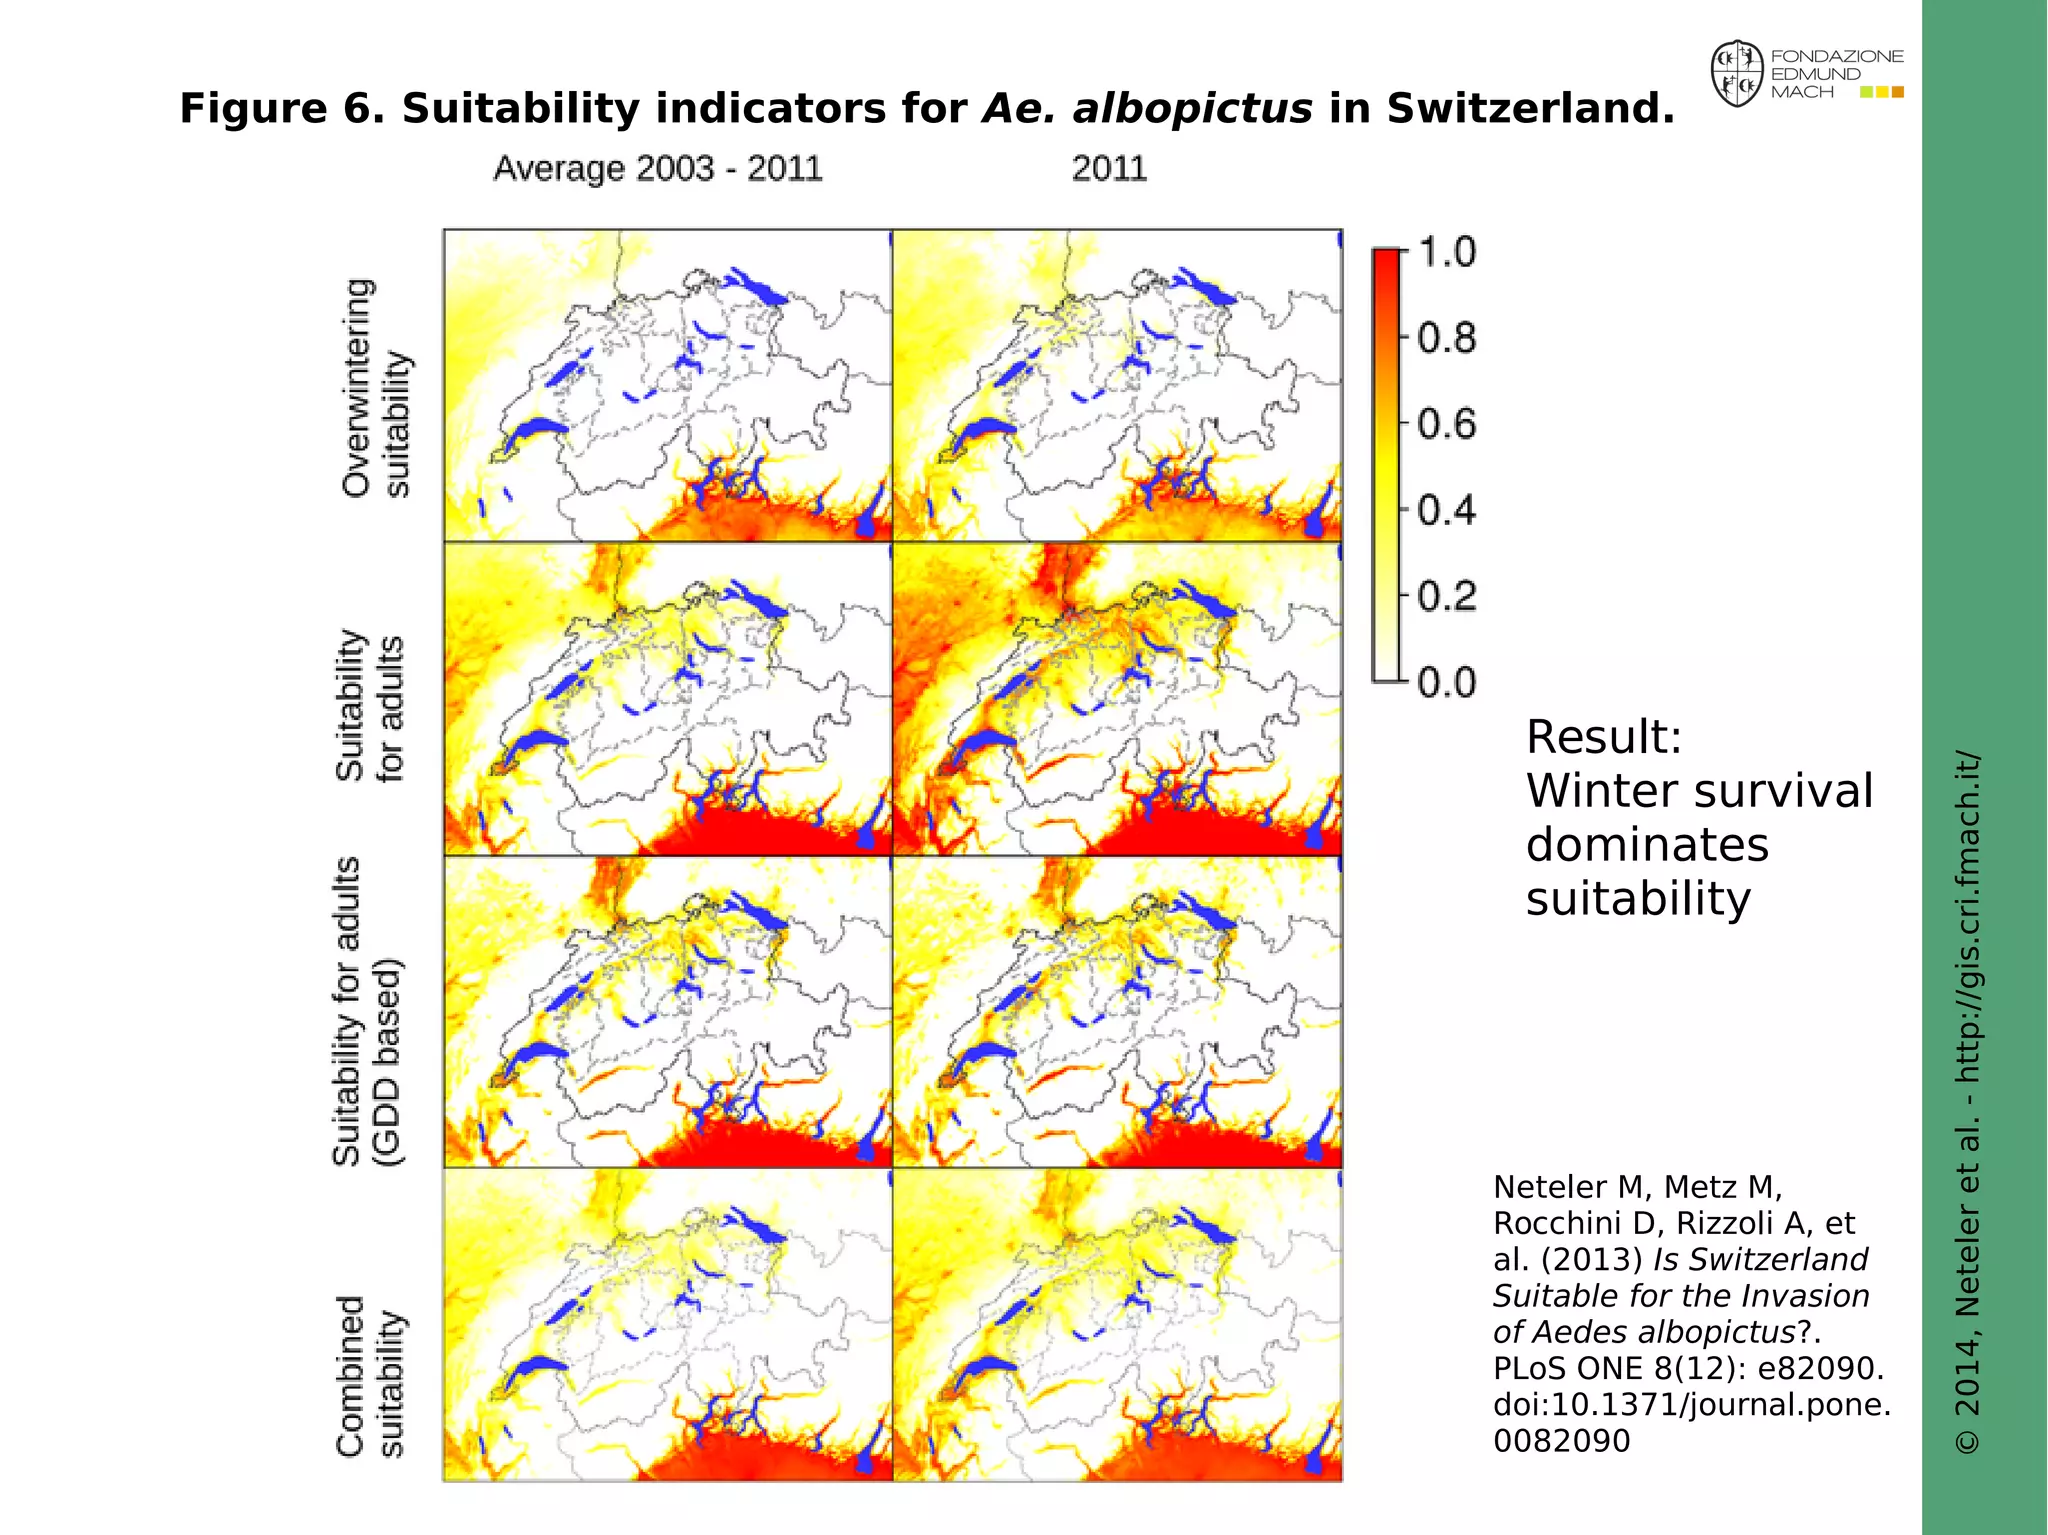
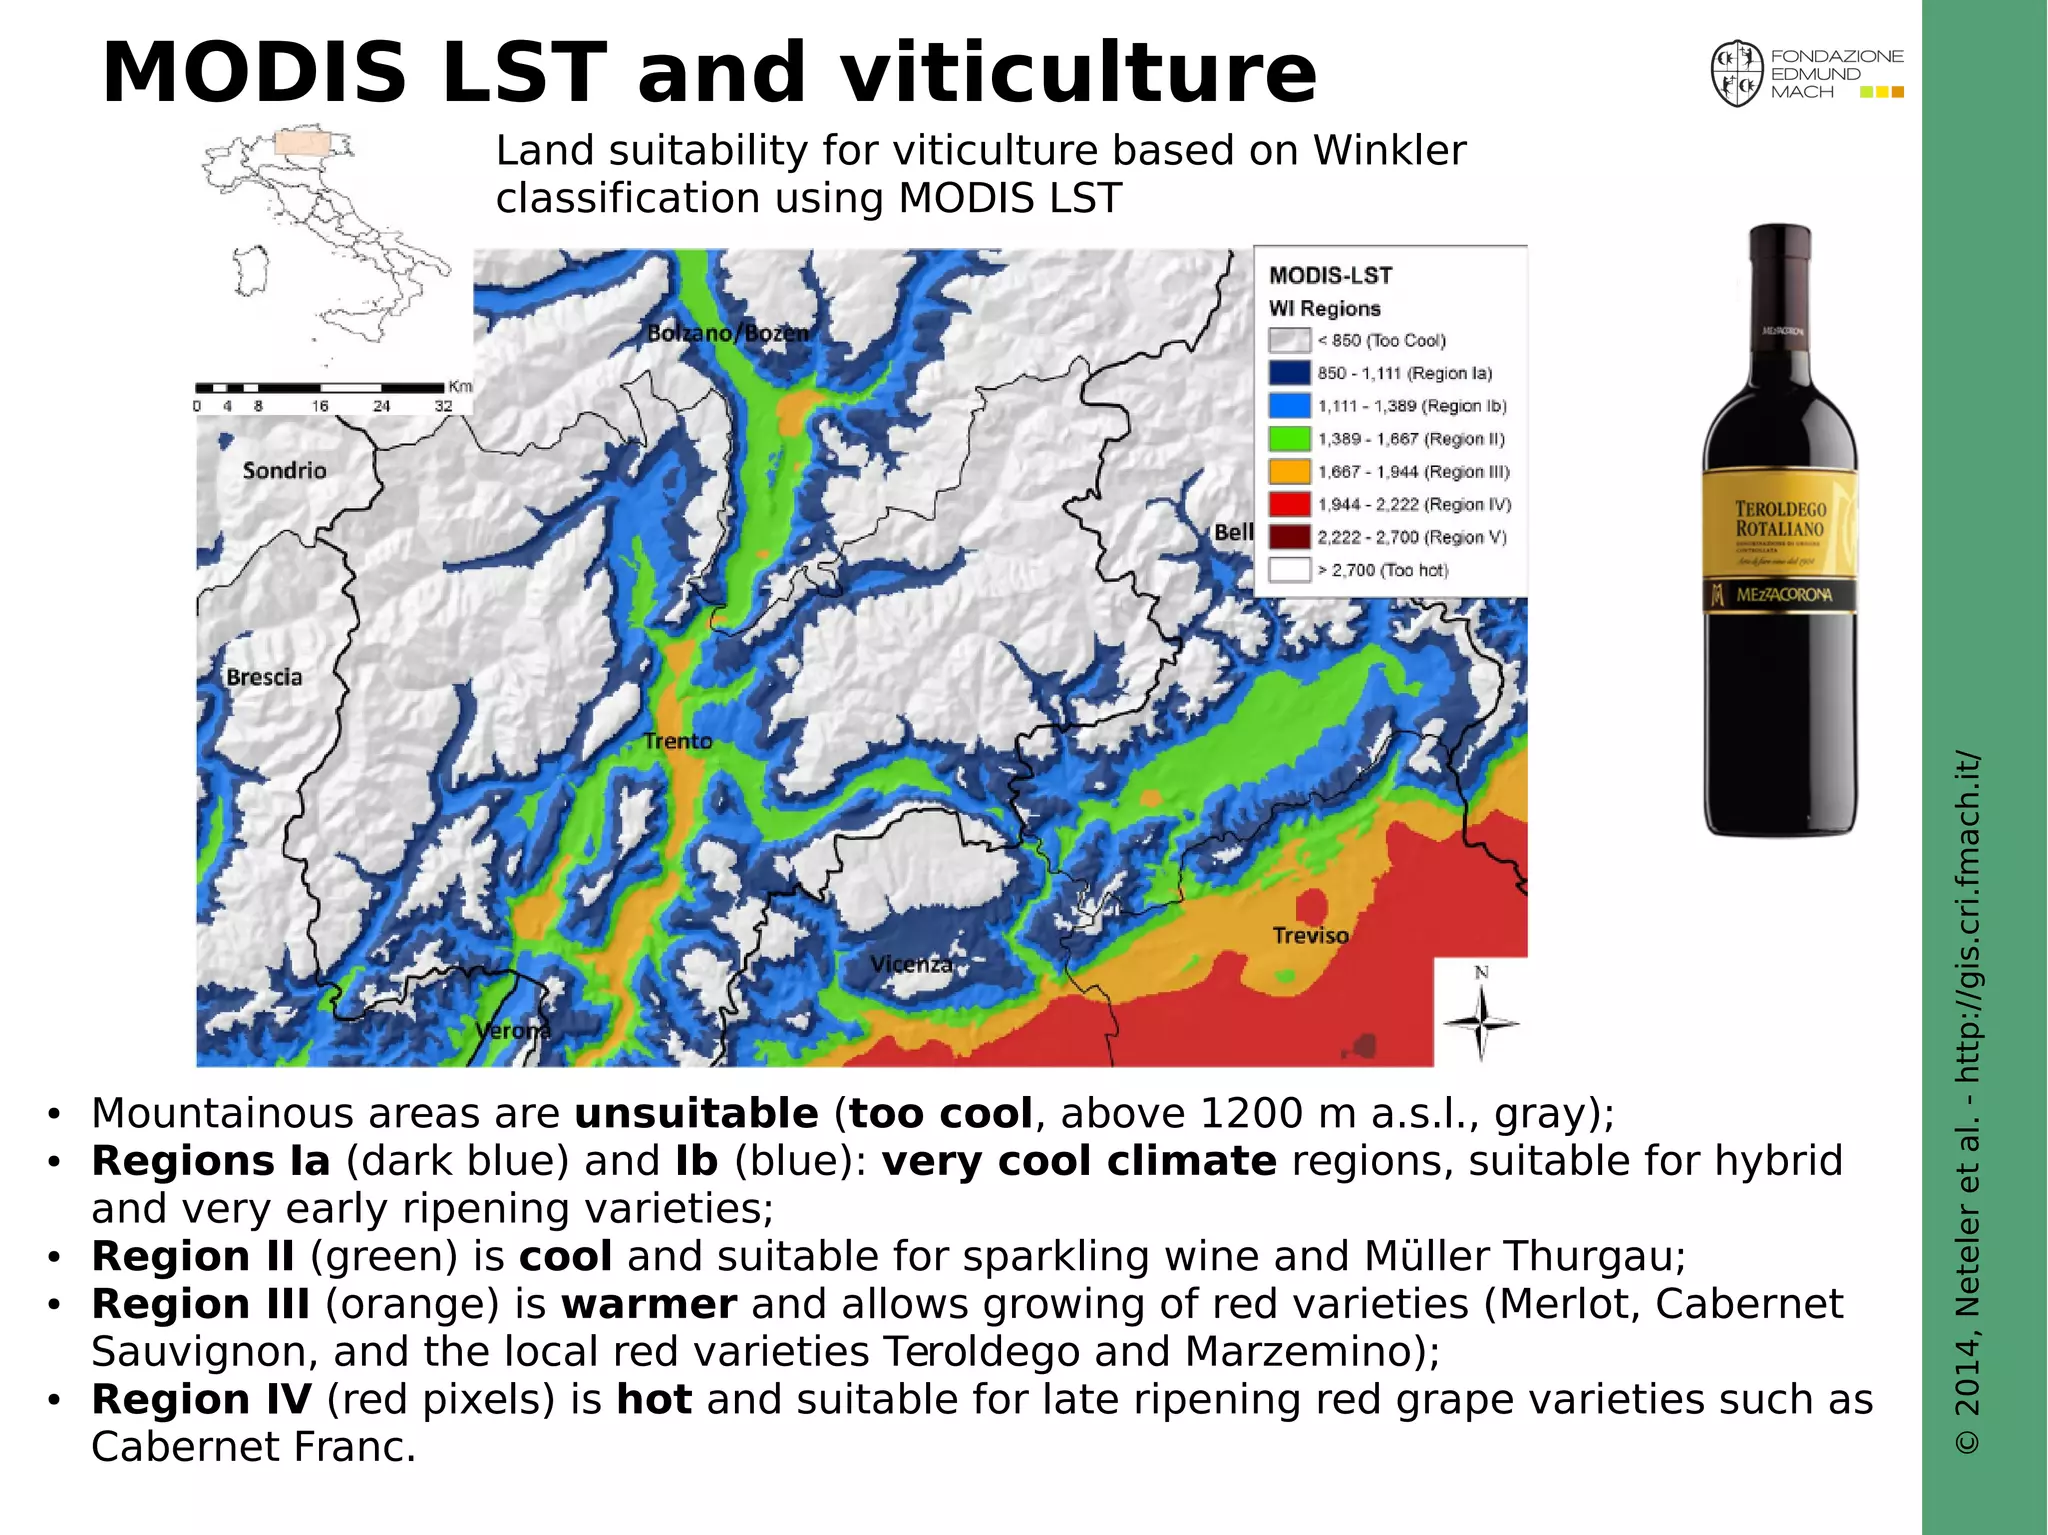
The document discusses the derivation of environmental indicators from extensive spatial time series data using open-source GIS, specifically focusing on MODIS Land Surface Temperature (LST) products and their application in environmental monitoring. It details the processing of large datasets for Europe, the methodology for gap-filling missing data, and highlights the use of regression analysis with various predictors such as elevation and climate variables. Additionally, it addresses the implications of temperature data in relation to diseases and urban heat islands, demonstrating the utility of remote sensing in tracking environmental changes.


![[DSC Europe 25] Petar Zivanov - AI meets documents From chatbots to AI-powere...](https://cdn.slidesharecdn.com/ss_thumbnails/xer2bb6nrdc8pdpev0pc-8-251204082258-7c2fa4a1-thumbnail.jpg?width=640&height=640&fit=bounds)


![[DSC Europe 25] Dragan Vucic - Building the Learning Organization - How AI Tr...](https://cdn.slidesharecdn.com/ss_thumbnails/8brigo2sbu6qur6gxrra-7-251205085715-6ae07d24-thumbnail.jpg?width=640&height=640&fit=bounds)


![[DSC Europe 25] Vid Stimac - Policy Parsimony: Between Oversimplifying and Ov...](https://cdn.slidesharecdn.com/ss_thumbnails/eqlepagzqp2rhg3gbluh-dsc-stimac-251120-251205090438-059e7f54-thumbnail.jpg?width=640&height=640&fit=bounds)
