Downloaded 319 times


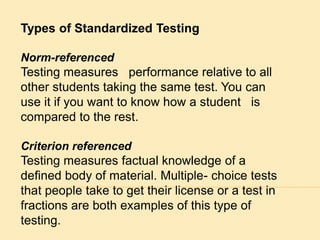
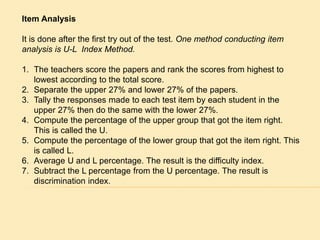


Standardized tests are designed and administered consistently to allow for comparison of student performance. Tests are given to a sample group to determine average scores and the spread of scores. This establishes norms that individual students can be compared to. There are two main types of standardized tests - norm-referenced tests which compare students to peers, and criterion-referenced tests which assess knowledge of a defined subject area. Tests go through a process of development that includes trying out drafts, analyzing results, revising weak questions, and further testing to establish reliability and validity.