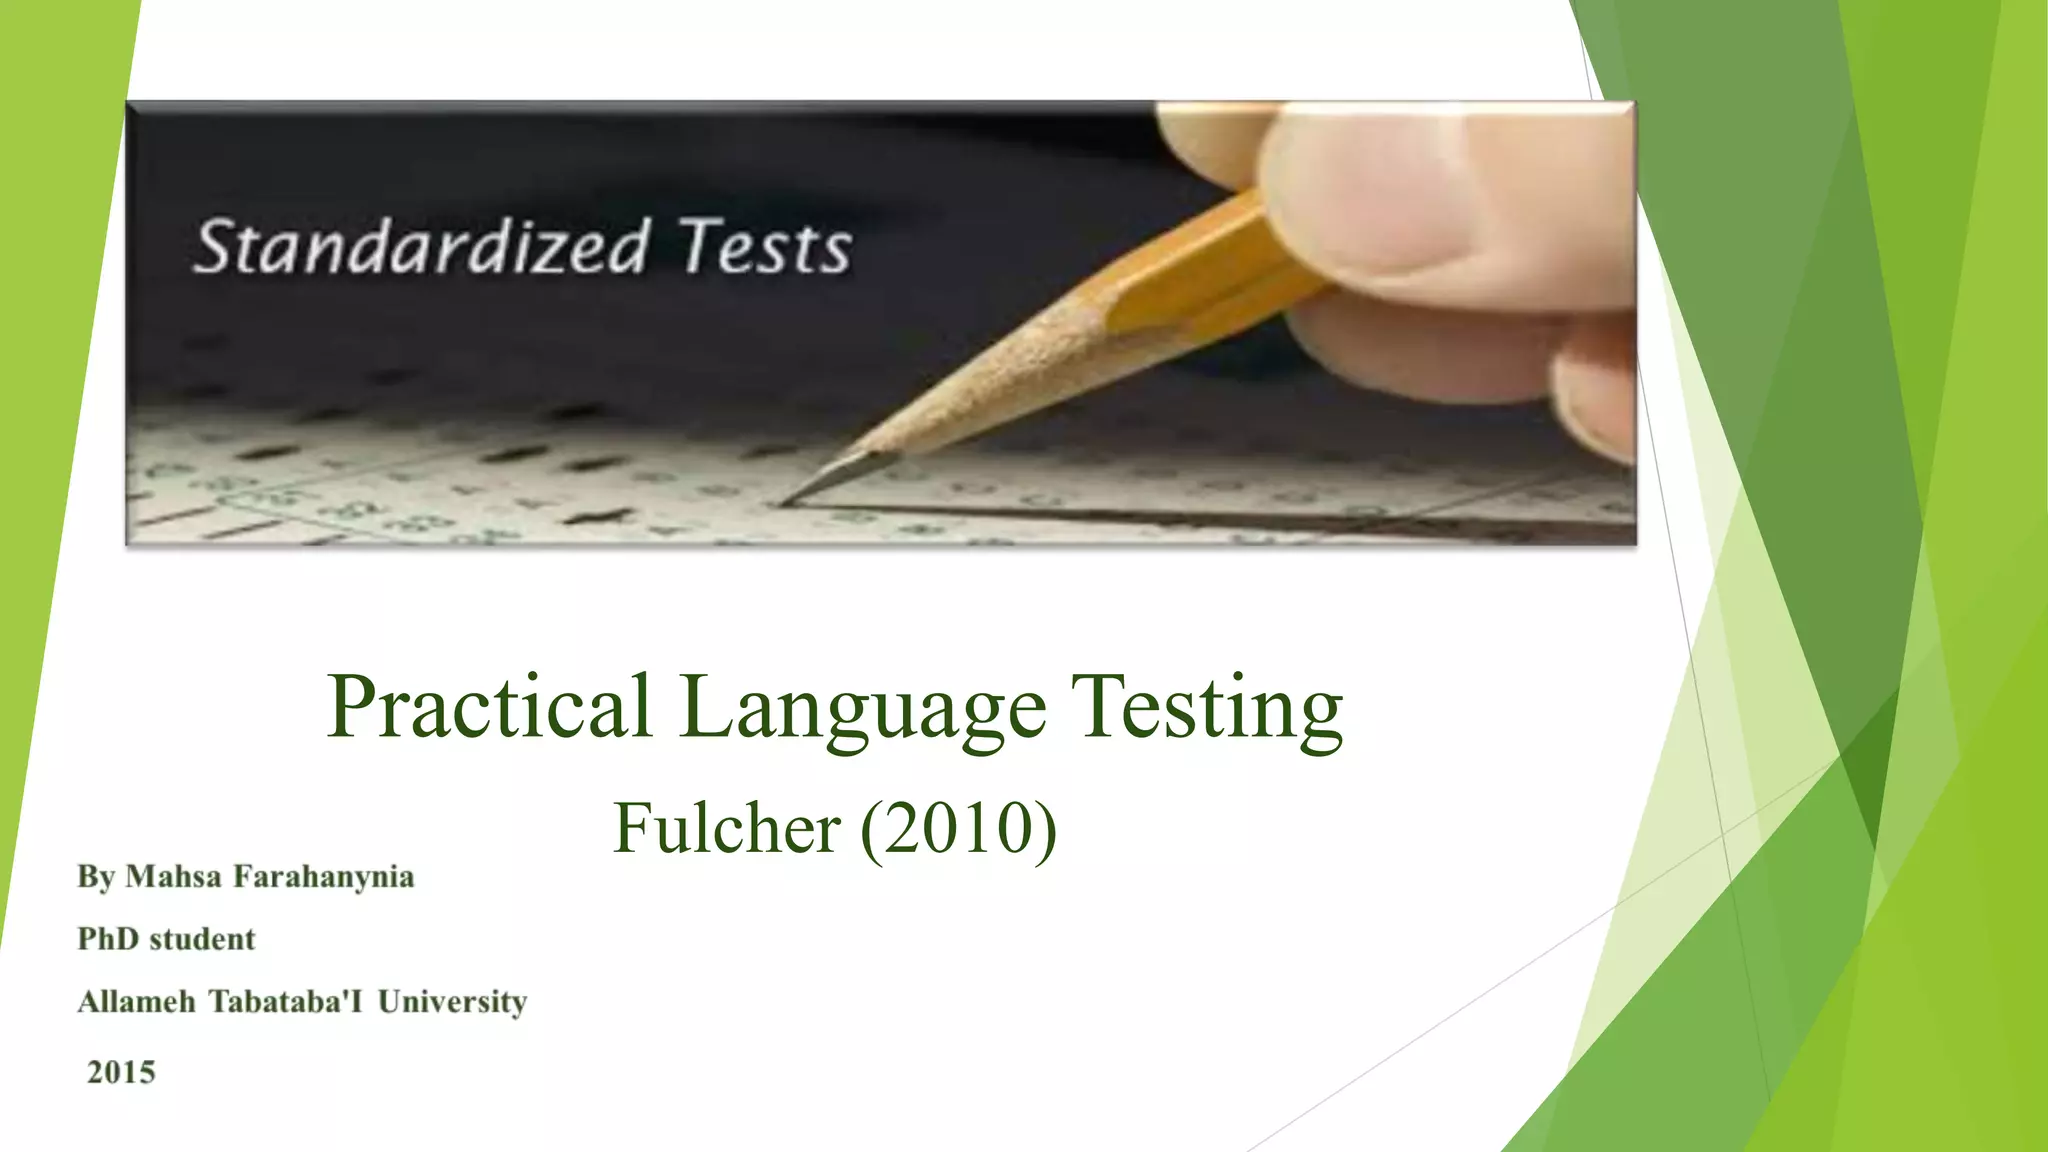
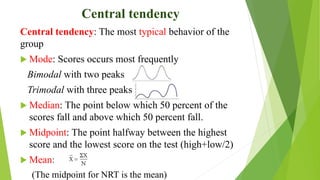
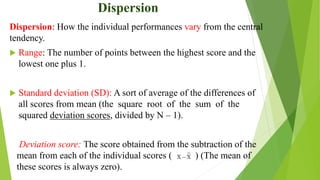
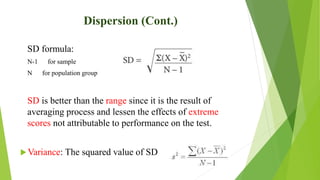
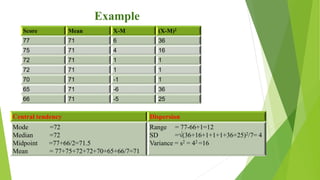
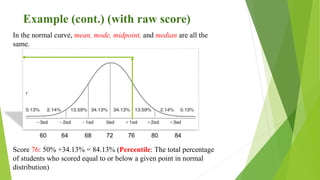
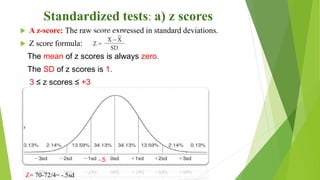
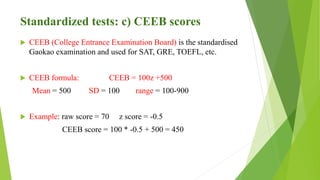
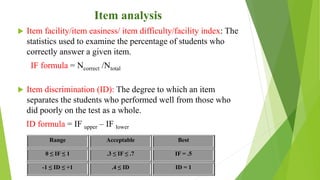
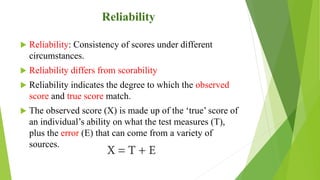
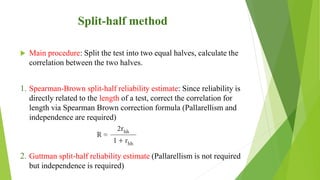
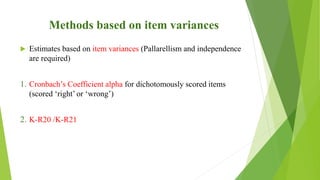
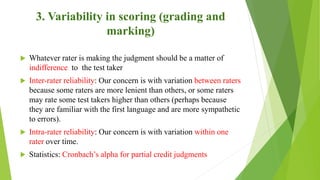
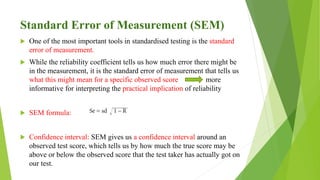
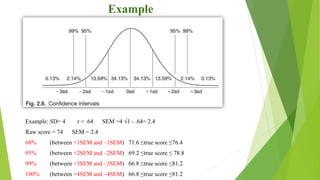
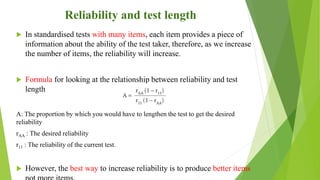
Practical Language Testing
Fulcher (2010)
Two paradigms in educational
measurement and language testing
1) Norm-referenced testing: The meaning of the score on
a test is derived from the position of an individual in
relation to the group. It discriminate between test takers
and separates them out (i.e., distribute) very effectively.
Decision making with norm-referenced tests involves
value judgments about the meaning of scores in terms
of the intended effect of the test.
Two paradigms in educational measurement
and language testing (Cont.)
 Criterion-referenced testing: The aim is to make a decision
about whether an individual test taker has achieved a pre-
specified criterion, or standard, that is required for a particular
decision context.
What is a standardized test?
 A standardized test is a form of NRT that
1) requires all test takers to answer the same questions, or a
selection of questions from common bank of questions,
in the same way;
2) is scored in a “standard” or consistent manner, which
makes it possible to compare the relative performance of
individual students or groups of students.
 The term is primarily associated with large-scale tests
administered to large populations of students
Why testing is viewed as a ‘science’
 The early scientific use of tests initiated by the
introduction of statistical analysis in testing area during
First World War
 Greenwood (1919): “When you can measure what you
are speaking about and express it in numbers, you know
something about it, but when you cannot measure it,
when you cannot express it in numbers, your knowledge
is of a meagre and unsatisfactory kind” (p. 186)
 Fulcher (2010): “tests, like scientific instruments,
provide the means by which we can observe and
measure consistencies in human ability”.
Why testing is viewed as a ‘science’ (Cont.)
Shohamy (2001): “Testing is perceived as a scientific
discipline because it is experimental, statistical and uses
numbers. It therefore enjoys the prestige granted to science
and is viewed as objective, fair, true and trustworthy” (p.
21) which are key features of the “power of testing”.
Lipman (1922): Strong trait theory is untenable. In fact,
most of the traits or constructs that we work with are
extremely difficult to define, and if we are not able to
define them, measurement is even more problematic.
The curve and score meaning
 In NRT, the meaning of a score is directly related to its place in
the curve of the distribution (or a bell curve) from which it is
drawn.
-3SD -2SD -1SD 0 1SD 2SD 3SD
Central tendency
Central tendency: The most typical behavior of the
group
 Mode: Scores occurs most frequently
Bimodal with two peaks
Trimodal with three peaks
 Median: The point below which 50 percent of the
scores fall and above which 50 percent fall.
 Midpoint: The point halfway between the highest
score and the lowest score on the test (high+low/2)
 Mean:
(The midpoint for NRT is the mean)
Dispersion
Dispersion: How the individual performances vary from the central
tendency.
 Range: The number of points between the highest score and the
lowest one plus 1.
 Standard deviation (SD): A sort of average of the differences of
all scores from mean (the square root of the sum of the
squared deviation scores, divided by N – 1).
Deviation score: The score obtained from the subtraction of the
mean from each of the individual scores ( ) (The mean of
these scores is always zero).
Dispersion (Cont.)
SD formula:
N-1 for sample
N for population group
SD is better than the range since it is the result of
averaging process and lessen the effects of extreme
scores not attributable to performance on the test.
Variance: The squared value of SD
Example
Score Mean X-M (X-M)2
77 71 6 36
75 71 4 16
72 71 1 1
72 71 1 1
70 71 -1 1
65 71 -6 36
66 71 -5 25
Central tendency Dispersion
Mode =72
Median =72
Midpoint =77+66/2=71.5
Mean = 77+75+72+72+70+65+66/7=71
Range = 77-66+1=12
SD =√(36+16+1+1+1+36+25)2/7= 4
Variance = s2 = 42 =16
Example (cont.) (with raw score)
In the normal curve, mean, mode, midpoint, and median are all the
same.
Score 76: 50% +34.13% = 84.13% (Percentile: The total percentage
of students who scored equal to or below a given point in normal
distribution)
60 64 68 72 76 80 84
Standardized tests: a) z scores
 A z-score: The raw score expressed in standard deviations.
 Z score formula:
The mean of z scores is always zero.
The SD of z scores is 1.
3 ≤ z scores ≤ +3
-.5
Z= 70-72/4= -.5sd
Standardized tests: a) z scores (Cont.)
 Three problems of z scores:
1. They are relatively small, ranging from -3 to +3.
2. They can turn out to be negative and positive.
3. They turn out to include several decimal places.
Reporting scores in form of z scores can be demotivating
for the students.
To overcome its problems, z scores should be transformed
to some standardized scales
Standardized tests: b)T scores
Main formula of standardized scales (linear transformation
of z scores):
 T score formula: T = 10z +50
Mean = 50 SD = 10 range = 10-90
 Example: raw score = 70 z score = -0.5
T score = 10 * -0.5 + 50 = 45
Standardized tests: c) CEEB scores
 CEEB (College Entrance Examination Board) is the standardised
Gaokao examination and used for SAT, GRE, TOEFL, etc.
 CEEB formula: CEEB = 100z +500
Mean = 500 SD = 100 range = 100-900
 Example: raw score = 70 z score = -0.5
CEEB score = 100 * -0.5 + 500 = 450
Item analysis
 Item facility/item easiness/ item difficulty/facility index: The
statistics used to examine the percentage of students who
correctly answer a given item.
IF formula = Ncorrect /Ntotal
 Item discrimination (ID): The degree to which an item
separates the students who performed well from those who
did poorly on the test as a whole.
ID formula = IF upper – IF lower
Range Acceptable Best
0 ≤ IF ≤ 1 .3 ≤ IF ≤ .7 IF = .5
-1 ≤ ID ≤ +1 .4 ≤ ID ID = 1
Reliability
 Reliability: Consistency of scores under different
circumstances.
 Reliability differs from scorability
 Reliability indicates the degree to which the observed
score and true score match.
 The observed score (X) is made up of the ‘true’ score of
an individual’s ability on what the test measures (T),
plus the error (E) that can come from a variety of
sources.
Threatens to reliability (Lado)
1. Variation in conditions of administration: Fluctuation of scores over time,
in different places or under slightly different conditions (such as a
different room, or with a different invigilator)
2. The quality of the test itself: Problems with sampling what language to
test – as we can’t test everything in a single test. If a test consists of items
that test very different things, reliability is also reduced. This is because
in standardised tests any group of items from which responses are added
together to create a single score are assumed to test the same ability, skill
or knowledge. The technical term for this is item homogeneity.
3. Variability in scoring: If humans are scoring multiple-choice items they
may become fatigued and make mistakes, or transfer marks inaccurately
from scripts to computer records. However, there is more room for
variation when humans are asked to make judgments.
Calculating reliability
 The method we use to calculate reliability depends upon
what kind of error we wish to focus on.
 The notion of correlation is at the very center of the
notion of reliability.
 A reliability coefficient is calculated that ranges from 0
(randomness) to 1, and no test is ‘perfectly’ reliable.
There is always error of measurement.
Calculating reliability
1. Variation in conditions of administration
 The statistical technique of correlation used is Pearson Product
Moment Correlation.
 Assumptions: 1. Interval scale, 2. Independence: each pair of scores is
independent from all other pairs, 3. Normally distributed, 4. Linearity
 -1 ≤ r ≤ +1:
1. –1 : There is an inverse relationship between the scores
2. 0 : There is no relation between the two sets of scores
3. 1 : The scores are exactly the same on both administrations of the test.
The closer the result is to 1, the more test–retest reliability we have
Coefficient of determination
 Statistical significance is a necessary precondition for a
meaningful correlation but not sufficient in itself.
 Coefficient of determination is simply correlation
coefficient squared (r2), and represents the proportion of
overlapping variance between two sets of scores (i.e., as the
score on one test increases, so it increases proportionally on
the other test)
0 ≤r2≤ 60 low (one third overlapping variance)
60 ≤r2≤ 80 moderate (one third to two third overlapping variance)
80 ≤r2≤100 high (two third to complete overlapping variance)
2. The quality of the test itself (internal
consistency)
 Reliability is addressed in terms of homogeneity of items (they
must all be highly correlated).
 Requirements:
1. Parralelism: Two tests should be parallel (with same means,
variances, same correlation with another well-established
measure of that construct)
2. Independence: The response to any specific item must be
independent of the response to any other item; put another way,
the test taker should not get one item correct because they have
got some other item correct. The technical term for this is the
stochastic independence of items.
 Statistics used: Split-half methods and methods based on item
variance
Split-half method
 Main procedure: Split the test into two equal halves, calculate the
correlation between the two halves.
1. Spearman-Brown split-half reliability estimate: Since reliability is
directly related to the length of a test, correct the correlation for
length via Spearman Brown correction formula (Pallarellism and
independence are required)
2. Guttman split-half reliability estimate (Pallarellism is not required
but independence is required)
Methods based on item variances
 Estimates based on item variances (Pallarellism and independence
are required)
1. Cronbach’s Coefficient alpha for dichotomously scored items
(scored ‘right’ or ‘wrong’)
2. K-R20 /K-R21
3. Variability in scoring (grading and
marking)
 Whatever rater is making the judgment should be a matter of
indifference to the test taker
 Inter-rater reliability: Our concern is with variation between raters
because some raters are more lenient than others, or some raters
may rate some test takers higher than others (perhaps because
they are familiar with the first language and are more sympathetic
to errors).
 Intra-rater reliability: Our concern is with variation within one
rater over time.
 Statistics: Cronbach’s alpha for partial credit judgments
Standard Error of Measurement (SEM)
 One of the most important tools in standardised testing is the standard
error of measurement.
 While the reliability coefficient tells us how much error there might be
in the measurement, it is the standard error of measurement that tells us
what this might mean for a specific observed score more
informative for interpreting the practical implication of reliability
 SEM formula:
 Confidence interval: SEM gives us a confidence interval around an
observed test score, which tells us by how much the true score may be
above or below the observed score that the test taker has actually got on
our test.
Example
Example: SD= 4 r = .64 SEM =4 √1 - .64= 2.4
Raw score = 74 SEM = 2.4
68% (between +1SEM and –1SEM) 71.6 ≤true score ≤76.4
95% (between +2SEM and –2SEM) 69.2 ≤true score ≤ 78.8
99% (between +3SEM and –3SEM) 66.8 ≤true score ≤81.2
100% (between +4SEM and –4SEM) 66.8 ≤true score ≤81.2
Reliability and test length
 In standardised tests with many items, each item provides a piece of
information about the ability of the test taker, therefore, as we increase
the number of items, the reliability will increase.
 Formula for looking at the relationship between reliability and test
length
A: The proportion by which you would have to lengthen the test to get the desired
reliability
rAA : The desired reliability
r11 : The reliability of the current test.
 However, the best way to increase reliability is to produce better items
Relationships with other measures
 One key part of standardised testing: The comparison of
two measures of the same construct.
 If two different measures were highly correlated this
provided evidence of validity. This aspect of external
validity is criterion-related evidence, or evidence that
shows one test is highly correlated with a criterion that
is already known to be a valid measure of its construct
(called evidence for convergent validity)
 Measurement as understood in Classical Test Theory
Practical Language Testing by Fulcher (2010)

Practical Language Testing by Fulcher (2010)

  • 1.
  • 2.
    Two paradigms ineducational measurement and language testing 1) Norm-referenced testing: The meaning of the score on a test is derived from the position of an individual in relation to the group. It discriminate between test takers and separates them out (i.e., distribute) very effectively. Decision making with norm-referenced tests involves value judgments about the meaning of scores in terms of the intended effect of the test.
  • 3.
    Two paradigms ineducational measurement and language testing (Cont.)  Criterion-referenced testing: The aim is to make a decision about whether an individual test taker has achieved a pre- specified criterion, or standard, that is required for a particular decision context.
  • 4.
    What is astandardized test?  A standardized test is a form of NRT that 1) requires all test takers to answer the same questions, or a selection of questions from common bank of questions, in the same way; 2) is scored in a “standard” or consistent manner, which makes it possible to compare the relative performance of individual students or groups of students.  The term is primarily associated with large-scale tests administered to large populations of students
  • 5.
    Why testing isviewed as a ‘science’  The early scientific use of tests initiated by the introduction of statistical analysis in testing area during First World War  Greenwood (1919): “When you can measure what you are speaking about and express it in numbers, you know something about it, but when you cannot measure it, when you cannot express it in numbers, your knowledge is of a meagre and unsatisfactory kind” (p. 186)  Fulcher (2010): “tests, like scientific instruments, provide the means by which we can observe and measure consistencies in human ability”.
  • 6.
    Why testing isviewed as a ‘science’ (Cont.) Shohamy (2001): “Testing is perceived as a scientific discipline because it is experimental, statistical and uses numbers. It therefore enjoys the prestige granted to science and is viewed as objective, fair, true and trustworthy” (p. 21) which are key features of the “power of testing”. Lipman (1922): Strong trait theory is untenable. In fact, most of the traits or constructs that we work with are extremely difficult to define, and if we are not able to define them, measurement is even more problematic.
  • 7.
    The curve andscore meaning  In NRT, the meaning of a score is directly related to its place in the curve of the distribution (or a bell curve) from which it is drawn. -3SD -2SD -1SD 0 1SD 2SD 3SD
  • 8.
    Central tendency Central tendency:The most typical behavior of the group  Mode: Scores occurs most frequently Bimodal with two peaks Trimodal with three peaks  Median: The point below which 50 percent of the scores fall and above which 50 percent fall.  Midpoint: The point halfway between the highest score and the lowest score on the test (high+low/2)  Mean: (The midpoint for NRT is the mean)
  • 9.
    Dispersion Dispersion: How theindividual performances vary from the central tendency.  Range: The number of points between the highest score and the lowest one plus 1.  Standard deviation (SD): A sort of average of the differences of all scores from mean (the square root of the sum of the squared deviation scores, divided by N – 1). Deviation score: The score obtained from the subtraction of the mean from each of the individual scores ( ) (The mean of these scores is always zero).
  • 10.
    Dispersion (Cont.) SD formula: N-1for sample N for population group SD is better than the range since it is the result of averaging process and lessen the effects of extreme scores not attributable to performance on the test. Variance: The squared value of SD
  • 11.
    Example Score Mean X-M(X-M)2 77 71 6 36 75 71 4 16 72 71 1 1 72 71 1 1 70 71 -1 1 65 71 -6 36 66 71 -5 25 Central tendency Dispersion Mode =72 Median =72 Midpoint =77+66/2=71.5 Mean = 77+75+72+72+70+65+66/7=71 Range = 77-66+1=12 SD =√(36+16+1+1+1+36+25)2/7= 4 Variance = s2 = 42 =16
  • 12.
    Example (cont.) (withraw score) In the normal curve, mean, mode, midpoint, and median are all the same. Score 76: 50% +34.13% = 84.13% (Percentile: The total percentage of students who scored equal to or below a given point in normal distribution) 60 64 68 72 76 80 84
  • 13.
    Standardized tests: a)z scores  A z-score: The raw score expressed in standard deviations.  Z score formula: The mean of z scores is always zero. The SD of z scores is 1. 3 ≤ z scores ≤ +3 -.5 Z= 70-72/4= -.5sd
  • 14.
    Standardized tests: a)z scores (Cont.)  Three problems of z scores: 1. They are relatively small, ranging from -3 to +3. 2. They can turn out to be negative and positive. 3. They turn out to include several decimal places. Reporting scores in form of z scores can be demotivating for the students. To overcome its problems, z scores should be transformed to some standardized scales
  • 15.
    Standardized tests: b)Tscores Main formula of standardized scales (linear transformation of z scores):  T score formula: T = 10z +50 Mean = 50 SD = 10 range = 10-90  Example: raw score = 70 z score = -0.5 T score = 10 * -0.5 + 50 = 45
  • 16.
    Standardized tests: c)CEEB scores  CEEB (College Entrance Examination Board) is the standardised Gaokao examination and used for SAT, GRE, TOEFL, etc.  CEEB formula: CEEB = 100z +500 Mean = 500 SD = 100 range = 100-900  Example: raw score = 70 z score = -0.5 CEEB score = 100 * -0.5 + 500 = 450
  • 17.
    Item analysis  Itemfacility/item easiness/ item difficulty/facility index: The statistics used to examine the percentage of students who correctly answer a given item. IF formula = Ncorrect /Ntotal  Item discrimination (ID): The degree to which an item separates the students who performed well from those who did poorly on the test as a whole. ID formula = IF upper – IF lower Range Acceptable Best 0 ≤ IF ≤ 1 .3 ≤ IF ≤ .7 IF = .5 -1 ≤ ID ≤ +1 .4 ≤ ID ID = 1
  • 18.
    Reliability  Reliability: Consistencyof scores under different circumstances.  Reliability differs from scorability  Reliability indicates the degree to which the observed score and true score match.  The observed score (X) is made up of the ‘true’ score of an individual’s ability on what the test measures (T), plus the error (E) that can come from a variety of sources.
  • 19.
    Threatens to reliability(Lado) 1. Variation in conditions of administration: Fluctuation of scores over time, in different places or under slightly different conditions (such as a different room, or with a different invigilator) 2. The quality of the test itself: Problems with sampling what language to test – as we can’t test everything in a single test. If a test consists of items that test very different things, reliability is also reduced. This is because in standardised tests any group of items from which responses are added together to create a single score are assumed to test the same ability, skill or knowledge. The technical term for this is item homogeneity. 3. Variability in scoring: If humans are scoring multiple-choice items they may become fatigued and make mistakes, or transfer marks inaccurately from scripts to computer records. However, there is more room for variation when humans are asked to make judgments.
  • 20.
    Calculating reliability  Themethod we use to calculate reliability depends upon what kind of error we wish to focus on.  The notion of correlation is at the very center of the notion of reliability.  A reliability coefficient is calculated that ranges from 0 (randomness) to 1, and no test is ‘perfectly’ reliable. There is always error of measurement.
  • 21.
    Calculating reliability 1. Variationin conditions of administration  The statistical technique of correlation used is Pearson Product Moment Correlation.  Assumptions: 1. Interval scale, 2. Independence: each pair of scores is independent from all other pairs, 3. Normally distributed, 4. Linearity  -1 ≤ r ≤ +1: 1. –1 : There is an inverse relationship between the scores 2. 0 : There is no relation between the two sets of scores 3. 1 : The scores are exactly the same on both administrations of the test. The closer the result is to 1, the more test–retest reliability we have
  • 22.
    Coefficient of determination Statistical significance is a necessary precondition for a meaningful correlation but not sufficient in itself.  Coefficient of determination is simply correlation coefficient squared (r2), and represents the proportion of overlapping variance between two sets of scores (i.e., as the score on one test increases, so it increases proportionally on the other test) 0 ≤r2≤ 60 low (one third overlapping variance) 60 ≤r2≤ 80 moderate (one third to two third overlapping variance) 80 ≤r2≤100 high (two third to complete overlapping variance)
  • 23.
    2. The qualityof the test itself (internal consistency)  Reliability is addressed in terms of homogeneity of items (they must all be highly correlated).  Requirements: 1. Parralelism: Two tests should be parallel (with same means, variances, same correlation with another well-established measure of that construct) 2. Independence: The response to any specific item must be independent of the response to any other item; put another way, the test taker should not get one item correct because they have got some other item correct. The technical term for this is the stochastic independence of items.  Statistics used: Split-half methods and methods based on item variance
  • 24.
    Split-half method  Mainprocedure: Split the test into two equal halves, calculate the correlation between the two halves. 1. Spearman-Brown split-half reliability estimate: Since reliability is directly related to the length of a test, correct the correlation for length via Spearman Brown correction formula (Pallarellism and independence are required) 2. Guttman split-half reliability estimate (Pallarellism is not required but independence is required)
  • 25.
    Methods based onitem variances  Estimates based on item variances (Pallarellism and independence are required) 1. Cronbach’s Coefficient alpha for dichotomously scored items (scored ‘right’ or ‘wrong’) 2. K-R20 /K-R21
  • 26.
    3. Variability inscoring (grading and marking)  Whatever rater is making the judgment should be a matter of indifference to the test taker  Inter-rater reliability: Our concern is with variation between raters because some raters are more lenient than others, or some raters may rate some test takers higher than others (perhaps because they are familiar with the first language and are more sympathetic to errors).  Intra-rater reliability: Our concern is with variation within one rater over time.  Statistics: Cronbach’s alpha for partial credit judgments
  • 27.
    Standard Error ofMeasurement (SEM)  One of the most important tools in standardised testing is the standard error of measurement.  While the reliability coefficient tells us how much error there might be in the measurement, it is the standard error of measurement that tells us what this might mean for a specific observed score more informative for interpreting the practical implication of reliability  SEM formula:  Confidence interval: SEM gives us a confidence interval around an observed test score, which tells us by how much the true score may be above or below the observed score that the test taker has actually got on our test.
  • 28.
    Example Example: SD= 4r = .64 SEM =4 √1 - .64= 2.4 Raw score = 74 SEM = 2.4 68% (between +1SEM and –1SEM) 71.6 ≤true score ≤76.4 95% (between +2SEM and –2SEM) 69.2 ≤true score ≤ 78.8 99% (between +3SEM and –3SEM) 66.8 ≤true score ≤81.2 100% (between +4SEM and –4SEM) 66.8 ≤true score ≤81.2
  • 29.
    Reliability and testlength  In standardised tests with many items, each item provides a piece of information about the ability of the test taker, therefore, as we increase the number of items, the reliability will increase.  Formula for looking at the relationship between reliability and test length A: The proportion by which you would have to lengthen the test to get the desired reliability rAA : The desired reliability r11 : The reliability of the current test.  However, the best way to increase reliability is to produce better items
  • 30.
    Relationships with othermeasures  One key part of standardised testing: The comparison of two measures of the same construct.  If two different measures were highly correlated this provided evidence of validity. This aspect of external validity is criterion-related evidence, or evidence that shows one test is highly correlated with a criterion that is already known to be a valid measure of its construct (called evidence for convergent validity)  Measurement as understood in Classical Test Theory