
Recommended
More Related Content
What's hot
What's hot (20)
Similar to Establishing Validity-and-Reliability-Test ppt.pptx
Similar to Establishing Validity-and-Reliability-Test ppt.pptx (20)
More from RayLorenzOrtega
More from RayLorenzOrtega (14)
Recently uploaded
Recently uploaded (20)
Establishing Validity-and-Reliability-Test ppt.pptx
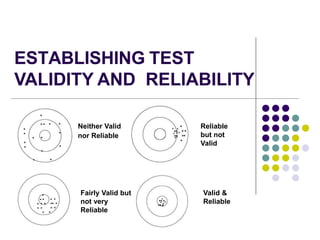
- 1. ESTABLISHING TEST VALIDITY AND RELIABILITY Neither Valid nor Reliable Reliable but not Valid Valid & Reliable Fairly Valid but not very Reliable
- 2. Question… In the context of what you understand about VALIDITY and RELIABILITY, how do you go about establishing/ensuring them in your own test papers?
- 4. ESTABLISHING TEST VALIDITY AND RELIABILITY OBJECTIVES 1.Use procedures and statistical analysis to establish test validity and reliability 2.Decide whether the test is valid or reliable 3.Decide which test items are easy and difficult
- 5. Reliability Consistency of the responses to measure under three(3) conditions; 1. When retested on the same person. 2. When retested on the same measure 3. Similarity of responses across item that measure the same characteristic.
- 6. Reliability Measure of consistency of test results from one administration of the test to the next Generalizability – consistency (interwoven concepts) – if a test item is reliable, it can be correlated with other items to collectively measure a construct or content mastery A component of validity Length of assessment
- 7. Different Factors Affecting Reliability Factors that affect the reliability of the measure; The number of items in the test Individual differences of the participants (fatigue, concentration, innate ability, perseverance, and motivation) External environment (room temperature, noise level, exposure to materials, and utility of instruction.
- 8. Methods in Testing Reliability 1. Stability of measures Test-Retest Method Equivalent – Parallel Forms Method 2. Internal-Consistency Method Split-half Procedure Kuder-Richardson Approaches and Alpha Coefficient Inter-rater Reliability
- 9. Reliability Measures stable variables ( aptitude and psychomotor measures ( typing test, physical education task) Pearson’s r TEST-RETEST RELIABILITY
- 10. Equivalent/Parallel forms Applicable if there are two (2) versions of the test Best for tests repeatedly used for different groups (entrance examinations, licensure examinations)
- 11. SPLIT-HALF Applicable when the test has a large number of items Administer a test to a group of examines The test has two equivalent halves. Give test once, score two equivalent halves (odd items vs. even items)
- 12. Kuder Richardson and Cronbach’s Alpha Method Inter-item consistency – one test – one administration Determining if the scores for each item are consistently answered by examines Best for large tools, scales, and inventories (Likert Scale)
- 13. Inter-Rater Reliability Determine the consistency of multiple raters when using rating scales and rubrics Kendall’s Tau Coefficient- used to determine if the ratings provided by multiple raters agree with each other
- 15. Reliability Where: n = sample size N = population size statistical analysis used to determine the correlation coefficient Person r Correlation
- 16. Reliability Person r Correlation Monday Test Tuesday Test Wednesday Test Thursday Test Friday Test X Y X2 Y2 XY 10 20 100 400 200 9 15 81 225 135 6 12 36 144 72 10 18 100 324 180 12 19 144 361 228 4 8 16 64 32 5 7 25 49 35 7 10 49 100 70 16 17 256 289 272 8 13 64 169 104 ΣX = 87 ΣY = 139 ΣX2 = 871 ΣY2 = 2125 ΣXY = 1328
- 17. Reliability Person r Correlation ΣX – Add all the X scores (Monday scores) XY – Multiply the X and Y scores ΣY – Add all the Y scores (Tuesday scores) ΣX2 – Add all the squared values of X X2 – Square the value of the X scores (Monday scores) ΣY2 – Add all the squared values of Y Y2 – Square the value of the Y scores (Tuesday scores) Substitute the values in the formula: ΣXY – Add all the product of X and Y
- 18. Reliability SPSS (Statistical Package for the Social Sciences), also known as IBM SPSS Statistics, is a software package used for the analysis of statistical data.
- 19. Reliability Value of correlation ranges from -1.0 to 1.0 In test reliability, we aim for high positive correlation to mean that there is consistency in the way the student answered the test taken
- 20. Reliability Strength of Correlation 0.00 – 0.19 Negligible Relationship 0.20 – 0.39 Weak Relationship 0.40 – 0.59 Substantial/ Marked Relationship 0.60 – 0.79 Strong Relationship 0. 80 – 1.00 Very Strong Relationship
- 21. Reliability The closer the value to 1.00 or -1.00, the stronger the correlation
- 22. Reliability Determining the Significance of the Correlation In order to determine if the correlation is free of the certain errors, it is tested for significance When a correlation is significant, it means that the probability of two variables being related is free of certain errors. Critical Value > Compute Value (Significant
- 23. Determining the Significance of the Correlation Above is a performance task demonstrated by five students rated by three raters. The rubric used a scale of 1 to 4, where 4 is the highest and 1 is the lowest.
- 24. Reliability The scores given by the three raters are first computed by summing up the total ratings for each demonstration.
- 25. Reliability A Kendall’s 𝜔 coefficient value of 0.37 indicates the agreement of the three raters in the five demonstrations. There is moderate concordance among the three raters because the value is far from 1.00.
- 26. How to improve Reliability? Quality of items; concise statements, homogenous words (some sort of uniformity) Adequate sampling of content domain; comprehensiveness of items Longer assessment – less distorted by chance factors Developing a scoring plan (esp. for subjective items – rubrics) Ensure VALIDITY
- 27. Validity Test Depends on the PURPOSE E.g. a ruler may be a valid measuring device for length, but isn’t very valid for measuring volume Measuring what ‘it’ is supposed to Matter of degree (how valid?) Specific to a particular purpose! Must be inferred from evidence; cannot be directly measured Learning outcomes 1. Content coverage (relevance?) 2. Level & type of student engagement (cognitive, affective, psychomotor) – appropriate?
- 28. Types of Validity Test 1. Content validity 2. Face validity 3. Predictive validity 4. Construct validity 5. Concurrent validity 6. Convergent validity 7. Divergent validity
- 29. Content Validity When the items represent the domain being measured Example: A coordinator in science is checking the science test paper for grade 4. She asked the grade 4 science teacher to submit the specifications table containing the lesson objectives and the corresponding items. The coordinator checked whether each item was aligned with the objectives. How are the objectives used when creating test items? Who checks the content validity of items?
- 30. How to establish Content Validity? Instructional objectives (looking at your list) Table of Specification At the end of the chapter, the student will be able to do the following: 1. Explain what ‘stars’ are 2. Discuss the type of stars and galaxies in our universe 3. Categorize different constellations by looking at the stars 4. Differentiate between our stars, the sun, and all other stars
- 31. Categories of Performance (Mental Skills) Content areas Knowledge Comprehension Analysis Total 1. What are ‘stars’? 2. Our star, the Sun 3. Constellations 4. Galaxies Total Grand Total Table of Specification (An Example)
- 32. Predictive Validity A measure should predict a future criterion Example: The school admission’s office developed an entrance examination. The officials wanted to determine if the results of the entrance examination are accurate in identifying good students. They took the grades of the students accepted for the first quarter. They correlated the entrance exam results and the first quarter grades. Why are two measures needed in predictive validity? How are the test results of predictive validity interpreted?
- 33. Concurrent Validity When two or more measures are present for each examinee that measure the same characteristic Example: A school guidance counselor administered a math achievement test to grade 6 students. She also has a copy of the students’ grades in math. She wanted to verify if the math grades of the students are measuring the same competencies as the math achievement test. The school counselor correlated the math achievement scores and math grades to determine if they are measuring the same competencies.
- 34. Construct Validity The components or factors of the test should contain items that are strongly correlated. Example: A science test was made by a grade 10 teacher composed of four domains: matter, living things, force and motion, and earth and space. There are 10 items under each domain. The teacher wanted to determine if the 10 items made under each domain really belonged to that domain. The teacher consulted an expert in test measurement. They conducted a procedure called factor analysis. Factor analysis is a statistical procedure done to determine if the items written will load under the domain they belong.
- 35. Construct Validity Does the test measure the ‘human’ CHARACTERISTIC(s) it is supposed to? Examples of constructs or ‘human’ characteristics: Mathematical reasoning Verbal reasoning Musical ability Spatial ability Mechanical aptitude Motivation Interest Attention span Hours spent Assignments undertaken and submitted, etc. All of these sub-constructs put together – measure ‘motivation’
- 36. Convergent Validity When the components or factors of a test are hypothesized to have a positive correlation Example: A math teacher developed a test to be administered at the end of the school year, which measures number sense, patterns and algebra, measurement, geometry, and statistics. It is assumed by the math teacher that students’ competencies in number sense improves their capacity to learn patterns and algebra and other concepts.
- 37. Divergent Validity When the components or factors of a test are hypothesized to have a negative correlation Example: An English teacher taught a metacognitive awareness strategy to comprehend a paragraph for grade 11 students. She wanted to determine if the performance of her students in reading comprehension would reflect well in the reading comprehension test.
- 38. Difficulty Index To determine the difficulty level of test items, a measure This measure asks teachers to calculate the proportion of students who answered the test item accurately. By looking at each alternative (for multiple choice), we can also find out if there are answer choices that should be replaced. Difficulty Index Remark 0.76 or higher Easy Item 0.25 to 0.75 Average Item 0.24 or lower Difficult Item
- 39. Discrimination Index differentiates between high and low scorers. In other words, you should be able to expect that the high- performing students would select the correct answer for each question more often than the low-performing students. positive discrimination index (between 0 and 1) negative discrimination index (between -1 and 0). Discrimination Index Remark 0.40 and above Very good item 0.30 – 0.39 Good item 0.20 – 0.29 Reasonably good item 0.10 – 0.19 Marginal item Below 0.10 Poor item
- 40. Factors that can lower Validity Unclear directions Difficult reading vocabulary and sentence structure Ambiguity in statements Inadequate time limits Inappropriate level of difficulty Poorly constructed test items Test items inappropriate for the outcomes being measured Tests that are too short Improper arrangement of items (complex to easy?) Identifiable patterns of answers Teaching Administration and scoring Students Nature of criterion
- 41. THANK YOU! Am I valid or reliable ?