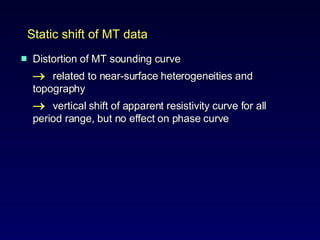
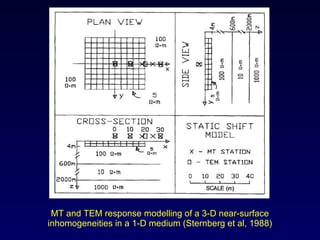
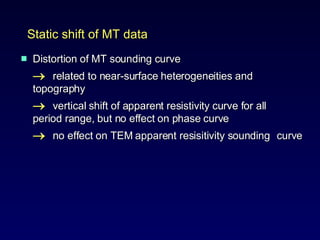
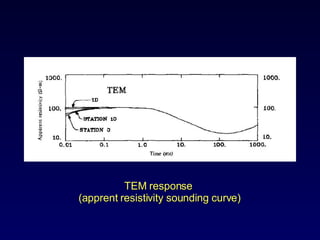
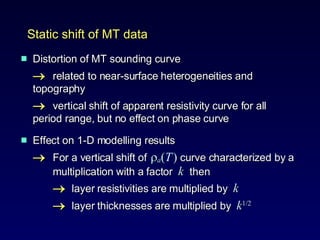
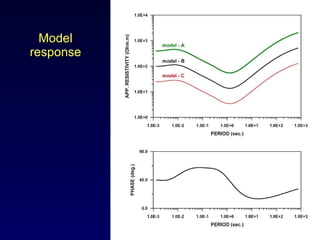
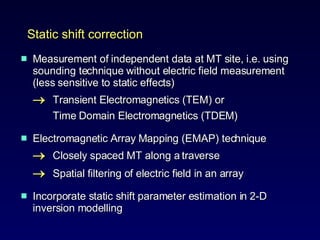
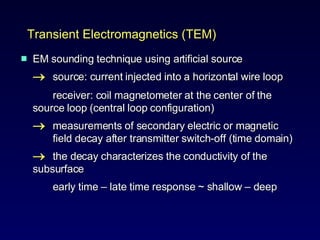
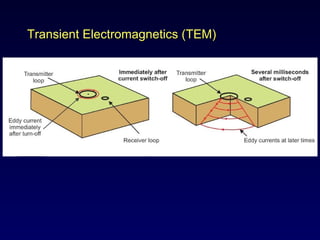
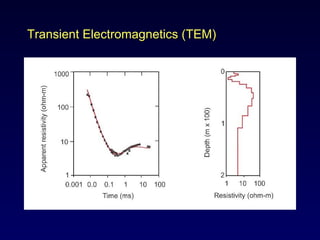
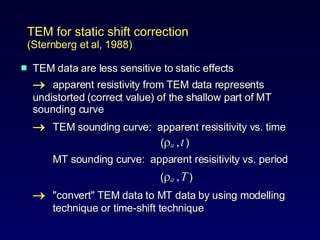
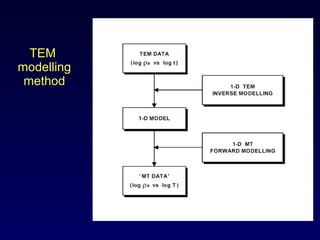
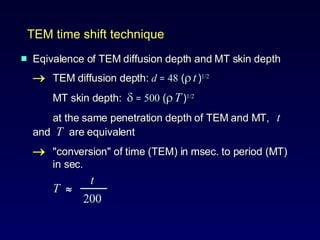
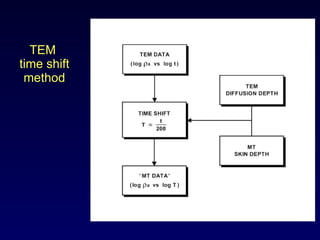
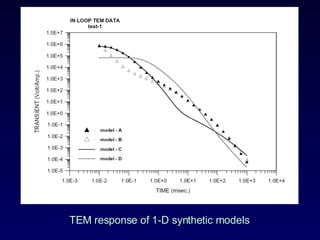
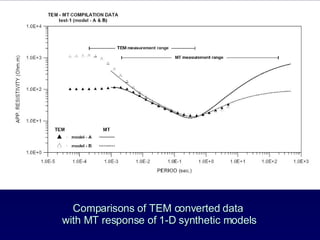
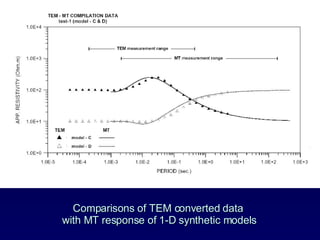
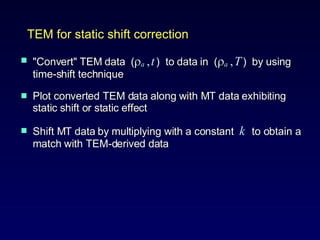
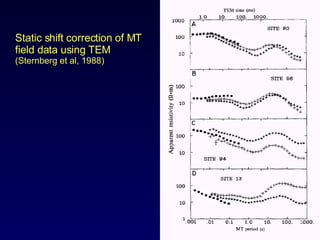
Static shift correction of MT data using TEM data
Distortion of MT sounding curve  related to near-surface heterogeneities and  topography  vertical shift of apparent resistivity curve for all  period range, but no effect on phase curve Static shift of MT data
MT and TEM response modelling of a 3-D near-surface inhomogeneities in a 1-D medium (Sternberg et al, 1988)
MT response   (apprent resistivity sounding curve)
2-D MT modelling of a topographic effect  (Chouteau & Bouchard, 1988)
Comparison of MT sounding curves with topographic effect (initial model), terrain-corrected data and flat earth model response
Distortion of MT sounding curve  related to near-surface heterogeneities and  topography  vertical shift of apparent resistivity curve for all  period range, but no effect on phase curve  no effect on TEM apparent resisitivity sounding  curve Static shift of MT data
TEM response   (apprent resistivity sounding curve)
Distortion of MT sounding curve  related to near-surface heterogeneities and  topography  vertical shift of apparent resistivity curve for all  period range, but no effect on phase curve Effect on 1-D modelling results  For a vertical shift of   a ( T   )  curve characterized by a  multiplication with a factor  k   then    layer resistivities are multiplied by  k      layer thicknesses are multiplied by  k 1/2   Static shift of MT data
1-D synthetic models k   =  4,  k 1/2  =  2    k   – 1    k
1-D synthetic models k   =  4,  k 1/2  =  2    k   – 1/2    k 1/2
Model response
Measurement of independent data at MT site, i.e. using sounding technique without electric field measurement (less sensitive to static effects)  Transient Electromagnetics (TEM) or  Time Domain Electromagnetics (TDEM)  Electromagnetic Array Mapping (EMAP) technique   Closely spaced MT along a traverse   Spatial filtering of electric field in an array  Incorporate static shift parameter estimation in 2-D inversion modelling  Static shift correction
EM sounding technique using artificial source  source: current injected into a horizontal wire loop  receiver: coil magnetometer at the center of the  source loop (central loop configuration)  measurements of secondary electric or magnetic  field decay after transmitter switch-off (time domain)  the decay characterizes the conductivity of the  subsurface  early time  –  late time response ~ shallow  –  deep  Transient Electromagnetics (TEM)
Transient Electromagnetics (TEM)
TEM signal
TEM data presentation
Zonge  TEM system
Transient Electromagnetics (TEM)
TEM data are less sensitive to static effects  apparent resistivity from TEM data represents  undistorted (correct value) of the shallow part of MT  sounding curve   TEM sounding curve:  apparent resisitivity vs. time   (  a   ,   t   ) MT sounding curve:  apparent resisitivity vs. period     (  a   ,   T   )  "convert" TEM data to MT data by using modelling  technique or time-shift technique TEM for static shift correction  (Sternberg et al, 1988)
TEM  modelling method
Eqivalence of TEM diffusion depth and MT skin depth  TEM diffusion depth:  d   =   48  (    t   ) 1/2 MT skin depth:     =   500  (    T   ) 1/2   at the same penetration depth of TEM and MT,  t  and  T  are equivalent  "conversion" of time (TEM) in msec. to period (MT)  in sec.   t T     ───     200 TEM time shift technique
TEM  time shift method
TEM response of 1-D synthetic models
Comparisons of TEM converted data  with MT response of 1-D synthetic models
"Convert" TEM data  (  a   ,   t   )  to data in  (  a   ,   T   )  by using time-shift technique Plot converted TEM data along with MT data exhibiting static shift or static effect Shift MT data by multiplying with a constant  k   to obtain a match with TEM-derived data  TEM for static shift correction
Static shift correction of MT field data using TEM  (Sternberg et al, 1988)
Summary MT static shift correction using TEM   TEM measurement   at MT sounding sites  "Conversion" of TEM sounding data to MT data using  time shift technique   Shift MT data to match to TEM-derived data  A by product of "conversion" of TEM sounding data to MT data using time shift technique       to apply 1-D MT modelling technique to TEM data

Tem

  • 1.
    Static shift correctionof MT data using TEM data
  • 2.
    Distortion of MTsounding curve  related to near-surface heterogeneities and topography  vertical shift of apparent resistivity curve for all period range, but no effect on phase curve Static shift of MT data
  • 3.
    MT and TEMresponse modelling of a 3-D near-surface inhomogeneities in a 1-D medium (Sternberg et al, 1988)
  • 4.
    MT response (apprent resistivity sounding curve)
  • 5.
    2-D MT modellingof a topographic effect (Chouteau & Bouchard, 1988)
  • 6.
    Comparison of MTsounding curves with topographic effect (initial model), terrain-corrected data and flat earth model response
  • 7.
    Distortion of MTsounding curve  related to near-surface heterogeneities and topography  vertical shift of apparent resistivity curve for all period range, but no effect on phase curve  no effect on TEM apparent resisitivity sounding curve Static shift of MT data
  • 8.
    TEM response (apprent resistivity sounding curve)
  • 9.
    Distortion of MTsounding curve  related to near-surface heterogeneities and topography  vertical shift of apparent resistivity curve for all period range, but no effect on phase curve Effect on 1-D modelling results  For a vertical shift of  a ( T ) curve characterized by a multiplication with a factor k then  layer resistivities are multiplied by k  layer thicknesses are multiplied by k 1/2 Static shift of MT data
  • 10.
    1-D synthetic modelsk = 4, k 1/2 = 2  k – 1  k
  • 11.
    1-D synthetic modelsk = 4, k 1/2 = 2  k – 1/2  k 1/2
  • 12.
  • 13.
    Measurement of independentdata at MT site, i.e. using sounding technique without electric field measurement (less sensitive to static effects)  Transient Electromagnetics (TEM) or Time Domain Electromagnetics (TDEM) Electromagnetic Array Mapping (EMAP) technique  Closely spaced MT along a traverse  Spatial filtering of electric field in an array Incorporate static shift parameter estimation in 2-D inversion modelling Static shift correction
  • 14.
    EM sounding techniqueusing artificial source  source: current injected into a horizontal wire loop receiver: coil magnetometer at the center of the source loop (central loop configuration)  measurements of secondary electric or magnetic field decay after transmitter switch-off (time domain)  the decay characterizes the conductivity of the subsurface early time – late time response ~ shallow – deep Transient Electromagnetics (TEM)
  • 15.
  • 16.
  • 17.
  • 18.
    Zonge TEMsystem
  • 19.
  • 20.
    TEM data areless sensitive to static effects  apparent resistivity from TEM data represents undistorted (correct value) of the shallow part of MT sounding curve  TEM sounding curve: apparent resisitivity vs. time (  a , t ) MT sounding curve: apparent resisitivity vs. period (  a , T )  "convert" TEM data to MT data by using modelling technique or time-shift technique TEM for static shift correction (Sternberg et al, 1988)
  • 21.
  • 22.
    Eqivalence of TEMdiffusion depth and MT skin depth  TEM diffusion depth: d = 48 (  t ) 1/2 MT skin depth:  = 500 (  T ) 1/2 at the same penetration depth of TEM and MT, t and T are equivalent  "conversion" of time (TEM) in msec. to period (MT) in sec. t T  ─── 200 TEM time shift technique
  • 23.
    TEM timeshift method
  • 24.
    TEM response of1-D synthetic models
  • 25.
    Comparisons of TEMconverted data with MT response of 1-D synthetic models
  • 26.
    Comparisons of TEMconverted data with MT response of 1-D synthetic models
  • 27.
    "Convert" TEM data (  a , t ) to data in (  a , T ) by using time-shift technique Plot converted TEM data along with MT data exhibiting static shift or static effect Shift MT data by multiplying with a constant k to obtain a match with TEM-derived data TEM for static shift correction
  • 28.
    Static shift correctionof MT field data using TEM (Sternberg et al, 1988)
  • 29.
    Summary MT staticshift correction using TEM  TEM measurement at MT sounding sites  "Conversion" of TEM sounding data to MT data using time shift technique  Shift MT data to match to TEM-derived data A by product of "conversion" of TEM sounding data to MT data using time shift technique  to apply 1-D MT modelling technique to TEM data