Downloaded 35 times
![SPST
Floyd-Warshall, Bellman-Ford, Dijkstra’s
Dij = min (wij, Dik + Dkj), Di = min (Di, wik + Dk)
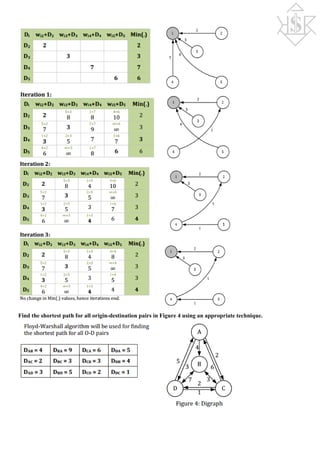
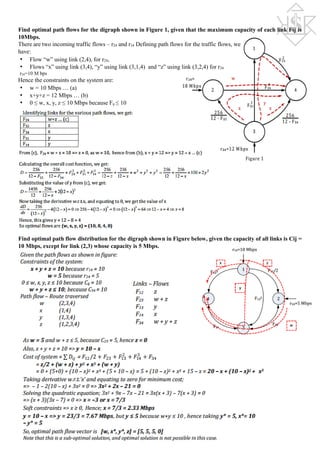
Find and draw the shortest path spanning tree (SPST) for the digraph shown in the figure using the Bellman-
Ford algorithm, from all nodes to node C. Then apply the MaxMin Fair flow control algorithm to find the max-
min fair flow vector for all sessions (shown in red). Assume the capacity of all links to be 10 Gbps. (Hint: All flows
take the minimum cost path)
As the shortest path cost has not changed for any node for 2 successive iterations, so we stop here. The SPST is shown
in the Figure.
All flows cause overflow on link EC, hence all flows stopped at 2.5 Gbps Max-min fair flow distribution is: [rAC, rDC,
rBC, rEC] = [2.5, 2.5, 2.5, 2.5]
Find the shortest path from all nodes to node 1 for the digraph shown in Figure 2, using the BellmanFord
algorithm. b.) Draw the SPST for node 1 as found in part (a).](https://image.slidesharecdn.com/tsenotes2-170115101733/85/Telecommunication-System-Engineering-Notes-1-320.jpg)
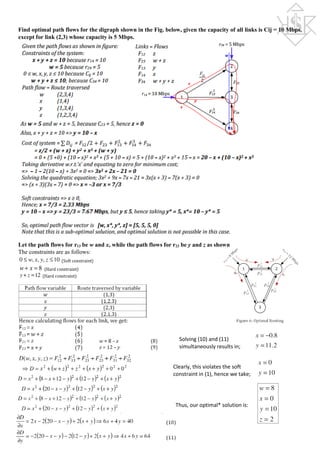
![SPST
Floyd-Warshall, Bellman-Ford, Dijkstra’s
Dij = min (wij, Dik + Dkj), Di = min (Di, wik + Dk)
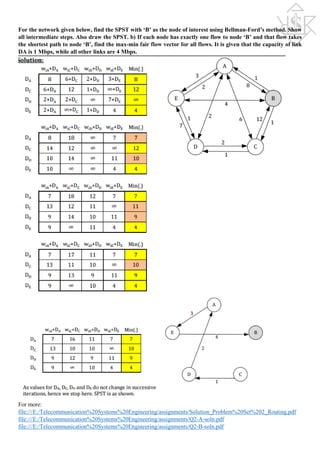
Find and draw the shortest path spanning tree (SPST) for the digraph shown in the figure using the Bellman-
Ford algorithm, from all nodes to node C. Then apply the MaxMin Fair flow control algorithm to find the max-
min fair flow vector for all sessions (shown in red). Assume the capacity of all links to be 10 Gbps. (Hint: All flows
take the minimum cost path)
As the shortest path cost has not changed for any node for 2 successive iterations, so we stop here. The SPST is shown
in the Figure.
All flows cause overflow on link EC, hence all flows stopped at 2.5 Gbps Max-min fair flow distribution is: [rAC, rDC,
rBC, rEC] = [2.5, 2.5, 2.5, 2.5]
Find the shortest path from all nodes to node 1 for the digraph shown in Figure 2, using the BellmanFord
algorithm. b.) Draw the SPST for node 1 as found in part (a).](https://image.slidesharecdn.com/tsenotes2-170115101733/75/Telecommunication-System-Engineering-Notes-1-2048.jpg)
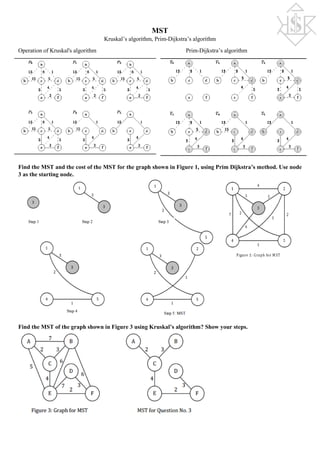
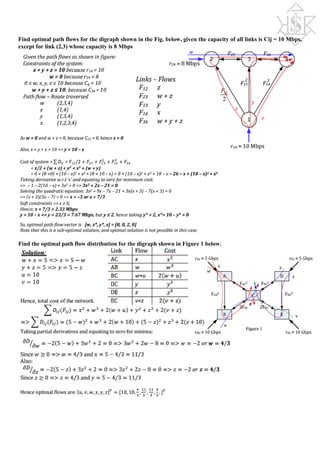
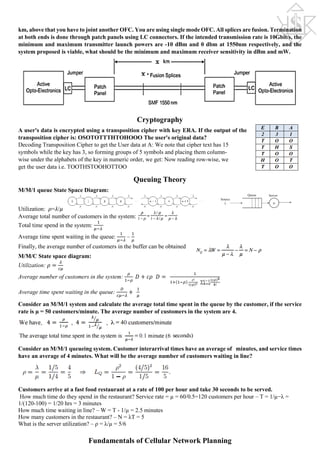
![Link Flow Control
If the cost function is given as 𝐷𝐷𝐷𝐷𝐷𝐷 𝐹𝐹𝐹𝐹𝐹𝐹 = − 𝐹𝐹𝐹𝐹𝐹𝐹 −𝐶𝐶𝐶𝐶𝐶𝐶 𝐶𝐶𝐶𝐶𝐶𝐶 where Cij= Capacity of the link and Fi j = Link flow, sketch
the cost function on the graph shown below and hence comment whether this is a suitable cost function to use in
optimal routing problems or not?
A cost function is suitable if its cost rises as the flow on that link
increases and vice versa. From graph, we see that the cost decreases as
the flow increases, hence this is NOT a suitable cost function to use in
optimal routing.
For the flows shown in Figure 2, find the max-min fair flow vector, given that all links have a capacity of 8 Mbps.
Also determine the bottleneck link(s) for each session.
So, r1 = r2 = r3 = r4 = 2 are maximally allocated, leaving sessions 5 and 6
as minimally allocated sessions with rates r5 = r6 = 2
Hence link (3,5) is the bottleneck link for sessions 5 and 6 So, r5 = r6 =
3 are now maximally allocated. As all sessions have been maximally
allocated, hence we stop our iterations. The final flow vector r, hence
becomes: [r1, r2, r3, r4, r5, r6] = [2, 2, 2, 2, 3, 3]
Find the max-min fair flow vector for the traffic flows shown in Figure 3 below. Also identify the bottleneck link
for each flow.](https://image.slidesharecdn.com/tsenotes2-170115101733/85/Telecommunication-System-Engineering-Notes-9-320.jpg)
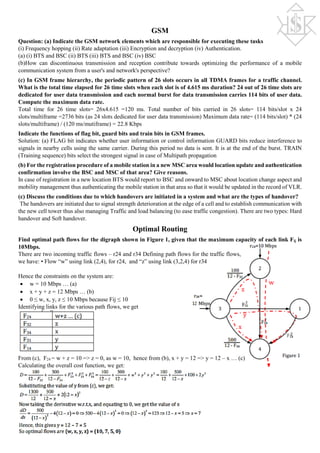
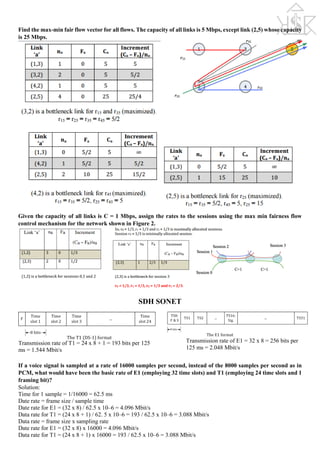
![Given that each node has exactly one flow to node B, we can redraw the above figure to include flows that take
the shortest path from each node to our node of interest i.e. node B.
Flows rCA and rDA cause link DB to overflow, hence they are stopped
at 1.5 Mbps. Hence, flow vector after 1st iteration is: [rCA, rDA, rBA,
rEA] = [1.5, 1.5, 1.5, 1.5] Iteration 2:
Flows 𝑟𝑟𝐵𝐵𝐵𝐵 𝑎𝑎𝑎𝑎𝑎𝑎 𝑟𝑟𝐸𝐸𝐸𝐸 cause link EA to overflow, hence they are stopped after an increment of 1 Mbps at 2.5 Mbps.
Hence, max-min fair flow vector is: [𝑟𝑟𝐶𝐶𝐶𝐶, 𝑟𝑟𝐷𝐷𝐷𝐷, 𝑟𝑟𝐵𝐵𝐵𝐵, 𝑟𝑟𝐸𝐸𝐸𝐸] = [1.5, 1.5, 2.5, 2.5]
Given that each node has exactly one flow to node B, we can redraw the above figure to include flows that take
the shortest path from each node to our node of interest i.e. node B.
Flows rCB and rDB cause overflow at link EB, which is hence a
bottleneck link for these flows. Hence, max-min fair flow vector after
Iteration 1 is: [𝑟𝑟𝐶𝐶𝐶𝐶, 𝑟𝑟𝐷𝐷𝐷𝐷, 𝑟𝑟𝐴𝐴𝐴𝐴, 𝑟𝑟𝐸𝐸𝐸𝐸] = [0.5, 0.5, 0.5, 0.5]
Flows rAB and rEB cause link EB to overflow, hence they are stopped after an increment of 1 Mbps at 1.5 Mbps.
Hence, max-min fair flow vector is:[𝑟𝑟𝐶𝐶𝐶𝐶, 𝑟𝑟𝐷𝐷𝐷𝐷, 𝑟𝑟𝐵𝐵𝐵𝐵, 𝑟𝑟𝐸𝐸𝐸𝐸] = [0.5, 0.5, 1.5, 1.5]
Determine whether the flow distribution; for the Figure 2 above; is max-min fair or not. The capacity of all links
is 5 Mbps, except link (2,5) whose capacity is 25 Mbps.
For testing bottleneck links, we increase a flow by a small amount and observe which links overflow. If the link that
overflows, has that flow as the largest flow, then that link is the bottleneck link for that flow.
As flow has no associated bottleneck link, hence the distribution is NOT Max-Min fair.](https://image.slidesharecdn.com/tsenotes2-170115101733/85/Telecommunication-System-Engineering-Notes-10-320.jpg)
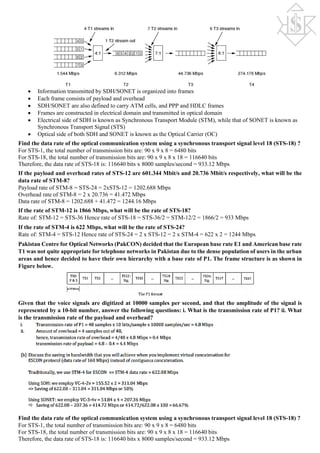
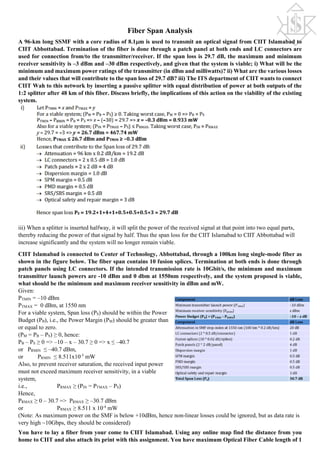

The document discusses various algorithms for finding shortest paths in graphs, such as Bellman-Ford and Dijkstra’s, and their application in network flow analysis. It details calculations for max-min fair flow distribution, capacity constraints, signal processing in GSM networks, and data rates in optical communication systems like SDH/SONET. Additionally, it covers the implications of fiber span analysis on network viability and optimal routing scenarios involving multiple traffic flows.