If you're a new user, Microsoft Excel can be pretty intimidating. This guide will help you learn 14 essential terms to get you started becoming literate in Excel.
If you're a new user, Microsoft Excel can be pretty intimidating. This guide will help you learn 14 essential terms to get you started becoming literate in Excel.
This power point can be used to teach children ages 7-12 about some basic functions of the Excel program. This power point helps explain columns, rows, creating graphs & analyzing data. This is a fun power point that can be used as a teaching aid that can allow kids to get excited!
This power point can be used to teach children ages 7-12 about some basic functions of the Excel program. This power point helps explain columns, rows, creating graphs & analyzing data. This is a fun power point that can be used as a teaching aid that can allow kids to get excited!
Youtube Link:
English: https://youtu.be/U2lBTGR3GeQ
Hindi: https://youtu.be/uGwJb7t28t4
Excel – is the world’s most widely used spreadsheet calculating program
It is used in many places like hospitals, hotels, school and companies etc.
A program that allows you to use data to forecast, manage, predict, and present information
Let’s Just Go For It! Wish you an Awesome Learning Experience.
Subscribe to our YouTube channel:
https://www.youtube.com/c/TimesRide?sub_confirmation=1
Visit our Official Website: https://timesride.com/
Follow us:
Facebook: https://www.facebook.com/timesride
Twitter: https://twitter.com/TimesRide
LinkedIn: https://www.linkedin.com/in/timesride
Instagram: https://www.instagram.com/timesride.connect
Pinterest: https://in.pinterest.com/timesrideconnect
Scribd: https://www.scribd.com/user/529709683/Times-Ride
Thank You
#AwesomeLearningExperience
#SmartQuickTips&Tricks #LeaningVideos #TimesRide #Keep Learning to Keep Winning!
Excel – is the world’s most widely used spreadsheet calculating program
It is used in many places like hospitals, hotels, school and companies etc.
A program that allows you to use data to forecast, manage, predict, and present information
Lets Just Go For It! Wish you an Awesome Leaning Experience.
Subscribe to our YouTube channel: https://www.youtube.com/c/TimesRide?sub_confirmation=1
Our Official Website: http://timesride.com
Follow us:
Facebook: https://www.facebook.com/rs.agrawal.9026
Instagram: https://www.instagram.com/timesridenetwork/
Twitter: https://twitter.com/TimesRide
Pinterest: https://in.pinterest.com/ride0472/
Thank You
#AwesomeLearningExperience
#SmartQuickTips&Tricks #LeaningVideos #TimesRide #Keep Learning to Keep Winning!
Biological screening of herbal drugs: Introduction and Need for
Phyto-Pharmacological Screening, New Strategies for evaluating
Natural Products, In vitro evaluation techniques for Antioxidants, Antimicrobial and Anticancer drugs. In vivo evaluation techniques
for Anti-inflammatory, Antiulcer, Anticancer, Wound healing, Antidiabetic, Hepatoprotective, Cardio protective, Diuretics and
Antifertility, Toxicity studies as per OECD guidelines
The simplified electron and muon model, Oscillating Spacetime: The Foundation...RitikBhardwaj56
Discover the Simplified Electron and Muon Model: A New Wave-Based Approach to Understanding Particles delves into a groundbreaking theory that presents electrons and muons as rotating soliton waves within oscillating spacetime. Geared towards students, researchers, and science buffs, this book breaks down complex ideas into simple explanations. It covers topics such as electron waves, temporal dynamics, and the implications of this model on particle physics. With clear illustrations and easy-to-follow explanations, readers will gain a new outlook on the universe's fundamental nature.
Introduction to AI for Nonprofits with Tapp NetworkTechSoup
Dive into the world of AI! Experts Jon Hill and Tareq Monaur will guide you through AI's role in enhancing nonprofit websites and basic marketing strategies, making it easy to understand and apply.
Macroeconomics- Movie Location
This will be used as part of your Personal Professional Portfolio once graded.
Objective:
Prepare a presentation or a paper using research, basic comparative analysis, data organization and application of economic information. You will make an informed assessment of an economic climate outside of the United States to accomplish an entertainment industry objective.
Normal Labour/ Stages of Labour/ Mechanism of LabourWasim Ak
Normal labor is also termed spontaneous labor, defined as the natural physiological process through which the fetus, placenta, and membranes are expelled from the uterus through the birth canal at term (37 to 42 weeks
Executive Directors Chat Leveraging AI for Diversity, Equity, and InclusionTechSoup
Let’s explore the intersection of technology and equity in the final session of our DEI series. Discover how AI tools, like ChatGPT, can be used to support and enhance your nonprofit's DEI initiatives. Participants will gain insights into practical AI applications and get tips for leveraging technology to advance their DEI goals.
Acetabularia Information For Class 9 .docxvaibhavrinwa19
Acetabularia acetabulum is a single-celled green alga that in its vegetative state is morphologically differentiated into a basal rhizoid and an axially elongated stalk, which bears whorls of branching hairs. The single diploid nucleus resides in the rhizoid.
Exploiting Artificial Intelligence for Empowering Researchers and Faculty, In...Dr. Vinod Kumar Kanvaria
Exploiting Artificial Intelligence for Empowering Researchers and Faculty,
International FDP on Fundamentals of Research in Social Sciences
at Integral University, Lucknow, 06.06.2024
By Dr. Vinod Kumar Kanvaria
Safalta Digital marketing institute in Noida, provide complete applications that encompass a huge range of virtual advertising and marketing additives, which includes search engine optimization, virtual communication advertising, pay-per-click on marketing, content material advertising, internet analytics, and greater. These university courses are designed for students who possess a comprehensive understanding of virtual marketing strategies and attributes.Safalta Digital Marketing Institute in Noida is a first choice for young individuals or students who are looking to start their careers in the field of digital advertising. The institute gives specialized courses designed and certification.
for beginners, providing thorough training in areas such as SEO, digital communication marketing, and PPC training in Noida. After finishing the program, students receive the certifications recognised by top different universitie, setting a strong foundation for a successful career in digital marketing.
MASS MEDIA STUDIES-835-CLASS XI Resource Material.pdf
Basic tasks in excel 2013
1. Basic tasks in Excel 2013
Touch
Guide
Excel is an incredibly powerful tool for getting meaning out of vast amounts of data. But it
also works really well for simple calculations and tracking almost any kind of information.
The key for unlocking all that potential is the grid of cells. Cells can contain numbers, text
or formulas. You put data in your cells and group them in rows and columns. That allows
you to add up your data, sort and filter it, put it in tables, and build great-looking charts.
Let’s go through the basic steps to get you started.
Tip For a training course to help you create your first workbook, see Create your first
Excel 2013 workbook. To learn about new features, see What's new in Excel 2013.
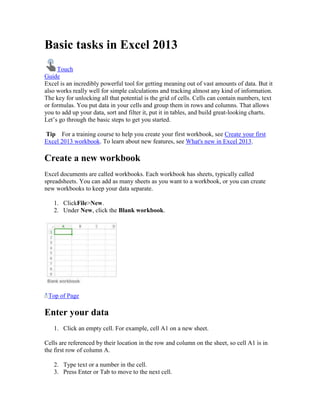
Create a new workbook
Excel documents are called workbooks. Each workbook has sheets, typically called
spreadsheets. You can add as many sheets as you want to a workbook, or you can create
new workbooks to keep your data separate.
1. ClickFile>New.
2. Under New, click the Blank workbook.
Top of Page
Enter your data
1. Click an empty cell. For example, cell A1 on a new sheet.
Cells are referenced by their location in the row and column on the sheet, so cell A1 is in
the first row of column A.
2. Type text or a number in the cell.
3. Press Enter or Tab to move to the next cell.
2. Learn more about ways to enter data manually in worksheet cells.
Top of Page
Use AutoSum to add your data
When you’ve entered numbers in your sheet, you might want to add them up. A fast way to
do that is by using AutoSum.
1. Select the cell to the right or below the numbers you want to add.
2. Click Home>AutoSum, or press Alt+=.
AutoSum adds up the numbers and shows the result in the cell you selected.
Top of Page
Create a simple formula
Adding numbers is just one of the things you can do, but Excel can do other math too. Try
some simple formulas to add, subtract, multiply or divide your numbers.
1. Pick a cell and type an equal sign (=). That tells Excel that this cell will contain a
formula.
2. Type a combination of numbers and calculation operators, like the plus sign (+) for
addition, the minus sign (-) for subtraction, the asterisk (*) for multiplication, or the
forward slash (/) for division.
Forexample, enter=2+4, =4-2, =2*4, or=4/2.
3. Press Enter. That runs the calculation.
You can also press Ctrl+Enter if you want the cursor to stay on the active cell.
Learn more about creating a simple formula.
Top of Page
Apply a number format
3. To distinguish between different types of numbers, add a format, like currency,
percentages, or dates.
1. Select the cells that have numbers you want to format.
2. Click Home> Arrow next to General.
3. Pick a numberformat.
If you don’t see the number format you’re looking for, click More Number Formats.
Learn more about ways to format numbers.
4. Top of Page
Put your data in a table
A simple way to access a lot of Excel’s power is to put your data in a table. That lets you
quickly filter or sort your data for starters.
1. Select your data by clicking the first cell and dragging to the last cell in your data.
To use the keyboard, hold down Shift while you press the arrow keys to select your data.
2. Click the Quick Analysis button
in the bottom-right corner of the selection.
3. Click Tables, move your cursor to the Table button so you can see how your data
will look. Ifyoulikewhatyousee, clickthebutton.
4. Now you can play with your data: Filter to see only the data you want, or sort it to
go from, say, largest to smallest. Click the arrow in the table header of a column.
5. 5. To filter data, uncheck the Select All box to clear all check marks, and then check
the boxes of the data you want to show in your table.
6. To sort the data, click Sort A to Z or Sort Z to A.
6. Learn more about filtering data in an Excel table.
Top of Page
Show totals for your numbers
Quick Analysis tools let you total your numbers quickly. Whether it’s a sum, average, or
count you want, Excel shows the calculation results right below or next to your numbers.
1. Select the cells that contain numbers you want to add or count.
2. Click the Quick Analysis button
in the bottom-right corner of the selection.
3. Click Totals, move your cursor across the buttons to see the calculation results for
your data, and then click the button to apply the totals.
Top of Page
7. Add meaning to your data
Conditional formatting or sparklines can highlight your most important data or show data
trends. Use the Quick Analysis tool for a Live Preview to try it out.
1. Select the data you want to examine more closely.
2. Click the Quick Analysis button
that appears in the lower-right corner of your
selection.
3. Explore the options on the Formatting and Sparklines tabs to see how they affect
your data.
For example, pick a color scale in the Formatting gallery to differentiate high, medium,
and low temperatures.
4. When you like what you see, click that option.
Learn more about how to apply conditional formatting or analyze trends in data using
sparklines.
Top of Page
Show your data in a chart
The Quick Analysis tool recommends the right chart for your data and gives you a visual
presentation in just a few clicks.
1. Select the cells that contain the data you want to show in a chart.
2. Click the Quick Analysis button
that appears in the lower-right corner of your
selection.
3. Click Charts, move across the recommended charts to see which one looks best for
your data, and then click the one that you want.
8. Note Excel shows different charts in this gallery, depending on what’s recommended for
your data.
Learn about other ways to create a chart.
Top of Page
Save your work
1. Click the Save button on the Quick Access Toolbar, or press Ctrl+S.
If you’ve saved your work before, you’re done.
2. If this is the first time, go on to complete the next steps:
1. Under Save As, pick where to save your workbook, and then browse to a
folder.
2. In the File name box, enter a name for your workbook.
3. ClickSavetofinish.
Top of Page
Print
1. Click File>Print, or press Ctrl+P.
2. Preview the pages by clicking the Next Page and Previous Page arrows.
The preview window displays the pages in black and white or in color, depending on your
printer settings.
If you don’t like how your pages will be printed, you can change page margins or add page
breaks.
9. 3. ClickPrint.
Learn more about printing a worksheet or workbook.
Top of Page
Beyond the basics
Go beyond the basics with your workbooks by using a function to create a formula, using
slicers to filter data in an Excel table, or adding a trend or average line to a chart.
Appliesto:
Excel 2013