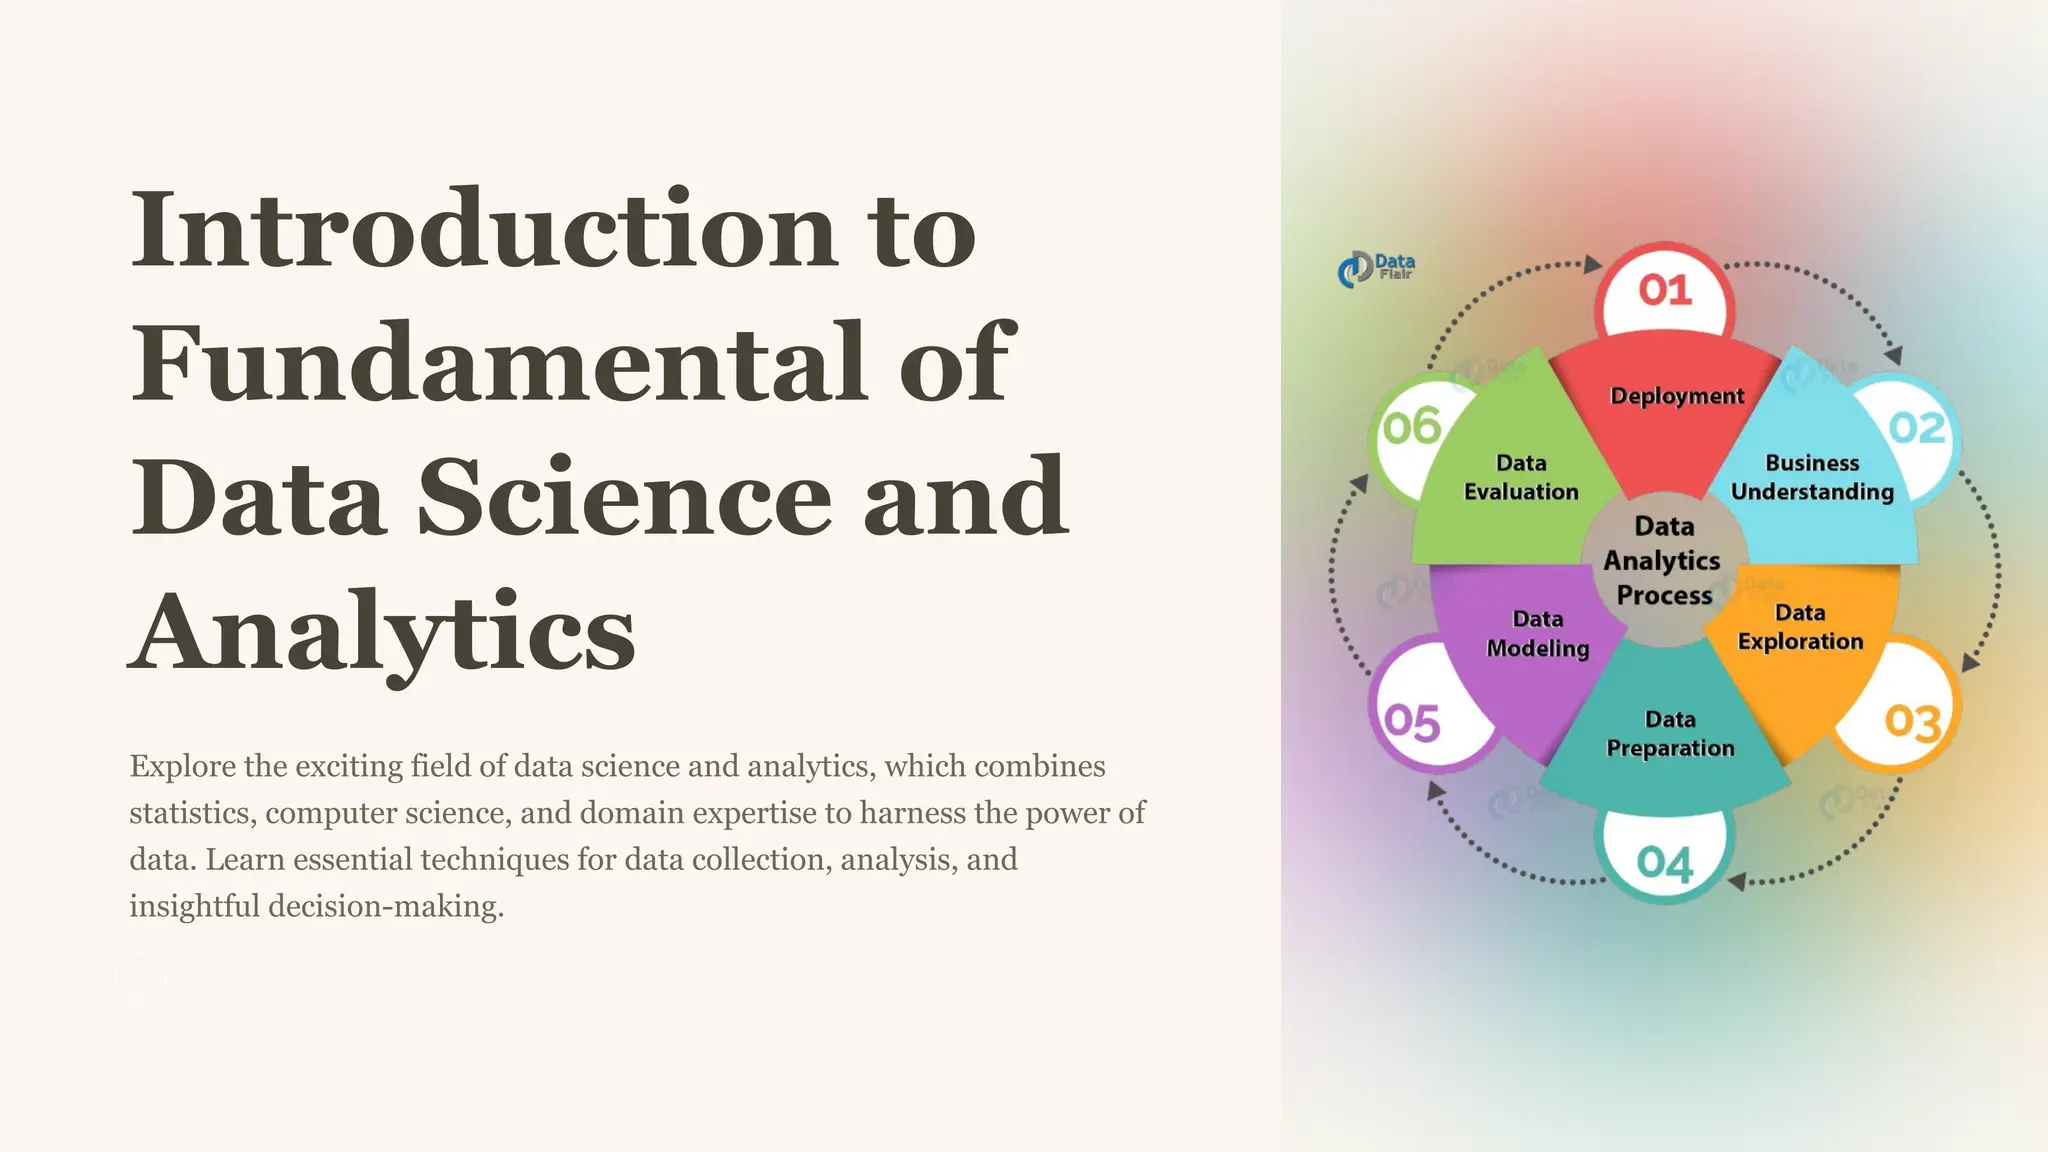
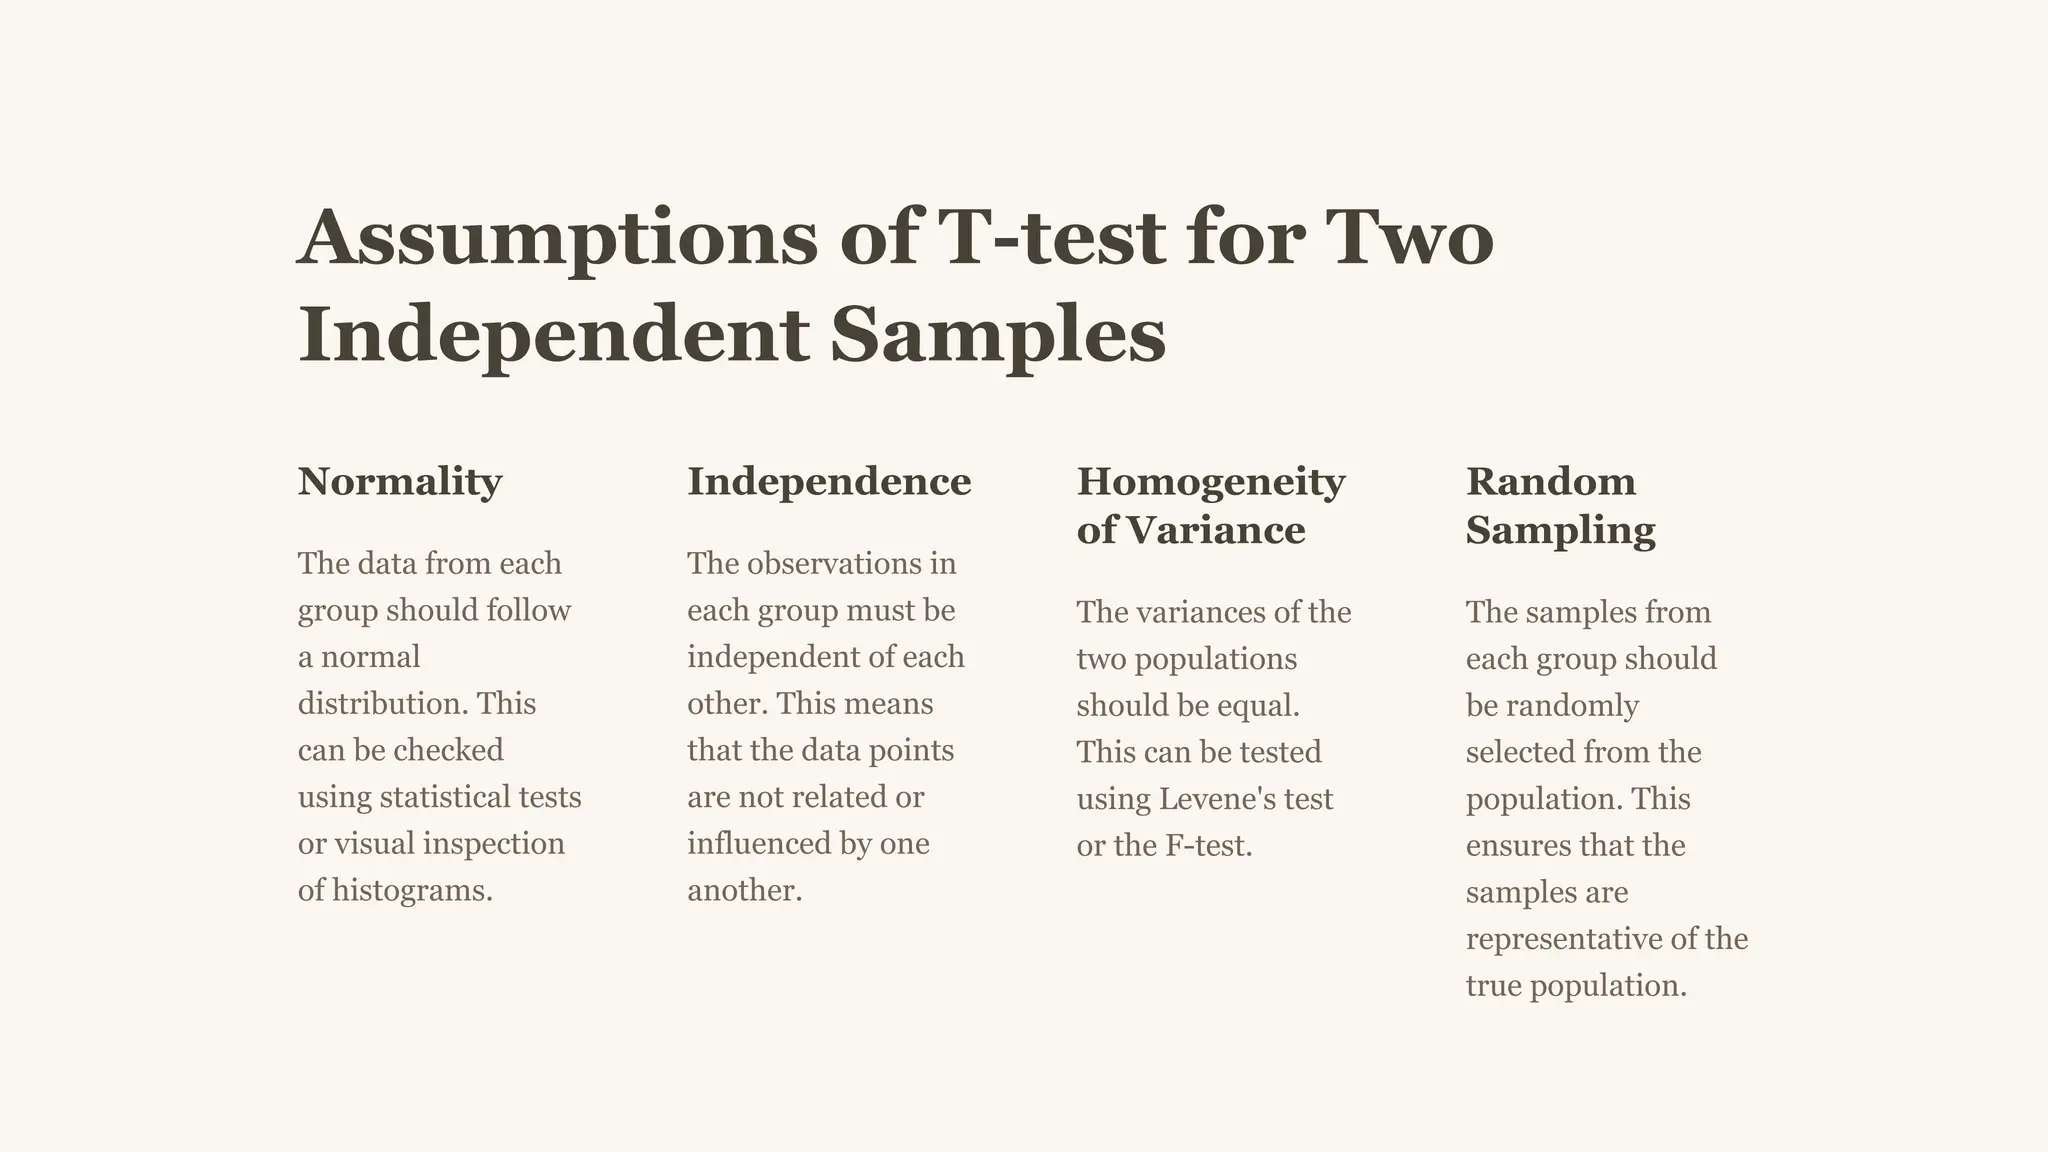
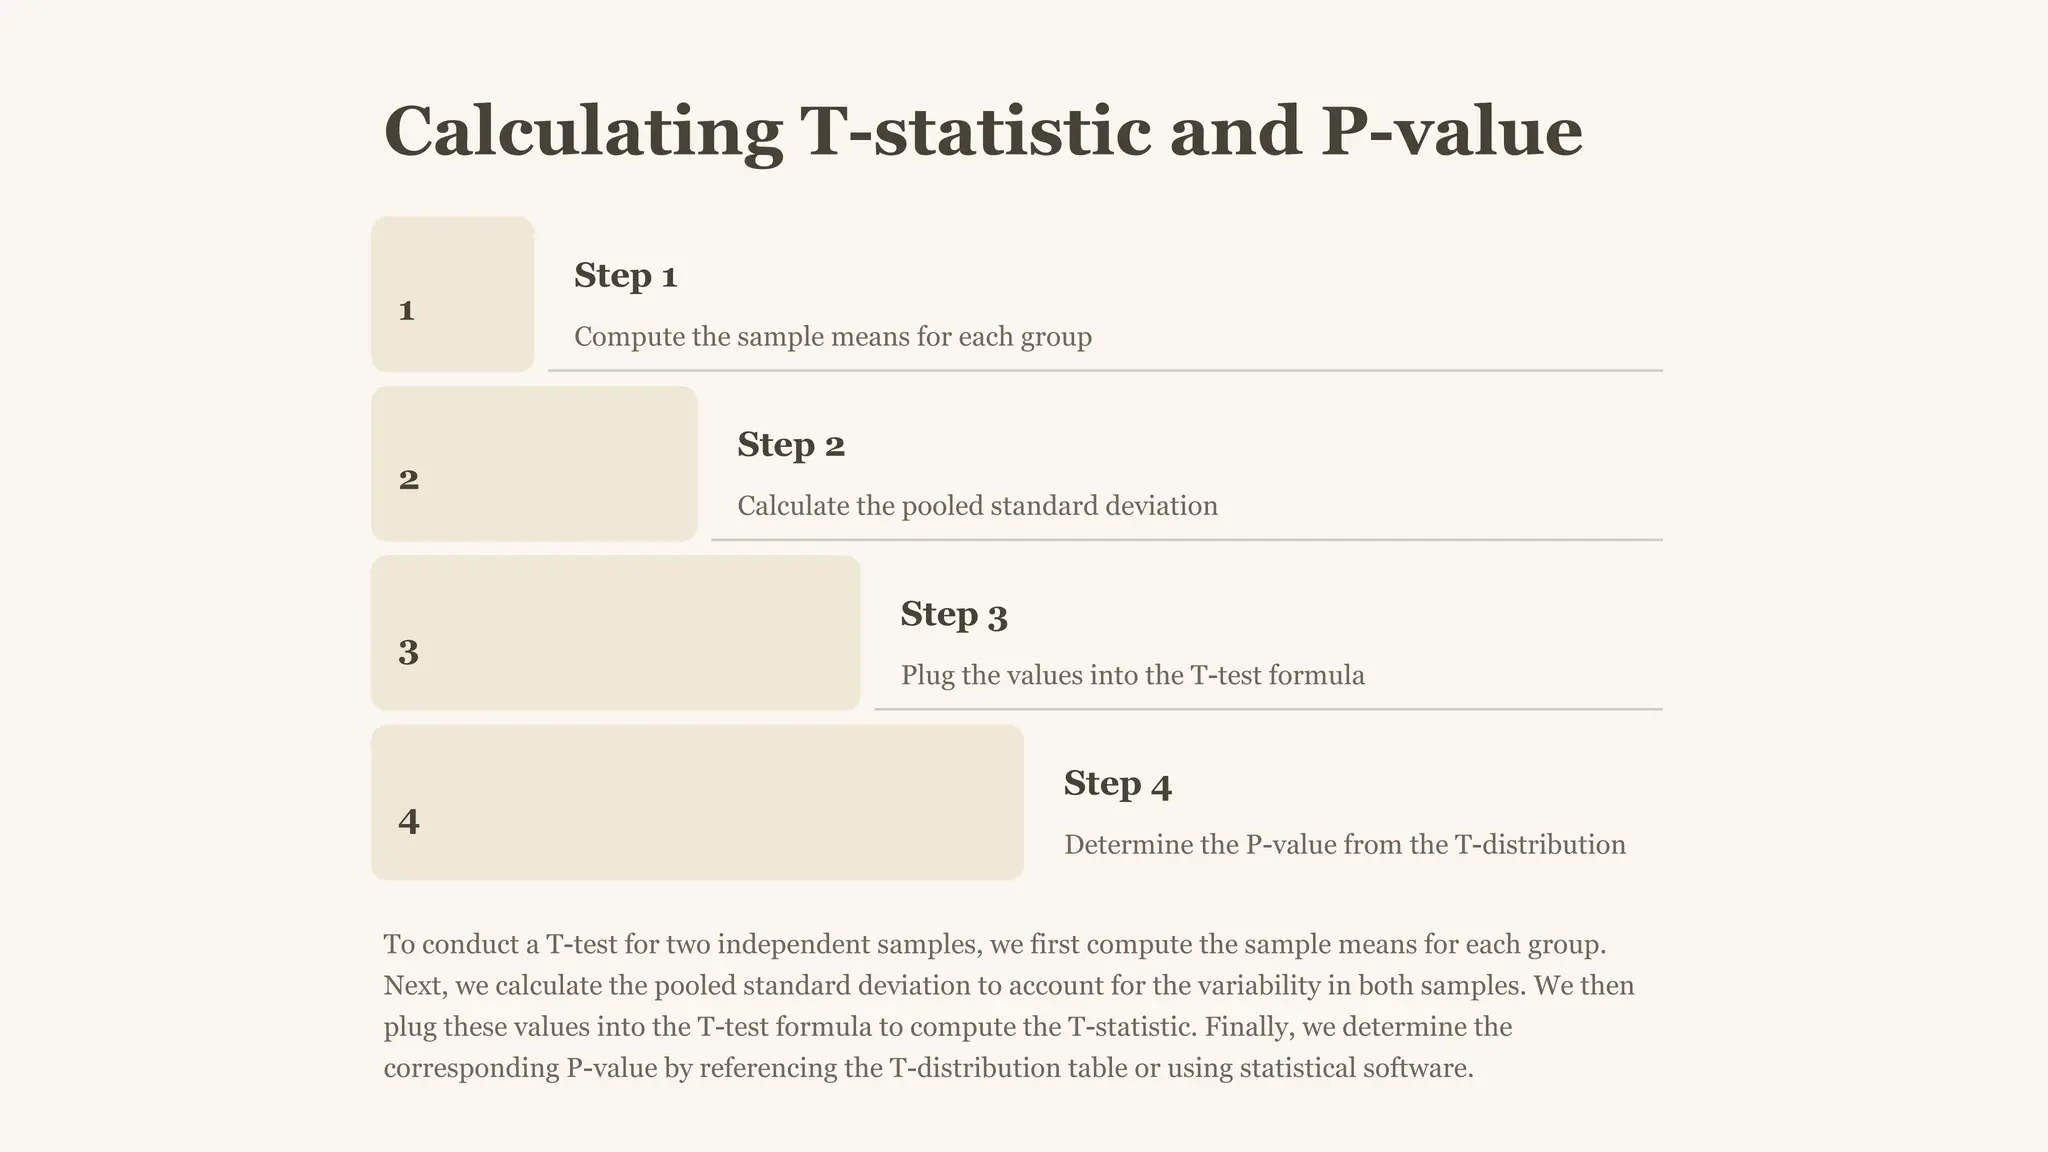
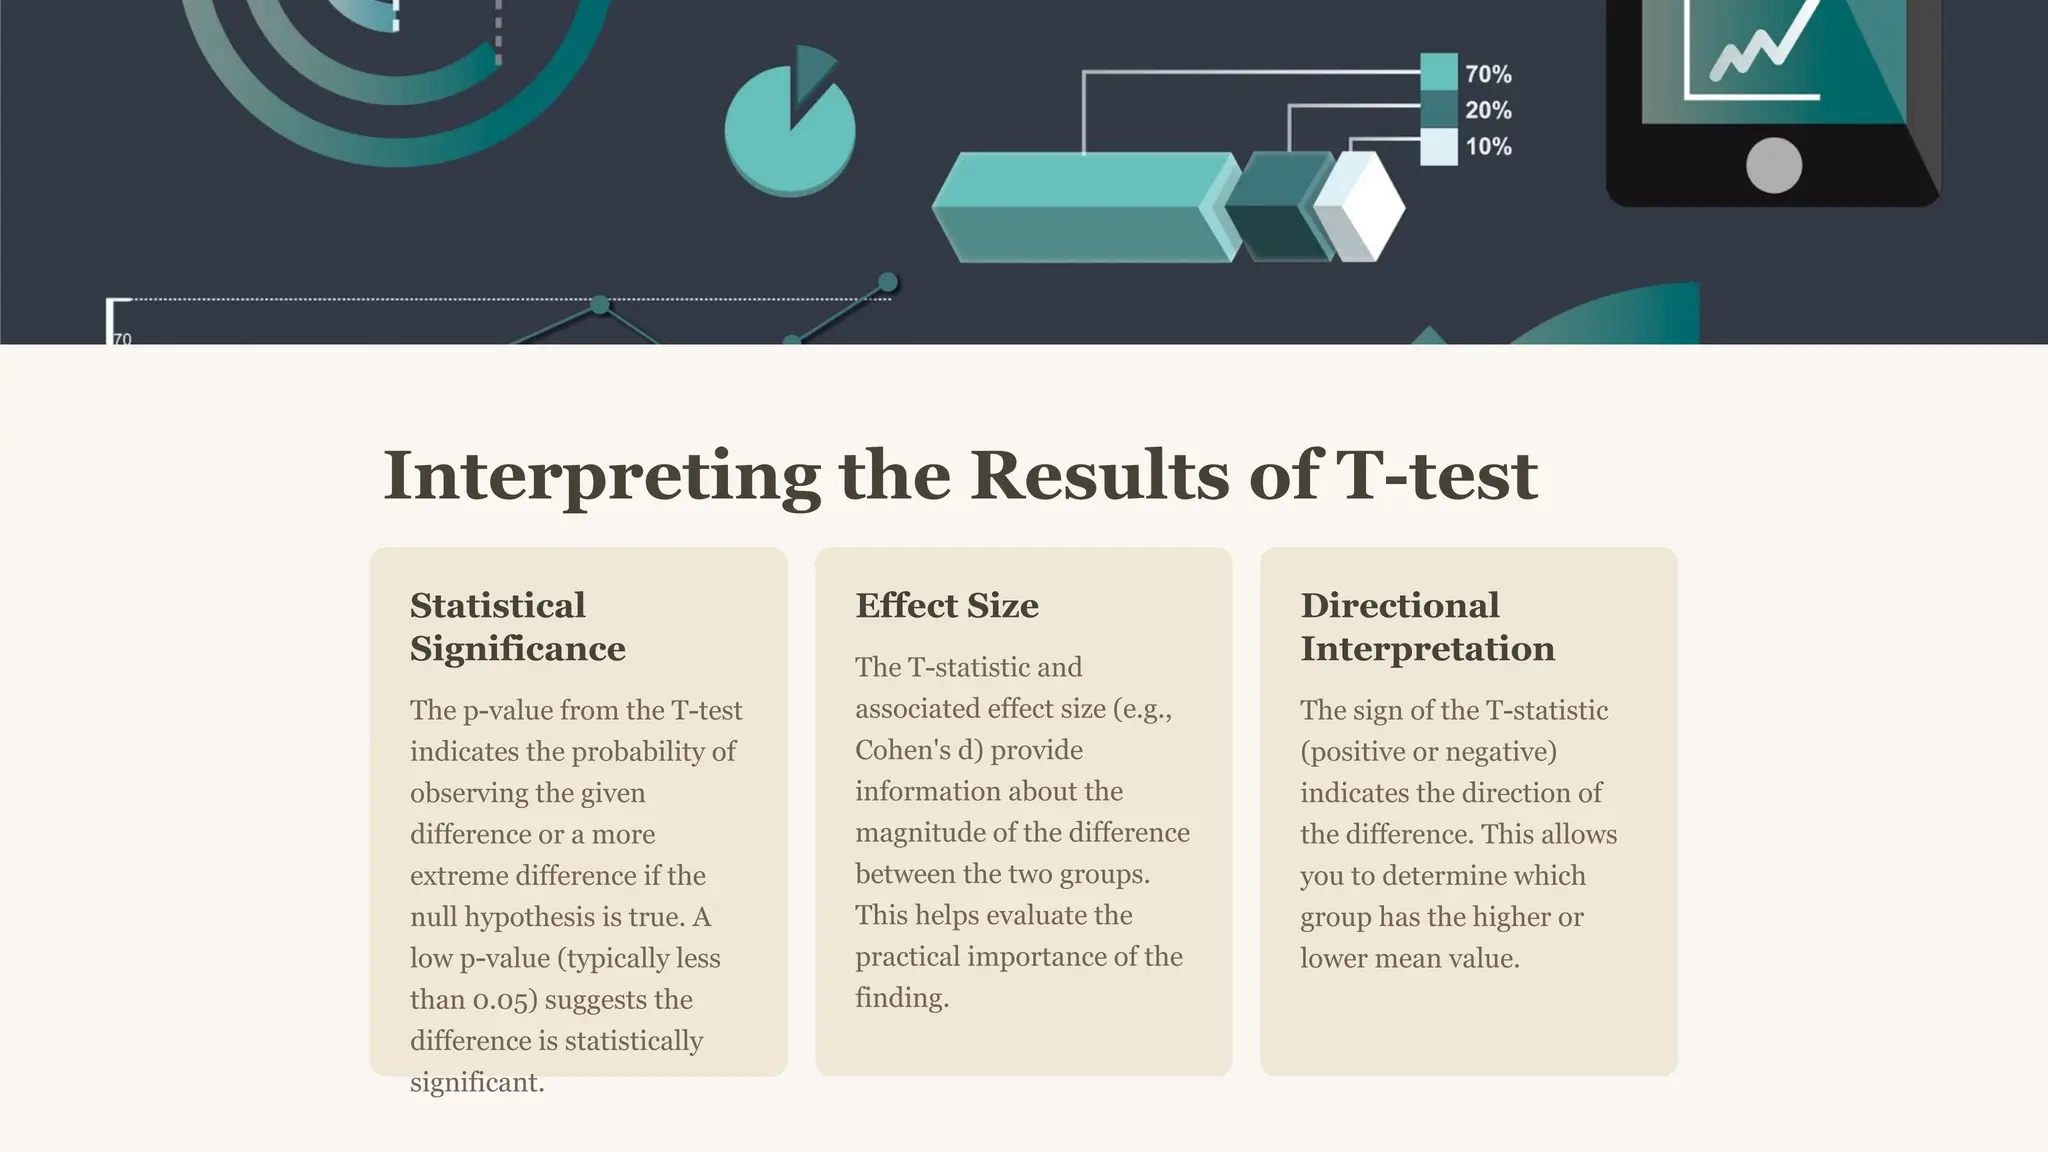
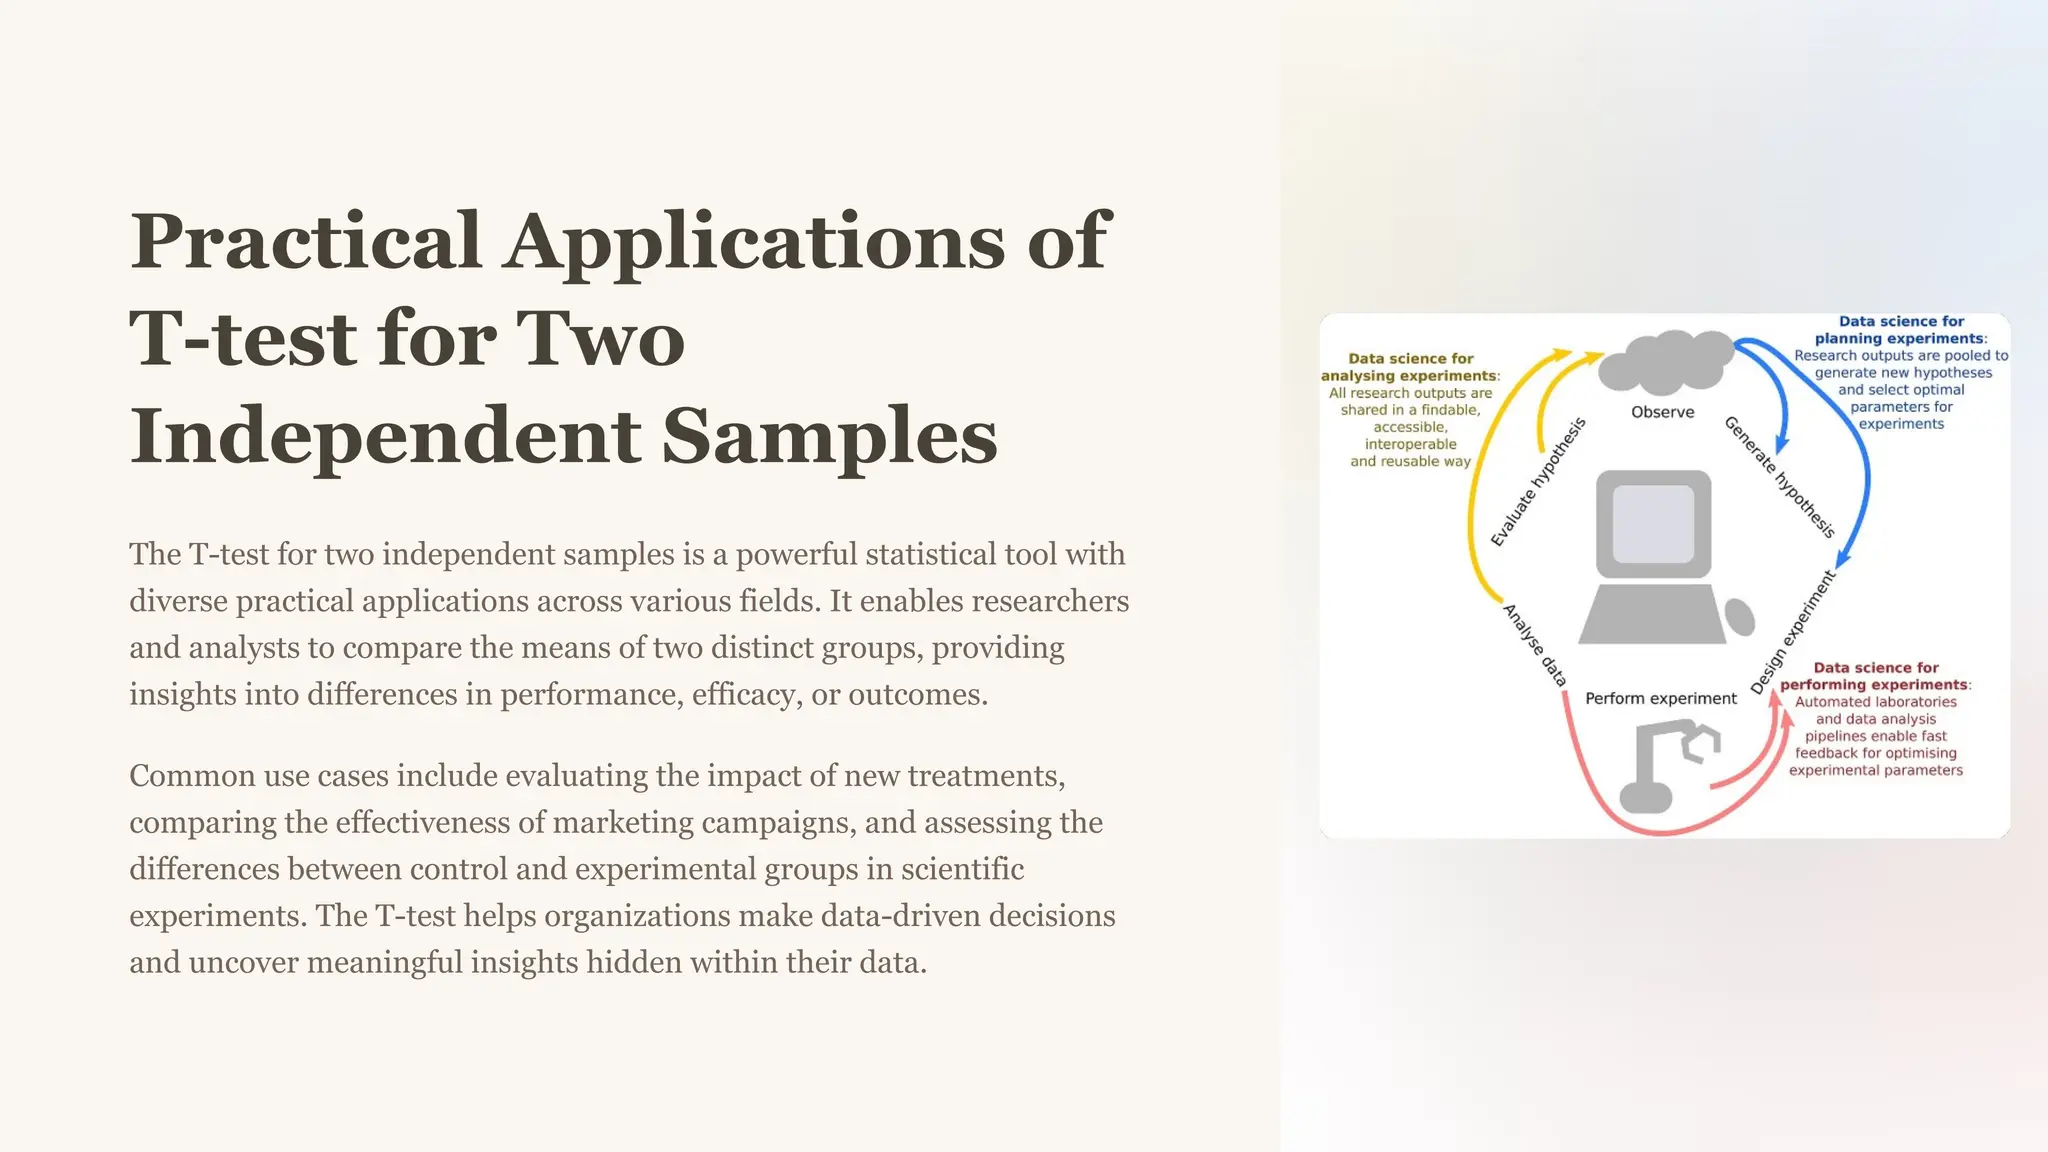
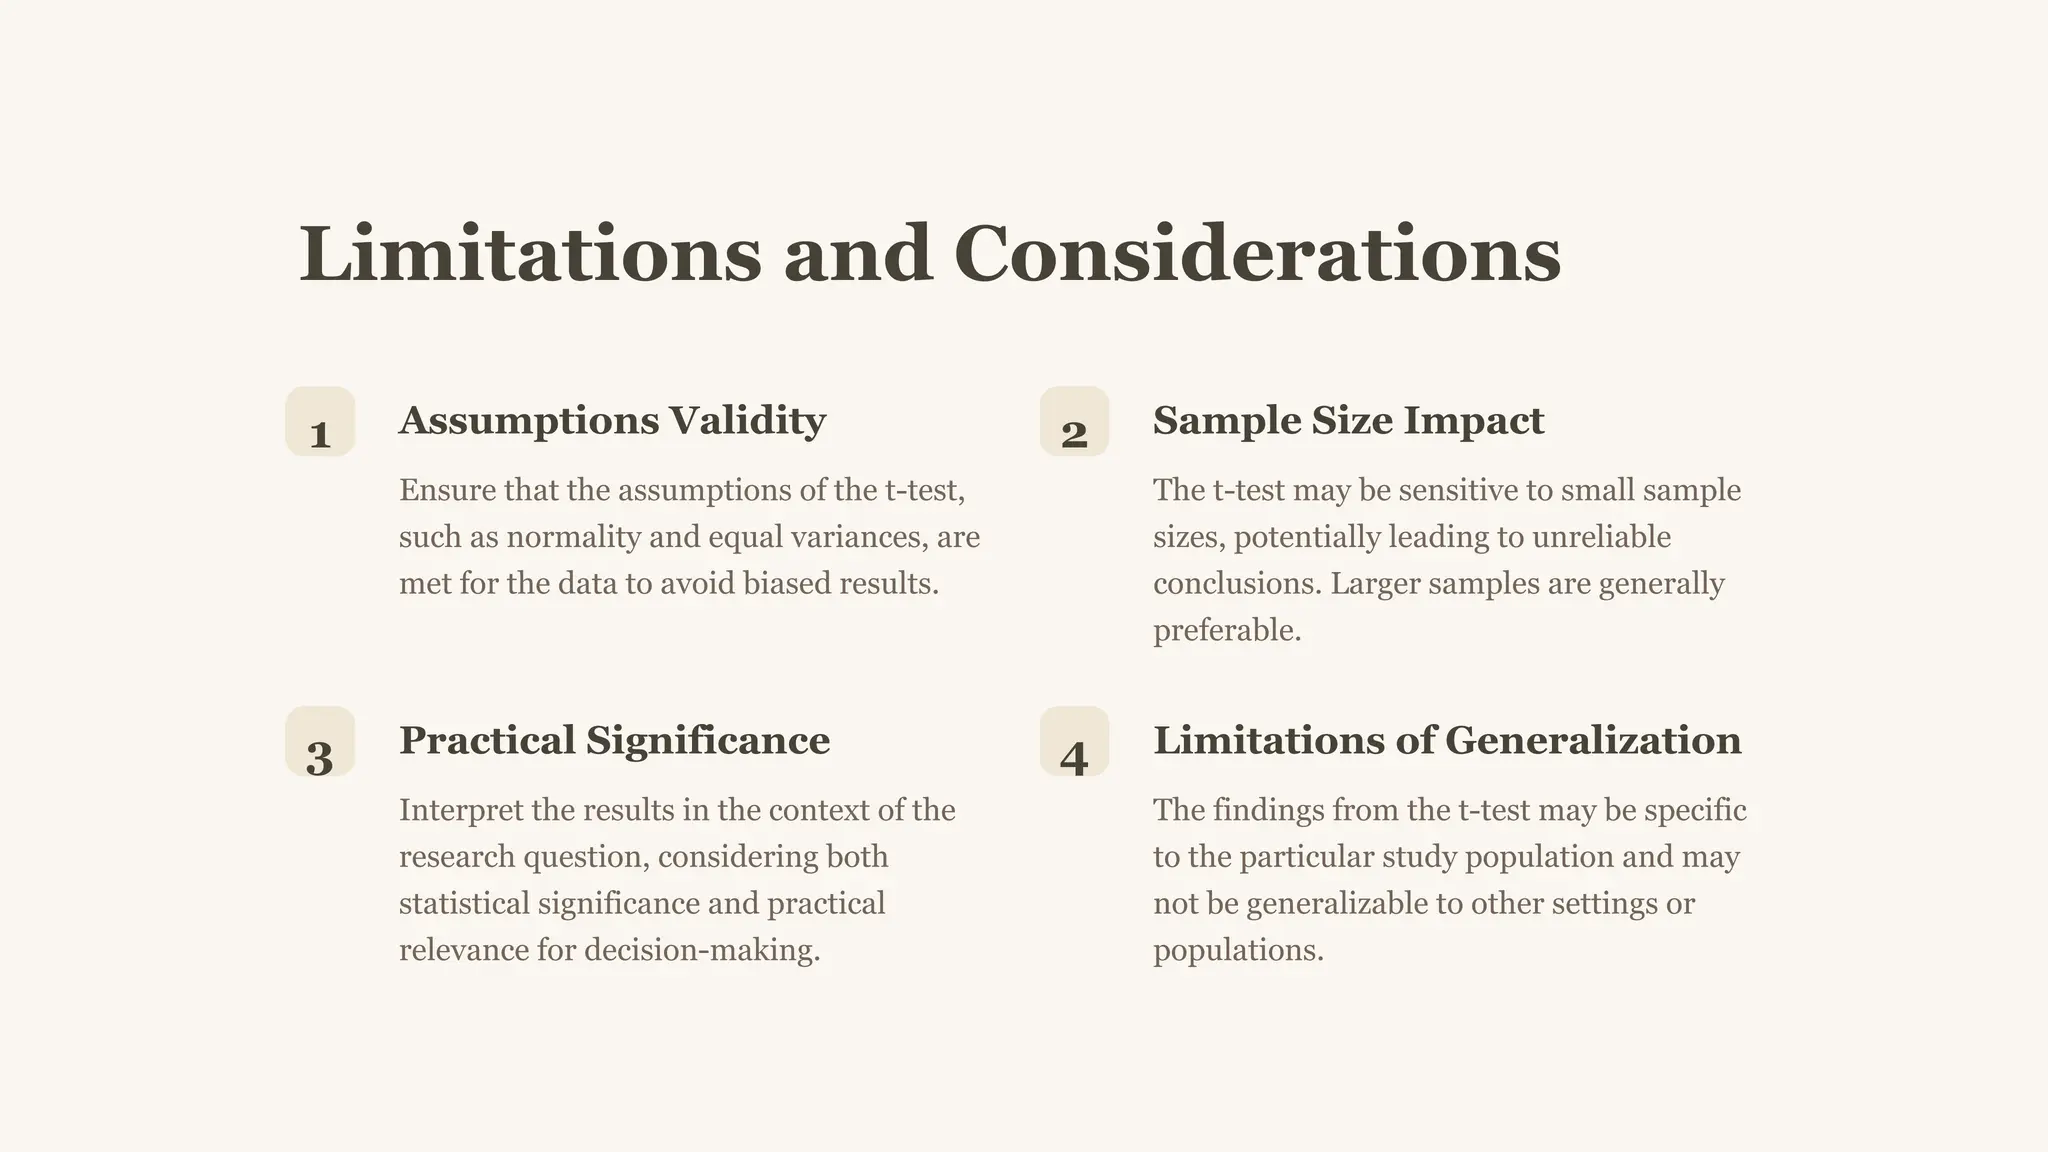
Introduction to
Fundamental of
Data Science and
Analytics
Explore the exciting field of data science and analytics, which combines
statistics, computer science, and domain expertise to harness the power of
data. Learn essential techniques for data collection, analysis, and
insightful decision-making.
Overview of Statistical Inference
Understanding Data
Patterns
Statistical inference involves
drawing conclusions about
population characteristics
based on sample data. It helps
us identify meaningful trends
and relationships in complex
datasets.
Hypothesis Testing
A key aspect of statistical
inference is hypothesis testing,
where we formulate and
evaluate statistical hypotheses
to determine if they are
supported by the sample data.
Statistical Modeling
Statistical inference also
involves developing statistical
models to describe and predict
relationships between
variables. These models
provide insights into the
underlying processes
generating the data.
Concept of Hypothesis Testing
Research Question
Hypothesis testing begins with
a research question that you
want to investigate or a claim
you want to evaluate.
Null Hypothesis
The null hypothesis is the
statement that there is no
significant difference or
relationship between the
variables being studied.
Alternative Hypothesis
The alternative hypothesis
states that there is a significant
difference or relationship
between the variables, contrary
to the null hypothesis.
Hypothesis testing is a statistical method used to determine whether a particular claim or hypothesis
about a population parameter is likely to be true or false. It involves making assumptions, collecting data,
and using statistical tests to evaluate the strength of evidence against the null hypothesis.
T-test for Two Independent
Samples
1 Comparing Means
The t-test for two independent samples is used to compare the means of two
different populations or groups.
2 Assumptions
This test assumes the two samples are independent, the data is normally
distributed, and the variances are equal.
3 Hypothesis Testing
The test generates a t-statistic and a p-value to determine if there is a
statistically significant difference between the two means.
Assumptions of T-test for Two
Independent Samples
Normality
The data from each
group should follow
a normal
distribution. This
can be checked
using statistical tests
or visual inspection
of histograms.
Independence
The observations in
each group must be
independent of each
other. This means
that the data points
are not related or
influenced by one
another.
Homogeneity
of Variance
The variances of the
two populations
should be equal.
This can be tested
using Levene's test
or the F-test.
Random
Sampling
The samples from
each group should
be randomly
selected from the
population. This
ensures that the
samples are
representative of the
true population.
Calculating T-statistic and P-value
1
Step 1
Compute the sample means for each group
2
Step 2
Calculate the pooled standard deviation
3
Step 3
Plug the values into the T-test formula
4
Step 4
Determine the P-value from the T-distribution
To conduct a T-test for two independent samples, we first compute the sample means for each group.
Next, we calculate the pooled standard deviation to account for the variability in both samples. We then
plug these values into the T-test formula to compute the T-statistic. Finally, we determine the
corresponding P-value by referencing the T-distribution table or using statistical software.
Interpreting the Results of T-test
Statistical
Significance
The p-value from the T-test
indicates the probability of
observing the given
difference or a more
extreme difference if the
null hypothesis is true. A
low p-value (typically less
than 0.05) suggests the
difference is statistically
significant.
Effect Size
The T-statistic and
associated effect size (e.g.,
Cohen's d) provide
information about the
magnitude of the difference
between the two groups.
This helps evaluate the
practical importance of the
finding.
Directional
Interpretation
The sign of the T-statistic
(positive or negative)
indicates the direction of
the difference. This allows
you to determine which
group has the higher or
lower mean value.
Practical Applications of
T-test for Two
Independent Samples
The T-test for two independent samples is a powerful statistical tool with
diverse practical applications across various fields. It enables researchers
and analysts to compare the means of two distinct groups, providing
insights into differences in performance, efficacy, or outcomes.
Common use cases include evaluating the impact of new treatments,
comparing the effectiveness of marketing campaigns, and assessing the
differences between control and experimental groups in scientific
experiments. The T-test helps organizations make data-driven decisions
and uncover meaningful insights hidden within their data.
Limitations and Considerations
1 Assumptions Validity
Ensure that the assumptions of the t-test,
such as normality and equal variances, are
met for the data to avoid biased results.
2 Sample Size Impact
The t-test may be sensitive to small sample
sizes, potentially leading to unreliable
conclusions. Larger samples are generally
preferable.
3 Practical Significance
Interpret the results in the context of the
research question, considering both
statistical significance and practical
relevance for decision-making.
4 Limitations of Generalization
The findings from the t-test may be specific
to the particular study population and may
not be generalizable to other settings or
populations.
Conclusion and
Key Takeaways
In this module, we have explored the powerful T-test for comparing the
means of two independent samples. We have examined the underlying
assumptions, calculation, and interpretation of this statistical technique,
as well as its practical applications across various fields.

Introduction-to-Fundamental-of-Data-Science-and-Analytics.pptx

  • 1.
    Introduction to Fundamental of DataScience and Analytics Explore the exciting field of data science and analytics, which combines statistics, computer science, and domain expertise to harness the power of data. Learn essential techniques for data collection, analysis, and insightful decision-making.
  • 2.
    Overview of StatisticalInference Understanding Data Patterns Statistical inference involves drawing conclusions about population characteristics based on sample data. It helps us identify meaningful trends and relationships in complex datasets. Hypothesis Testing A key aspect of statistical inference is hypothesis testing, where we formulate and evaluate statistical hypotheses to determine if they are supported by the sample data. Statistical Modeling Statistical inference also involves developing statistical models to describe and predict relationships between variables. These models provide insights into the underlying processes generating the data.
  • 3.
    Concept of HypothesisTesting Research Question Hypothesis testing begins with a research question that you want to investigate or a claim you want to evaluate. Null Hypothesis The null hypothesis is the statement that there is no significant difference or relationship between the variables being studied. Alternative Hypothesis The alternative hypothesis states that there is a significant difference or relationship between the variables, contrary to the null hypothesis. Hypothesis testing is a statistical method used to determine whether a particular claim or hypothesis about a population parameter is likely to be true or false. It involves making assumptions, collecting data, and using statistical tests to evaluate the strength of evidence against the null hypothesis.
  • 4.
    T-test for TwoIndependent Samples 1 Comparing Means The t-test for two independent samples is used to compare the means of two different populations or groups. 2 Assumptions This test assumes the two samples are independent, the data is normally distributed, and the variances are equal. 3 Hypothesis Testing The test generates a t-statistic and a p-value to determine if there is a statistically significant difference between the two means.
  • 5.
    Assumptions of T-testfor Two Independent Samples Normality The data from each group should follow a normal distribution. This can be checked using statistical tests or visual inspection of histograms. Independence The observations in each group must be independent of each other. This means that the data points are not related or influenced by one another. Homogeneity of Variance The variances of the two populations should be equal. This can be tested using Levene's test or the F-test. Random Sampling The samples from each group should be randomly selected from the population. This ensures that the samples are representative of the true population.
  • 6.
    Calculating T-statistic andP-value 1 Step 1 Compute the sample means for each group 2 Step 2 Calculate the pooled standard deviation 3 Step 3 Plug the values into the T-test formula 4 Step 4 Determine the P-value from the T-distribution To conduct a T-test for two independent samples, we first compute the sample means for each group. Next, we calculate the pooled standard deviation to account for the variability in both samples. We then plug these values into the T-test formula to compute the T-statistic. Finally, we determine the corresponding P-value by referencing the T-distribution table or using statistical software.
  • 7.
    Interpreting the Resultsof T-test Statistical Significance The p-value from the T-test indicates the probability of observing the given difference or a more extreme difference if the null hypothesis is true. A low p-value (typically less than 0.05) suggests the difference is statistically significant. Effect Size The T-statistic and associated effect size (e.g., Cohen's d) provide information about the magnitude of the difference between the two groups. This helps evaluate the practical importance of the finding. Directional Interpretation The sign of the T-statistic (positive or negative) indicates the direction of the difference. This allows you to determine which group has the higher or lower mean value.
  • 8.
    Practical Applications of T-testfor Two Independent Samples The T-test for two independent samples is a powerful statistical tool with diverse practical applications across various fields. It enables researchers and analysts to compare the means of two distinct groups, providing insights into differences in performance, efficacy, or outcomes. Common use cases include evaluating the impact of new treatments, comparing the effectiveness of marketing campaigns, and assessing the differences between control and experimental groups in scientific experiments. The T-test helps organizations make data-driven decisions and uncover meaningful insights hidden within their data.
  • 9.
    Limitations and Considerations 1Assumptions Validity Ensure that the assumptions of the t-test, such as normality and equal variances, are met for the data to avoid biased results. 2 Sample Size Impact The t-test may be sensitive to small sample sizes, potentially leading to unreliable conclusions. Larger samples are generally preferable. 3 Practical Significance Interpret the results in the context of the research question, considering both statistical significance and practical relevance for decision-making. 4 Limitations of Generalization The findings from the t-test may be specific to the particular study population and may not be generalizable to other settings or populations.
  • 10.
    Conclusion and Key Takeaways Inthis module, we have explored the powerful T-test for comparing the means of two independent samples. We have examined the underlying assumptions, calculation, and interpretation of this statistical technique, as well as its practical applications across various fields.