Downloaded 46 times


![Elements of a Class Diagram[contd..]
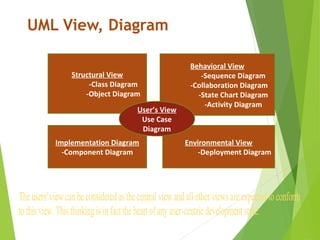
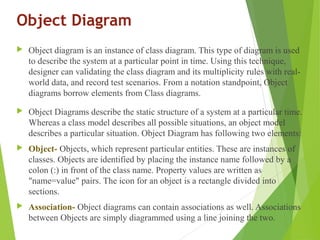
Modifiers are used to indicate visibility of attributes and operations.
‘+’ is used to denote Public visibility (everyone)
‘#’ is used to denote Protected visibility (derived)
‘-’ is used to denote Private visibility (no one)
By default, attributes are hidden and operations are visible
For example:
Here Account is the class name which has three attributes customer_name(type char,
visibility private), account_no( type int, visibility private), balance(type int,
visibility private) and Account class operates addfunds and withdraw method.
Visibility of operations are public.
Account
-customer_name: char
-account_no: int
-balance: int
+addfunds(in amount)
+withdraw(in amount)](https://image.slidesharecdn.com/systemdesign2-130721215751-phpapp01/85/ASP-NET-System-design-2-16-320.jpg)
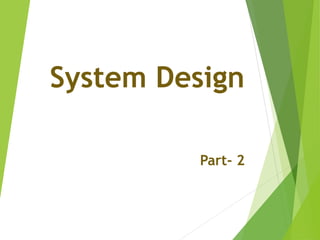
![Relationship between Classes [contd..]
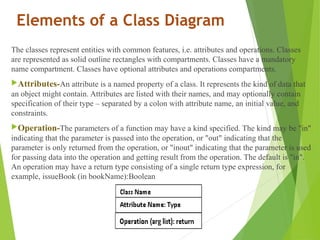
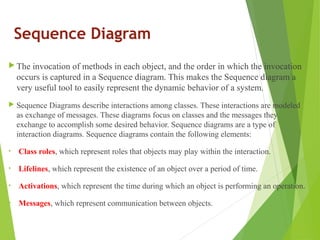
On each side of the association relation the multiplicity is noted as an
individual number or as a value range. The multiplicity indicates how
many instances of one class are associated with the other. Value ranges of
multiplicity are noted by specifying the minimum and maximum value,
separated by two dots. An asterisk is used as a wild card and means many
(zero or more).
The association of above figure should be read as "Many books may be
borrowed by a Library Member”
0..1 Borrowed by 0..*](https://image.slidesharecdn.com/systemdesign2-130721215751-phpapp01/85/ASP-NET-System-design-2-18-320.jpg)
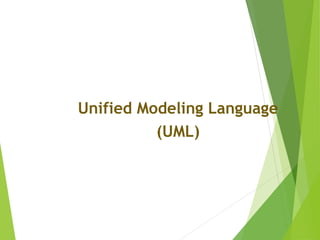
![Relationship between Classes [contd..]
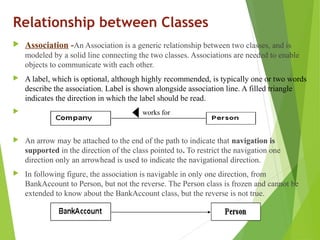
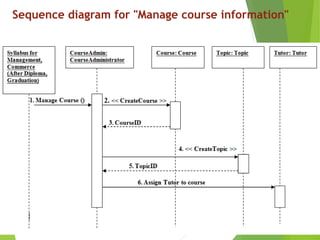
Aggregation -When a class is formed as a collection of other classes, it is
called an aggregation relationship between these classes. It is also called a
"has a" relationship. (It is a special type of association where the involved
classes are not only associated to each other, but a whole- part relationship
exists between them.)
Aggregation is represented by the diamond symbol at the composite/aggregate
end of a relationship. The number of instances of the component class
aggregated can also be shown in diagram.
1..* consist of 1..* 1..* consist of 1..*
A document can be considered as an aggregation of paragraphs. Each
paragraph can in turn be considered as aggregation of lines.](https://image.slidesharecdn.com/systemdesign2-130721215751-phpapp01/85/ASP-NET-System-design-2-19-320.jpg)
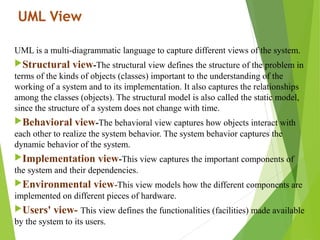
![Relationship between Classes [contd..]
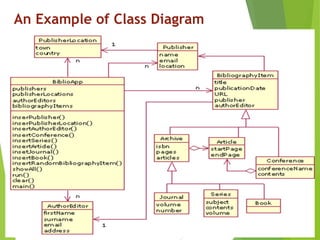
Composition- Composition is a stricter form of aggregation, in which the parts
may belong to only one whole and are existence-dependent on the whole. This
means that the life of each part is closely tied to the life of the whole. In other
words, the lifeline of the whole and the part are identical. When the whole is
created, the parts are created and when the whole is destroyed, the parts are
destroyed. In composition instance of one object contains instances of some
other objects.
A typical example of composition is an invoice object with invoice items. As
soon as the invoice object is created, all the invoice items in it are created and as
soon as the invoice object is destroyed, all invoice items in it are also destroyed.
The composition relationship is represented as a filled diamond drawn at the
composite-end.
1 *](https://image.slidesharecdn.com/systemdesign2-130721215751-phpapp01/85/ASP-NET-System-design-2-20-320.jpg)
![Relationship between Classes [contd..]
Inheritance/Generalization-Also called an "is a" or “is a kind of “
relationship, because the child class is a type of the parent class.
Generalization is the basic type of relationship used to define reusable
elements in the class diagram. Literally, the child classes "inherit" the
common functionality defined in the parent class.
The inheritance relationship is represented by means of an arrow with empty
triangular arrow head pointing from the subclass to the super-class.](https://image.slidesharecdn.com/systemdesign2-130721215751-phpapp01/85/ASP-NET-System-design-2-21-320.jpg)


The document provides information on Unified Modeling Language (UML) and its various diagrams used for modeling software systems. It discusses the background and benefits of object-oriented modeling. It then describes UML as a modeling language comprising various diagram types to capture different views of a system, including structural, behavioral, implementation and user views. Specific diagram types covered include use case diagrams, class diagrams, sequence diagrams, and object diagrams. Examples are provided for each diagram type to illustrate their elements and notation.